

Article Figures & Data
Figures
- Figure 1.
Distribution of EYFP-labeled CA1 interneurons and specific colocalization with SOM and PV. A, B, Montage of fluorescence images showing the mostly nonoverlapping distribution of EYFP-labeled INs in the hippocampus from SOM-IRES-Cre;Ai3-EYFP (A) and PV-Cre;Ai3-EYFP (B) mice. Scale bars, 100 µm. In the CA1 region, EYFP-labeled INs of SOM-IRES-Cre;Ai3-EYFP mice are present mostly in the oriens and alveus regions, whereas EYFP-labeled INs of PV-Cre;Ai3-EYFP mice are found near or in the pyramidal cell layer. C, D, Representative examples of specific colocalization of EYFP-labeled INs (top, green) from SOM-IRES-Cre;Ai3-EYFP (C) and PV-Cre;Ai3-EYFP (D) mice with immunofluorescence for somatostatin (middle left, red) and parvalbumin (middle right, red), respectively. Merged images are shown at bottom. Scale bars, 10 µm. Nearly all CA1 EYFP-labeled INs from SOM-IRES-Cre;Ai3-EYFP mice colocalized with somatostatin but not parvalbumin (C). Conversely, mostly all CA1 EYFP-labeled INs from PV-Cre;Ai3-EYFP mice were immunopositive for parvalbumin but not somatostatin (D).
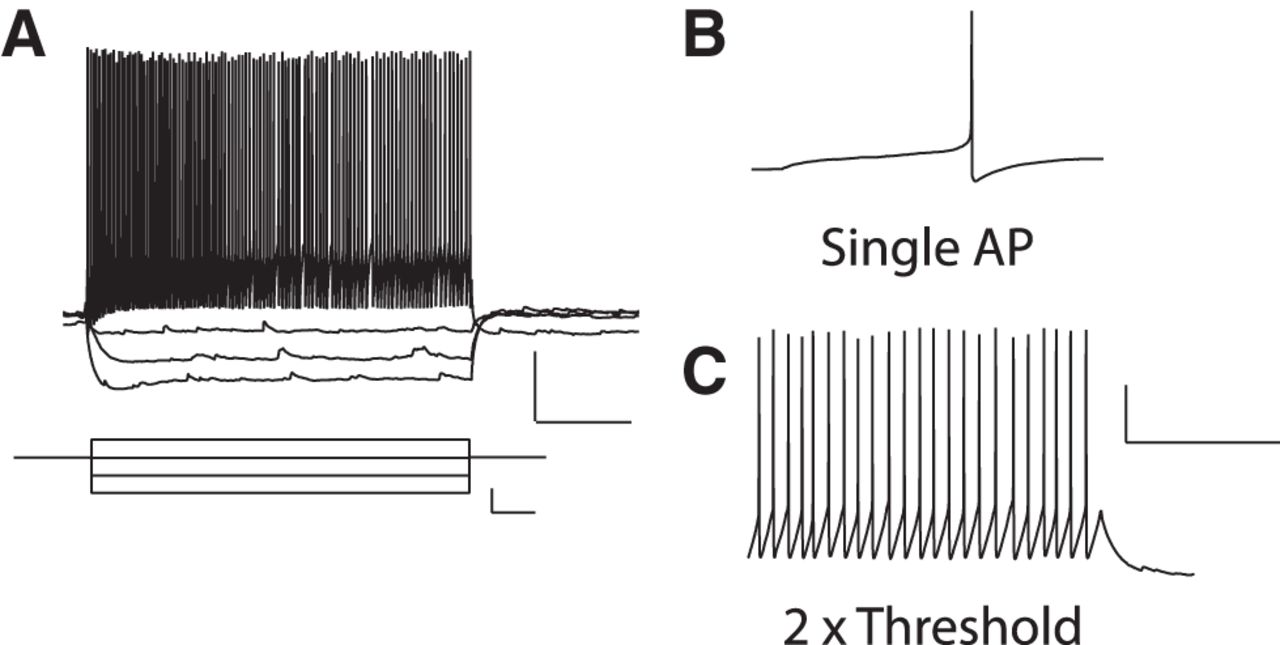
- Figure 2.
Membrane properties of CA1 EYFP-labeled SOM-INs. A, Example of voltage responses (top; scale bars: 20 mV, 200 ms) during current-clamp recordings evoked by current steps (bottom; scale bars: 40 pA, 100 ms) of varying amplitude from a representative CA1 EYFP-labeled SOM-IN (held at Vm of −60 mV). B, C, Representative examples of traces with single action potential (B) and repetitive firing (at 2× threshold; C) evoked by current-pulse injections. Scale bars: 20 mV, 200 ms.
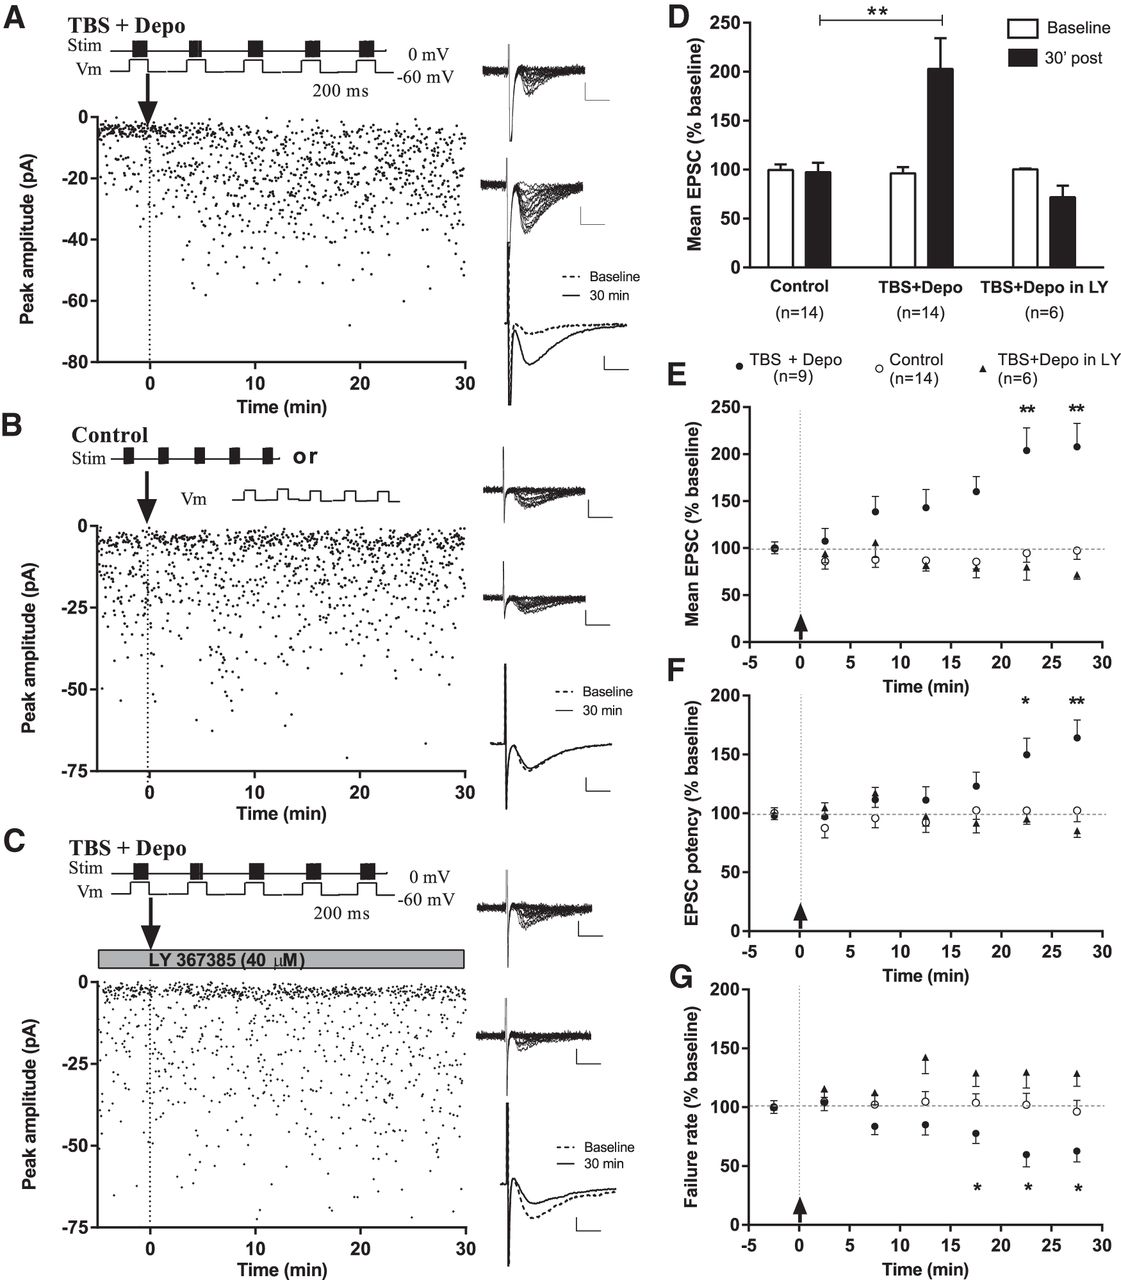
- Figure 3.
mGluR1a-dependent Hebbian LTP at excitatory synapses onto CA1 EYFP-labeled SOM-INs. A–C, Diagrams (top, left) showing the stimulation pairing protocol for LTP induction (A; theta-burst stimulation paired with postsynaptic depolarization; TBS + Depo), the control stimulation protocols (B; TBS or postsynaptic depolarization alone) and the stimulation pairing protocol in the presence of 40 μm LY367385, an mGluR1a antagonist (C; TBS + Depo in LY). EPSC amplitude time plots (bottom, left) from representative CA1 EYFP-labeled SOM-INs showing increase in EPSC amplitude after the pairing protocol (A) but not after control stimulation (B; TBS alone in this particular example) nor in the presence of LY367385 (C). Twenty consecutive EPSC traces from respective cells from baseline period (top, right) and 30 min poststimulation (middle, right). Scale bars: 20 pA, 5 ms. Superimposed average traces (of 100 individual events, including failures; bottom, right; scale bars: 5 pA, 5 ms) illustrating the increase in response after the pairing protocol (A) but not control stimulation (B) nor in the presence of LY367385 (C). D, Summary bar graph for all cells, showing no change in EPSC amplitude (including failures) after control stimulation, increase 30 min after the pairing protocol, and no change after the pairing protocol in the presence of LY367385. ANOVA, **p = 0.0025. E–G, Summary time plots of EPSC measures (5 min bins) showing gradual development of LTP over time in all cells showing LTP after pairing (n = 9), but not in cells with control stimulation (n = 14) nor in cells with the pairing stimulation in the presence of LY367385 (n = 6). LTP was manifested as an increase in EPSC amplitude (including failures; E) and potency (F), and a decrease in failure rate (G). ANOVA and Dunnett’s multiple-comparison tests; *p < 0.05, **p < 0.01.
- Figure 4.
Absence of LTP at the excitatory synapses onto CA1 EYFP-labeled PV-INs. A, B, Diagrams (top) showing the pairing protocol for LTP induction (A; theta-burst stimulation paired with postsynaptic depolarization; TBS + Depo) and the control stimulation protocols (B; TBS or postsynaptic depolarization alone). EPSC amplitude time plots (bottom, left) from representative CA1 EYFP-labeled PV-INs showing no increase in EPSC amplitude after the pairing protocol (A) nor after control stimulation (B; TBS alone in this example). Twenty individual traces from respective cells during baseline period (top, right) and 30 min poststimulation (middle, right). Scale bars: 10 pA, 5 ms. Superimposed average traces (of 100 individual events, including failures; bottom, right; scale bars: 5 pA, 5 ms) illustrating the failure to increase responses after the pairing protocol (A) or control stimulation (B). C, Summary time plots of EPSC amplitude (5 min bins) for all cells showing no change over time in EPSC amplitude (including failures) after the pairing protocol (n = 6) or control stimulation (n = 6). ANOVA and Dunnett’s multiple-comparison tests, p > 0.05. D, Summary bar graphs for all cells showing lack of LTP in PV-INs after the pairing protocol (n = 6; ANOVA, p = 0.205) or control stimulation (n = 6; p = 0.633).
- Figure 5.
mGluR1a-dependent LTP in current-clamp recordings with intact glutamatergic and GABAergic transmission. A, B, Averaged EPSPs from 30 consecutive responses during the baseline period (top, left) and 30 min after TBS (top, right) in the absence (A) and presence (B) of LY367385 from representative EYFP-labeled SOM-INs. Firing patterns during TBS (bottom). Note the prolonged depolarization underlying each burst in control conditions (A), which is abolished in the presence of LY367385 (B). Scale bars: top, 2 mV, 50 ms; bottom, 20 mV, 200 ms. C, Bar graph showing the decreased number of APs elicited during the TBS protocol in the absence (n = 8) and presence (n = 5) of LY367385 (Student’s test). D, Summary time plot of EPSP amplitude (5 min bins) for all cells, showing the gradual development of LTP over time, which is blocked in the presence of LY367385 (rmANOVA, p = 0.001, and Dunnett’s multiple-comparison tests from baseline). *p < 0.05, **p < 0.01, ***p < 0.001.
- Figure 6.
Regulation of Schaffer collateral pathway LTP by theta-burst stimulation in oriens-alveus. A. Diagram of experimental arrangement of extracellular recording and stimulation electrodes, and targeted CA1 pathways and cells. P, Pyramidal cell; I, inhibitory interneuron; SC, Schaffer collateral pathway; Rec, recording electrode; Alv, alveus; Or, stratum oriens; Pyr, stratum pyramidale; Rad, stratum radiatum; L-M, stratum lacunosum/moleculare. Arrowheads and bars refer to excitatory and inhibitory synapses, respectively. B–D, Time plots of Schaffer collateral fEPSP slope from individual representative slices from SOM-IRES-Cre;ArChR3/GFP mice showing LTP induced by HFS in stratum radiatum (B), enhanced LTP when HFS induction was preceded by a conditioning TBS in stratum oriens-alveus 30 min earlier (C), and no effect of TBS alone (D). Insets (B, C) are average fEPSPs (of 30 individual traces) during baseline, pre-HFS, and 30 min post-HFS. Scale bars: 0.5 mV, 5 ms. E, Summary fEPSP slope time plots for all slices, showing larger magnitude of HFS-induced LTP when preceded by TBS in stratum oriens-alveus. F, Summary bar graph showing increased HFS-induced LTP of fEPSP slope at 30 min postinduction after a conditioning TBS in oriens-alveus (TBS; HFS) relative to control without TBS (no TBS; HFS, ANOVA, **p = 0.0052), and no effects of TBS on fEPSPs in experiments without HFS.
- Figure 7.
TBS-induced enhancement of Schaffer collateral pathway LTP is prevented by SOM-INs hyperpolarization. A, Whole-cell current-clamp recordings from a representative GFP-expressing SOM-IN in acute slice of SOM-IRES-Cre;ArChR3/GFP mouse, showing responses to current step injections (left) and membrane hyperpolarization in response to wide-field yellow light (591 nm) exposition (right). Scale bars: left, 20 mV, 100 ms; right, 10 mV, 500 ms. B–D, Time plots of Schaffer collateral fEPSP slope from representative slices from SOM-IRES-Cre;ArChR3/GFP mice showing similar LTP induced by HFS in stratum radiatum when preceded by yellow light exposition 30 min earlier (B) and by conditioning TBS in stratum oriens-alveus during yellow light exposition (C), and no effect of yellow light exposition alone on fEPSPs (D). Insets (B, C) are average fEPSPs (of 30 individual traces) from baseline, pre-HFS, and 30 min post-HFS. Scale bars: 0.5 mV, 5 ms. E, Summary fEPSP slope time plots for all slices, showing no enhancement of HFS-induced LTP when TBS in stratum oriens-alveus is given during yellow light exposition. F, Summary bar graph showing similar HFS-induced LTP of fEPSP slope at 30 min postinduction after a conditioning TBS in oriens-alveus with versus without yellow light exposition (ANOVA, p = 0.0751; n.s.), and no effects of light alone on fEPSPs in experiments without HFS.
- Figure 8.
TBS-induced enhancement of Schaffer collateral pathway LTP is prevented by mGluR1a blockade. A–C, Time plots of Schaffer collateral fEPSP slope from representative slices from SOM-IRES-Cre;ArChR3/GFP mice showing that, in the presence of the mGluR1a antagonist LY367385, LTP induced by HFS in stratum radiatum (A) is similar to LTP induced by HFS which is preceded by conditioning TBS in stratum oriens-alveus 30 min earlier (B), and that fEPSPs are unaffected during long-term recordings in the presence of LY367385 (C). Insets (A, B) are average fEPSPs (of 30 individual traces) from baseline, pre-HFS, and 30 min post-HFS. Scale bars: 0.5 mV, 5 ms. D. Summary fEPSP slope time plots for all slices, showing no enhancement of HFS-induced LTP when TBS in stratum oriens-alveus is given in the presence of LY367385. E, Summary bar graph showing similar HFS-induced LTP of fEPSP slope at 30 min postinduction whether preceded or not by a conditioning TBS in oriens-alveus in the presence of LY367385 (ANOVA followed by Dunnett’s multiple-comparison test, p > 0.05), lack of TBS-induced enhancement of Schaffer collateral pathway LTP in the presence of LY367385 (ANOVA, **p = 0.0052) and no effects of LY367385 alone on fEPSPs in experiments without HFS.


Tables
Data structure Type of test Power a Normal distribution paired t test 0.0025 b Normal distribution paired t test 0.75 c Normal distribution ANOVA 0.0001 d Normal distribution rmANOVA, Dunnett's post hoc 0.0016 e Normal distribution rmANOVA, Dunnett's post hoc 0.0025 f Normal distribution rmANOVA, Dunnett's post hoc 0.011 g Normal distribution rmANOVA 0.7512 h Normal distribution rmANOVA 0.9456 i Normal distribution rmANOVA 0.6528 j Normal distribution rmANOVA 0.0846 k Normal distribution rmANOVA 0.3121 l Normal distribution rmANOVA 0.1212 m Normal distribution paired t test 0.2057 n Normal distribution paired t test 0.6333 o Normal distribution ANOVA 0.0005 p Normal distribution rmANOVA, Dunnett’s post hoc 2.66E-7 q Normal distribution t test 0.0053 r Normal distribution rmANOVA, Dunnett’s post hoc 0.0007 s Normal distribution paired t test 0.01 t Normal distribution paired t test 0.0001 u Normal distribution paired t test 0.0052 v Normal distribution paired t test 0.5794 w Normal distribution paired t test 0.0001 x Normal distribution paired t test 0.003 y Normal distribution rmANOVA, Dunnett's post hoc 0.0751 z Normal distribution paired t test 0.069 aa Normal distribution paired t test 0.005 ab Normal distribution paired t test 0.0005 ac Normal distribution paired t test 0.4856
In this issue


