

Article Figures & Data
Figures
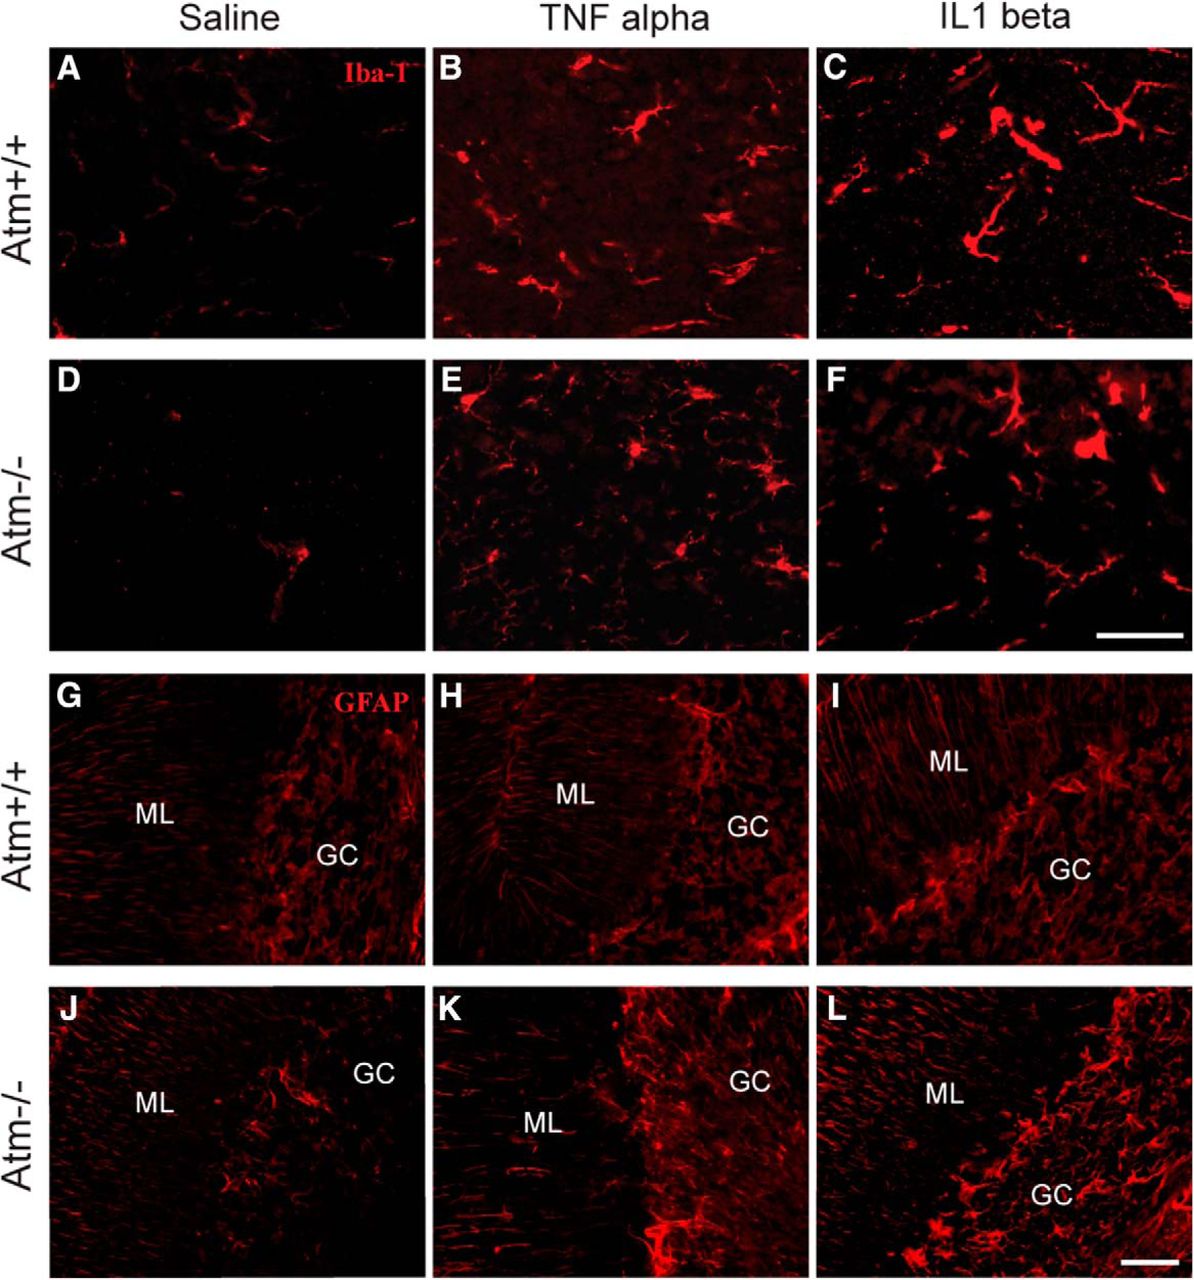
- Figure 1
Inflammatory conditions induced by TNFα and IL1β in the cerebellum. TNFα and IL1β triggered microglial activation in both wild-type (A–C) and Atm−/− (D–F). Both cytokines stimulated astrocytic activation in Atm−/− (J–L) but not in wild-type (G–I). GC, Granule cell layer; M, molecular layer. Scale bar, 50 µm.
- Figure 2
TNFα and IL1β produced opposite responses on cerebellar Purkinje cells in Atm+/+ and Atm−/− animals. Cyclin A (A–C), γ-H2AX (D, E), cleaved caspase 3 (G–I), and nuclear HDAC4 (J–L) were measured after cytokine injection. ATM deficiency induced increase in these markers in Purkinje cells (PCs; M–P). TNFα significantly reduced cyclin A in Atm+/+ PCs (M) and γ-H2AX in Atm−/− PCs (D, E), whereas IL1β significantly induced cyclin A (A, C, M) and HDAC4 nuclear translocation (J, L, P). TNFa had no effect or slightly reduced these markers in Atm−/− PCs. Quantification confirmed these findings (M, N, P). Cleaved caspase 3 signals were similar in all treatment groups (G–I, O). White arrows indicate PCs with respective damage markers. GC, Granule cell layer; ML, molecular layer. Scale bar, 50 µm. n = 3 for each group.
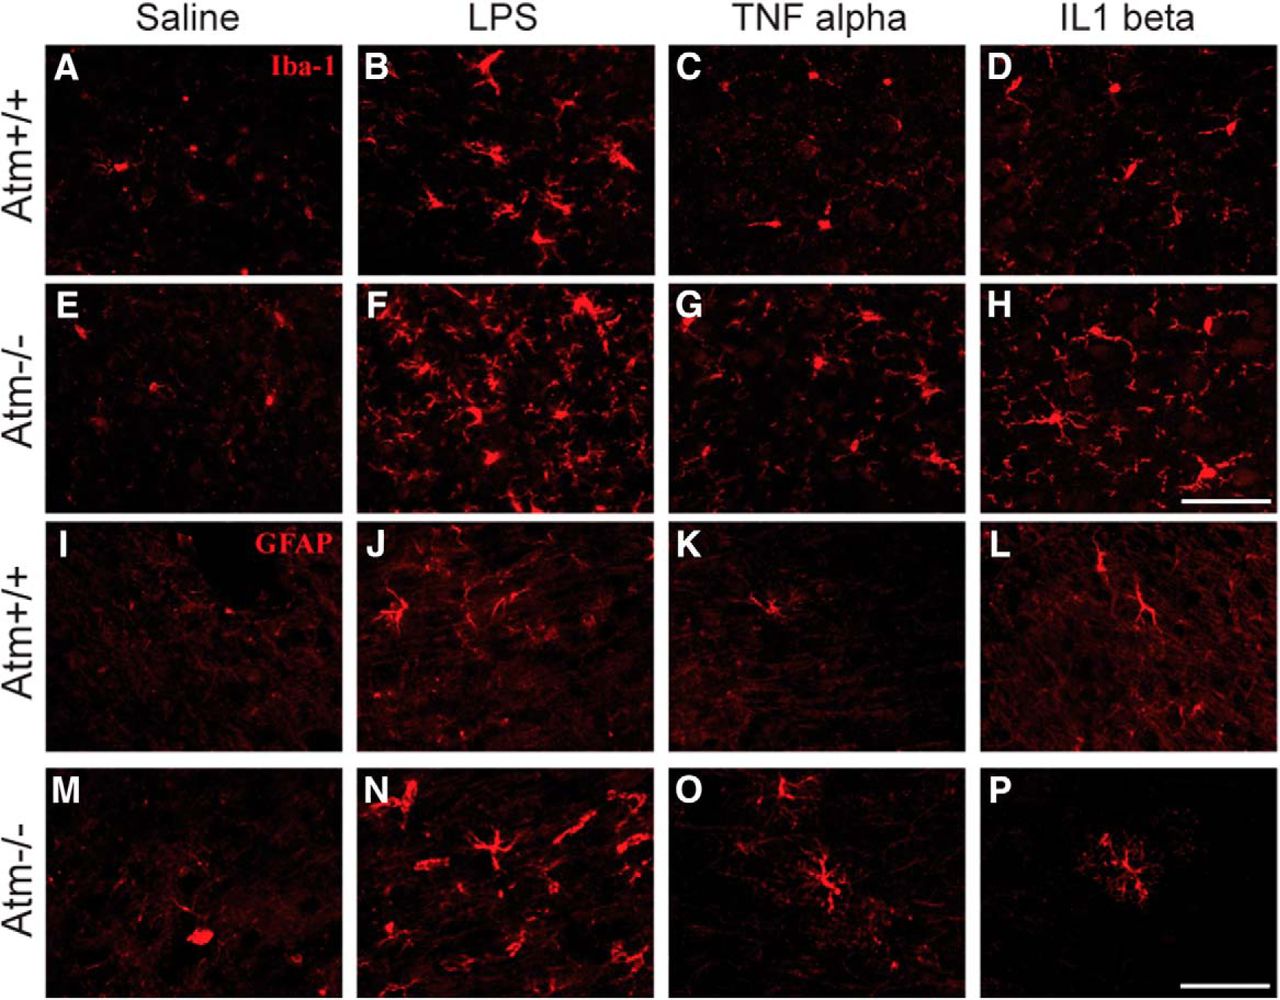
- Figure 3
Inflammatory responses induced by LPS, TNFα and IL1β in frontal cortex. In saline-treated animals of both wild-type (A) and mutant (E) cortex, the microglia appeared in a typical resting phenotype. After LPS treatment (B, F), microglia of both genotypes appeared reactive. GFAP, a marker for activated astrocytes, increased in both wild-type (J) and Atm −/− mice (N) after LPS treatment. Although, TNFα and IL1β produced microglial (G, H) and astrocytic (O, P) reactions only in Atm −/− frontal cortex. Scale bar, 50µm.
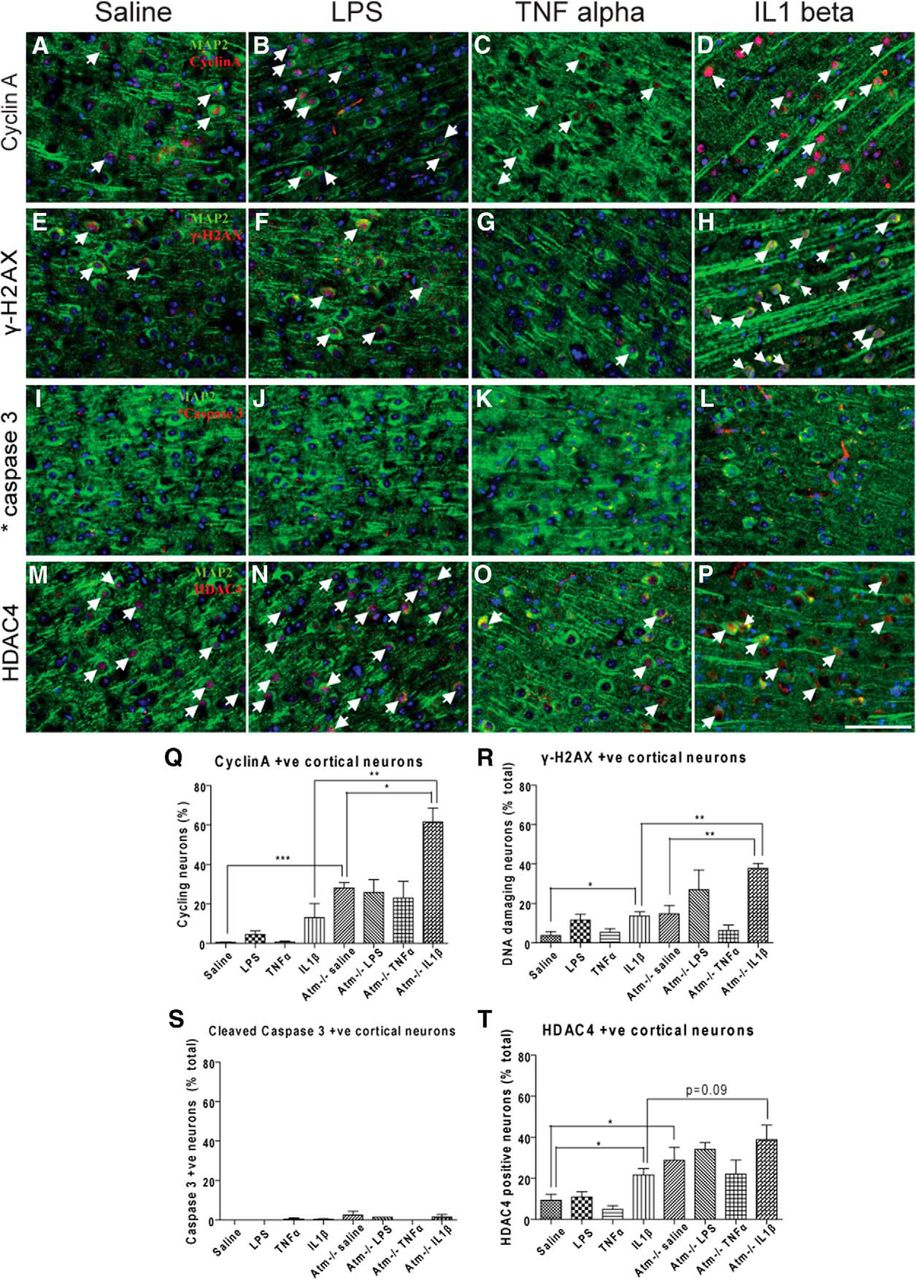
- Figure 4
TNFα and IL1β stimulated opposite responses in Atm+/+ and Atm−/− frontal cortexes. Cyclin A (A–D), γ-H2AX (E–H), cleaved caspase 3 (I–L) and nuclear HDAC4 (M–P) were measured after LPS or cytokine injection. ATM deficiency significantly increasedγ-H2AX in PCs (R). LPS treatment failed to significantly increase the expression of all markers (B, F, J, N). TNFα reduced γ-H2AX (G), whereas IL1β increased it (H). By contrast TNFα had little effect on cyclin A (C) or HDAC4 nuclear localization (O), whereas IL1β increased both (D, P) in Atm−/− and Atm+/+ frontal cortex (M–P). Cleaved caspase 3 signals were similar in all treatment groups (I–L). White arrows indicate neurons with respective damage markers. Scale bar, 50 µm. n = 3 for each group.
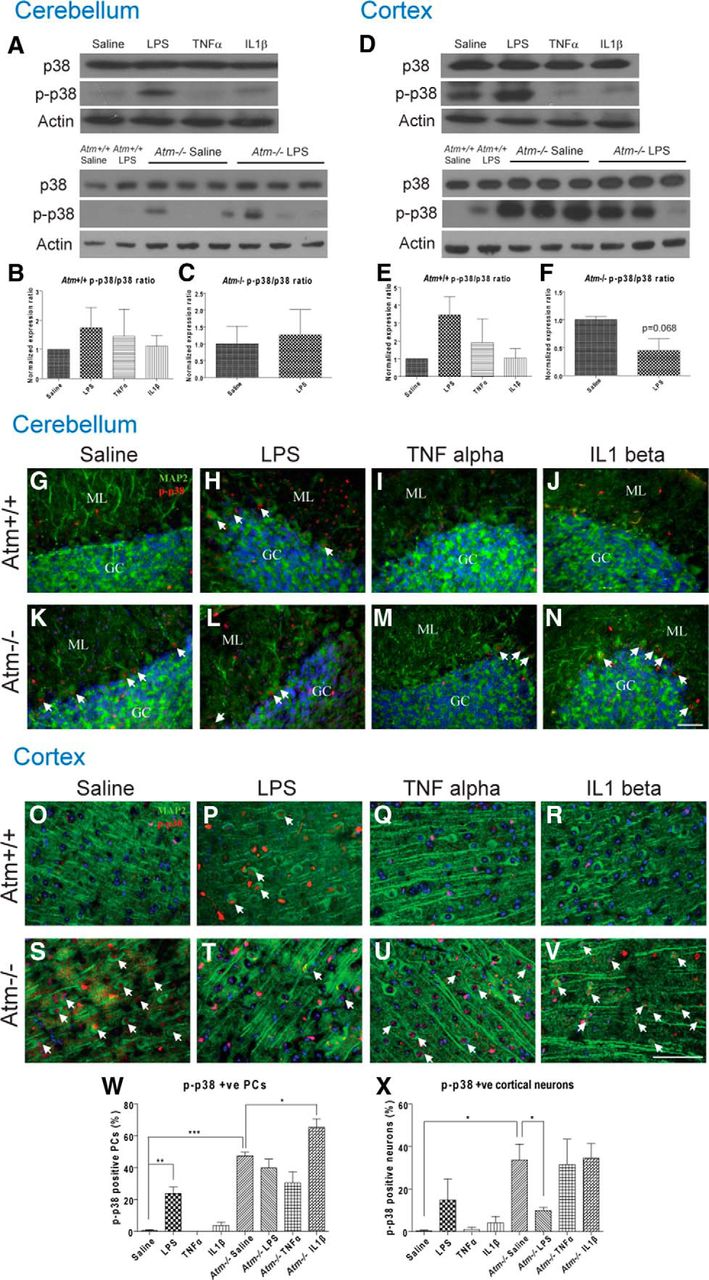
- Figure 5
p38 MAP kinase phosphorylation level varied across treatment groups. p38 phosphorylation levels were significantly induced in wild-type cerebellum and cortex following LPS treatment (A, D). Quantification showed high variability across each animal (B, E). Phospho-p38 immunohistochemistry confirmed the Western results (G, H, O, P, W, X). Atm−/− neurons had increased phospho-p38 levels in both cerebellum and cortex (G, K, O, S); quantification confirmed (W, X). LPS reduced phospho-p38 levels in Atm−/− cortex as shown by Western blot (D, F) and immunohistochemistry (S, T, X) but had no effects on Atm−/− cerebellum (A, C, K, L, W). IL1β induced p38 phosphorylation in Atm−/− Purkinje cells (K, N, W). White arrows indicate neurons with nuclear phospho-p38. GC, Granule cell layer; ML, molecular layer. Scale bar, 50 µm. n = 5 for wild-type animals and n = 3 for Atm-/- animals.
- Figure 6
MAP kinase levels in the cerebellum and frontal cortex after different inflammatory challenges. In cerebellum, phosphorylation levels of JNK trended lower after inflammatory stimuli (A, B). This effect was enhanced in Atm −/−, where LPS significantly reduced the levels of phospho-JNK (D, E). In cortex, the reverse situation was found. Phospho-JNK decreased significantly in wild-type after immune challenge (G, H), whereas in Atm −/− phospho-JNK only trended lower after LPS. In both regions and both genotypes, the levels of ERK phosphorylation were largely unchanged after an immune stimulus (C, F, I, L). n = 5 for wild-type animals and n = 3 for Atm−/− animals.
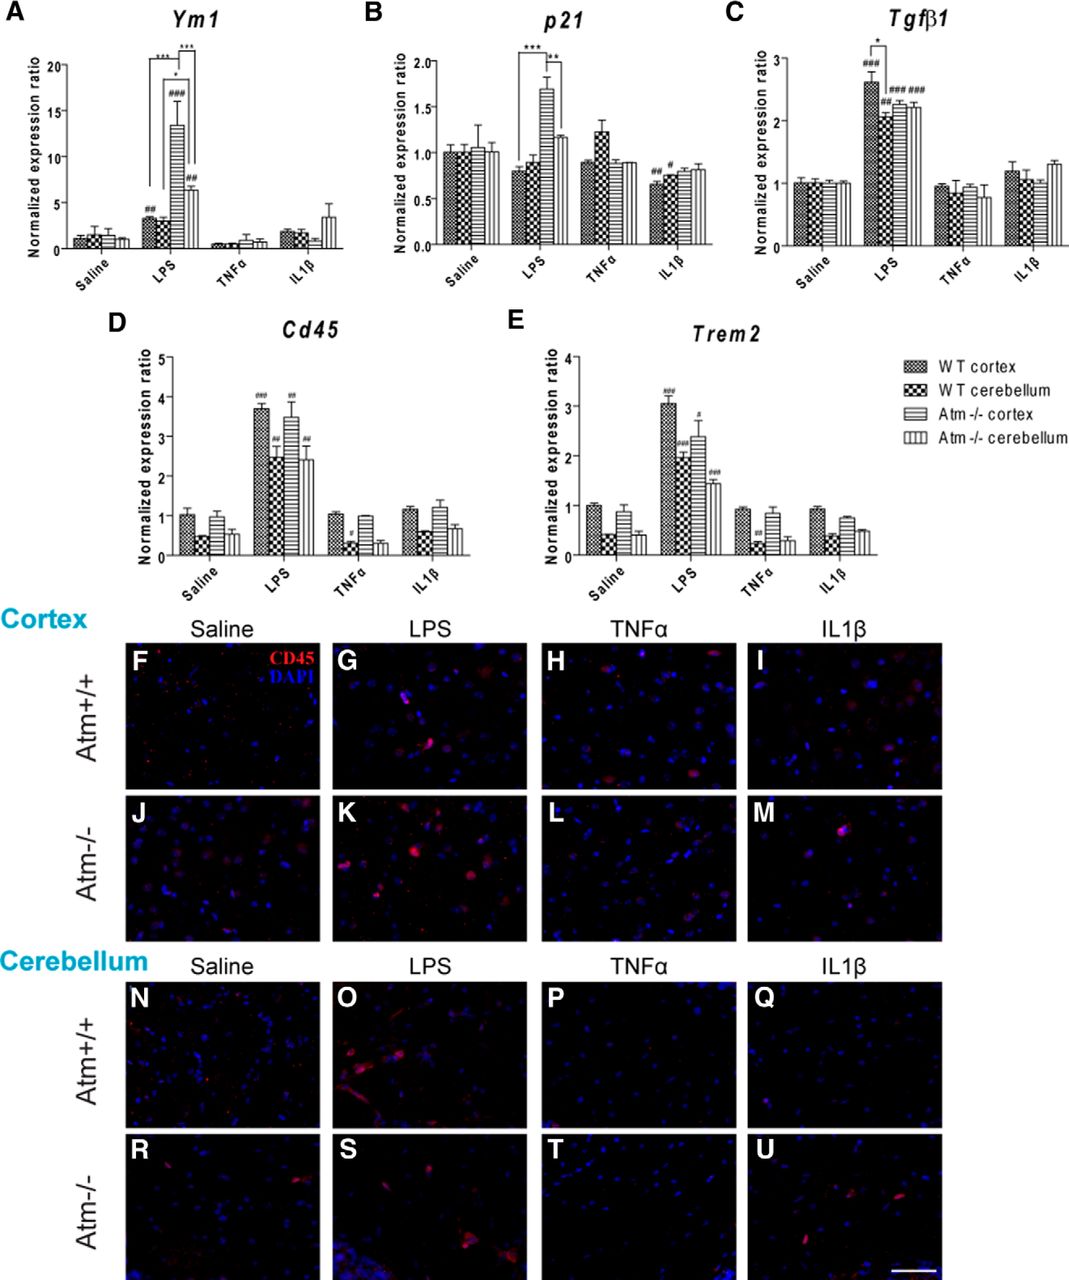
- Figure 7
Expression patterns of anti-inflammation associated genes and monocyte infiltration following cytokine stimulation. In wild-type and Atm−/− mouse cortex, LPS administration significantly triggered the expression of Ym1 (A), p21 (B), Tgfβ1 (C), Cd45 (D), and Trem2 (E); with the exception of a modest change in p21 expression in wild-type, the individual cytokines were without effect. TNFα specifically suppressed Cd45 (D) and Trem2 (E) in cerebellum of both genotypes. Similar patterns were observed by CD45 protein expression (F–U). *p < 0.05; **p < 0.01; ***p < 0.001 between cortex and cerebellum in the same treatment group; #p < 0.05; ##p < 0.01; ###p < 0.001 between the values of LPS/cytokine treated and the respective saline-treated cortex or cerebellum groups. Scale bar, 50 µm. n = 3 for each group.
- Figure 8
Persistent effects of an immune challenge in Atm −/−, but not wild-type mice. In both wild-type and Atm−/− cerebellum, microglia (A–D) and astrocytes (E–H) had returned to resting morphologies after a 1 month recovery. Despite this, calbindin staining revealed that in LPS challenged Atm−/− mice (J) the Purkinje cells remained dystrophic compared with Purkinje cells in untreated Atm−/− animals (I). In cortex, Iba-1 staining revealed the persistence of activated microglia in LPS-treated mutant (Atm −/−) animals but not in wild-type (K–N). Astrocyte morphologies returned to resting states in all animal groups (O–R). GC, Granule cell layer; ML, molecular layer. Scale bar, 50 µm. n = 3 for each group.


Tables
Wild-type (saline) Wild-type (LPS) Atm−/− (saline) Atm−/− (LPS) Cyclin A 3.75 ± 0.35 4.27 ± 1.08 11.83 ± 2.50 25.2 ± 2.73 ** Cyclin D1 0.33 ± 0.33 0.88 ± 0.06 1.66 ± 0.87 2.42 ± 1.53 γ-H2AX 11.5 ± 2.27 6.21 ± 3.32 45.9 ± 11.61 49.6 ± 14.0 Cleaved caspase 3 8.68 ± 2.16 10.2 ± 3.47 15.2 ± 0.78 14.4 ± 0.31 HDAC4 5.76 ± 2.94 1.76 ± 1.36 11.8 ± 5.32 4.63 ± 1.89 ↵** Plus bold font = p < 0.05 compared with the Atm−/− group injected with saline.
Wild-type (saline) Wild-type (LPS) Atm−/− (saline) Atm−/− (LPS) Cyclin A 1.98 ± 0.96 1.48 ± 0.24 26.58 ± 2.30 38.0 ± 3.31* Cyclin D1 1.33 ± 0.97 1.48 ± 0.77 3.59 ± 1.09 6.09 ± 3.10 γ-H2AX 2.58 ± 1.74 4.08 ± 2.34 6.53 ± 2.56 8.02 ± 0.95 Cleaved caspase 3 0 0 0 0 HDAC4 4.40 ± 2.27 7.13 ± 2.55 14.6 ± 0.36 22.2 ± 15.3 ↵* Plus bold font = p < 0.05 compared with the Atm−/− group injected with saline.
Data structure Type of test Power a (Fig. 2M) Normally distributed Unpaired t test 1.00 b (Fig. 2M) Normally distributed Unpaired t test 0.96 c (Fig. 2M) Normally distributed Unpaired t test 1.00 d (Fig. 2M) Normally distributed Unpaired t test 0.80 e (Fig. 2N) Normally distributed Unpaired t test 0.80 f (Fig. 2N) Normally distributed Unpaired t test 1.00 g (Fig. 2N) Normally distributed Unpaired t test 1.00 h (Fig. 2N) Normally distributed Unpaired t test 1.00 i (Fig. 2O) Normally distributed Unpaired t test 1.00 j (Fig. 2O) Normally distributed Unpaired t test 0.29 k (Fig. 2P) Normally distributed Unpaired t test 1.00 l (Fig. 2P) Normally distributed Unpaired t test 1.00 m (Fig. 4Q) Normally distributed Unpaired t test 0.99 n (Fig. 4Q) Normally distributed Unpaired t test 1.00 o (Fig. 4Q) Normally distributed Unpaired t test 1.00 p (Fig. 4R) Normally distributed Unpaired t test 0.93 q (Fig. 4R) Normally distributed Unpaired t test 1.00 r (Fig. 4R) Normally distributed Unpaired t test 1.00 s (Fig. 4T) Normally distributed Unpaired t test 0.83 t (Fig. 4T) Normally distributed Unpaired t test 0.78 u (Fig. 4T) Normally distributed Unpaired t test 0.60 v (Fig. 5E) Normally distributed Paired t test 0.27 w (Fig. 5F) Normally distributed Unpaired t test 0.70 x (Fig. 5W) Normally distributed Unpaired t test 1.00 y (Fig. 5W) Normally distributed Unpaired t test 1.00 z (Fig. 5W) Normally distributed Unpaired t test 0.86 aa (Fig. 5X) Normally distributed Unpaired t test 0.31 bb (Fig. 5X) Normally distributed Unpaired t test 0.99 cc (Fig. 5X) Normally distributed Unpaired t test 0.88 dd (Fig. 6B) Normally distributed Paired t test 0.21 ee(Fig. 6E) Normally distributed Unpaired t test 0.98 ff (Fig. 6H) Normally distributed Paired t test 0.93 gg (Fig. 6H) Normally distributed Paired t test 0.69 hh (Fig. 6K) Normally distributed Paired t test 0.70 ii (Fig. 7A) Normally distributed Unpaired t test 1.00 jj (Fig. 7A) Normally distributed Unpaired t test 1.00 kk (Fig. 7A) Normally distributed Unpaired t test 1.00 ll (Fig. 7A) Normally distributed Unpaired t test 1.00 mm (Fig. 7A) Normally distributed Unpaired t test 1.00 nn (Fig. 7B) Normally distributed Unpaired t test 1.00 oo (Fig. 7B) Normally distributed Unpaired t test 1.00 pp (Fig. 7B) Normally distributed Unpaired t test 0.98 qq (Fig. 7B) Normally distributed Unpaired t test 0.87 rr (Fig. 7C) Normally distributed Unpaired t test 1.00 ss (Fig. 7C) Normally distributed Unpaired t test 0.87 tt (Fig. 7C) Normally distributed Unpaired t test 1.00 uu (Fig. 7C) Normally distributed Unpaired t test 1.00 vv (Fig. 7C) Normally distributed Unpaired t test 1.00 ww (Fig. 7D) Normally distributed Unpaired t test 1.00 xx (Fig. 7D) Normally distributed Unpaired t test 1.00 yy (Fig. 7D) Normally distributed Unpaired t test 1.00 zz (Fig. 7D) Normally distributed Unpaired t test 1.00 aaa (Fig. 7D) Normally distributed Unpaired t test 0.89 bbb (Fig. 7E) Normally distributed Unpaired t test 1.00 ccc (Fig. 7E) Normally distributed Unpaired t test 1.00 ddd (Fig. 7E) Normally distributed Unpaired t test 1.00 eee (Fig. 7E) Normally distributed Unpaired t test 1.00 fff (Fig. 7E) Normally distributed Unpaired t test 1.00 ggg (Table 1) Normally distributed Unpaired t test 0.95 hhh (Table 2) Normally distributed Unpaired t test 0.81
In this issue


