

Article Figures & Data
Figures
- Figure 1
Sema4B is expressed by astrocytes in vivo. A, Sema4B-expressing cells were identified in the mouse cortices using anti-β-gal antibody (which recognizes the Sema4B−β-gal fusion protein). In each set of experiments, Sema4B+/− mice without injury, and 1, 3, and 7 d postinjury were analyzed. A z-stack of four optical sections is presented after staining with anti-NeuN, anti-GFAP, and anti-β-gal (top); or anti-Iba1, anti-GFAP, and anti-β-gal (bottom). The representative result 7 d after injury is shown. Yellow arrows mark examples of astrocytes, and orange arrows mark examples of microglia. Note the close proximity of the β-gal staining to the GFAP-positive staining but not to NeuN- or IbaI-positive staining. Scale bars, 10 μm. Multiple cells in a number of sections from three different mice were analyzed at each time point. B, Quantitation represented as the number of positive cells per section for cells stained with anti-β-gal and anti-GFAP is shown. C, Immunoblots of protein samples extracted from Sema4B+/+ and Sema4B−/− mouse brains are presented. Arrow marks the Sema4B-specific signal, and arrowhead marks a nonspecific band recognized by this antibody. D, Cortical tissue was dissociated and separated on MACS columns using ACSA-2-beads. Cell samples after the separation of cells were analyzed by FACS using anti-ACSA2-APC antibody. E, Immunoblots of protein samples extracted from the positive (ACSA2+) and negative (ACSA2−) fractions. The blot was probed with anti-Sema4B antibody. Note that in the positive fraction there are two bands (the bottom one is the Sema4B signal), while in the negative fraction only the top band, which is a nonspecific band, appears (marked with an arrowhead).
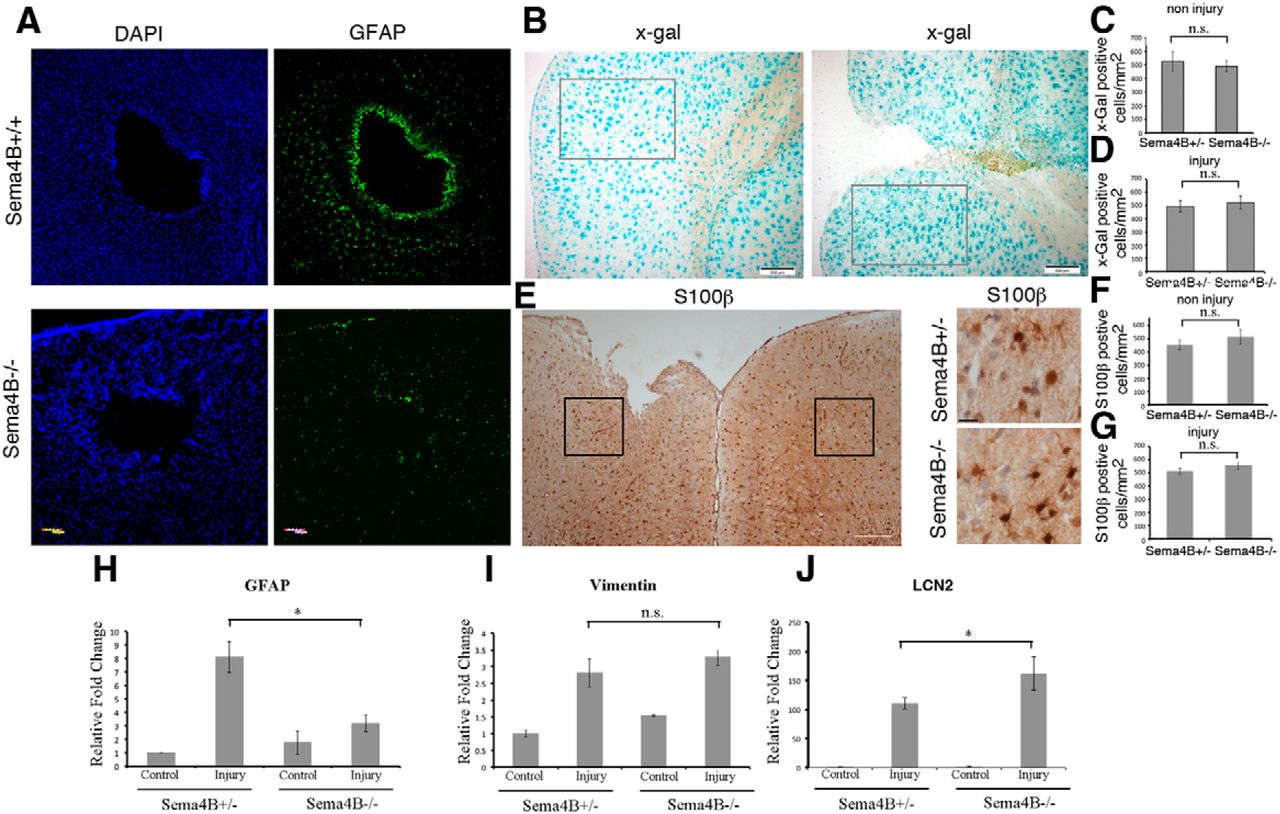
- Figure 2
Astrocyte activation profile is modified in Sema4B−/− mutant mice. A, Representative examples of a horizontal section of wild-type (n = 7) and Sema4B mutant cortices were stained with GFAP (green) and Hoechst stain (blue) 7 d after injury. Note the reduced activation indicated by GFAP staining near the site of injury in the mutant mouse. Scale bar, 100 μm. B, a representative coronal section of Sema4B+/− with or without injury stained with X-gal histochemistry. Scale bar, 200 μm. The gray boxes mark the area of counting that was used in all sections. C, Quantitation of X-gal-positive cells/area in the noninjured cortex of Sema4B+/− and Sema4B−/− mice. D, Quantitation of the number of X-gal-positive cells per area in the injured cortex of Sema4B+/− and Sema4B−/− mice. E, Representative example of cortex after injury in low magnification, stained with anti-S100β. The black boxes mark the area of counting (in F and G). Scale bar, 200 μm. Representative example of Sema4B+/− and Sema4B−/− mice near the site of injury stained with S100β is also shown. Scale bar, 20 μm. Note that the typical astrocyte hypertrophy is detected in both Sema4B+/− and Sema4B−/−. F, Quantitation of the number of S100β-positive cells per area in the noninjured cortex of Sema4B+/− and Sema4B−/− mice. G, Quantitation of the number of S100β-positive cells per area in the injured cortex of Sema4B+/− and Sema4B−/− mice. H−J, Relative mRNA levels were measured using real-time PCR analysis (mean ± SEM) of cortical tissue at the site of injury 1 d postinjury (I: LCN2, Sema4B+/−, n = 4; Sema4B−/−, n = 5) and 7 d postinjury (J: GFAP; H, vimentin; n = 5; Sema4B+/−, n = 5; Sema4B−/−, n = 6). GFAP LCN-2 and vimentin in each sample were normalized relative to GAPDH (similar results were obtained when samples were normalized to ALDH1L1). Note the change in postinjury astrocyte activation profile in the Sema4B−/− cortex (low GFAP, normal activation of vimentin, and higher activation than normal for LCN2. For GFAP, p = 0.0081; for LCN2, p = 0.0357.
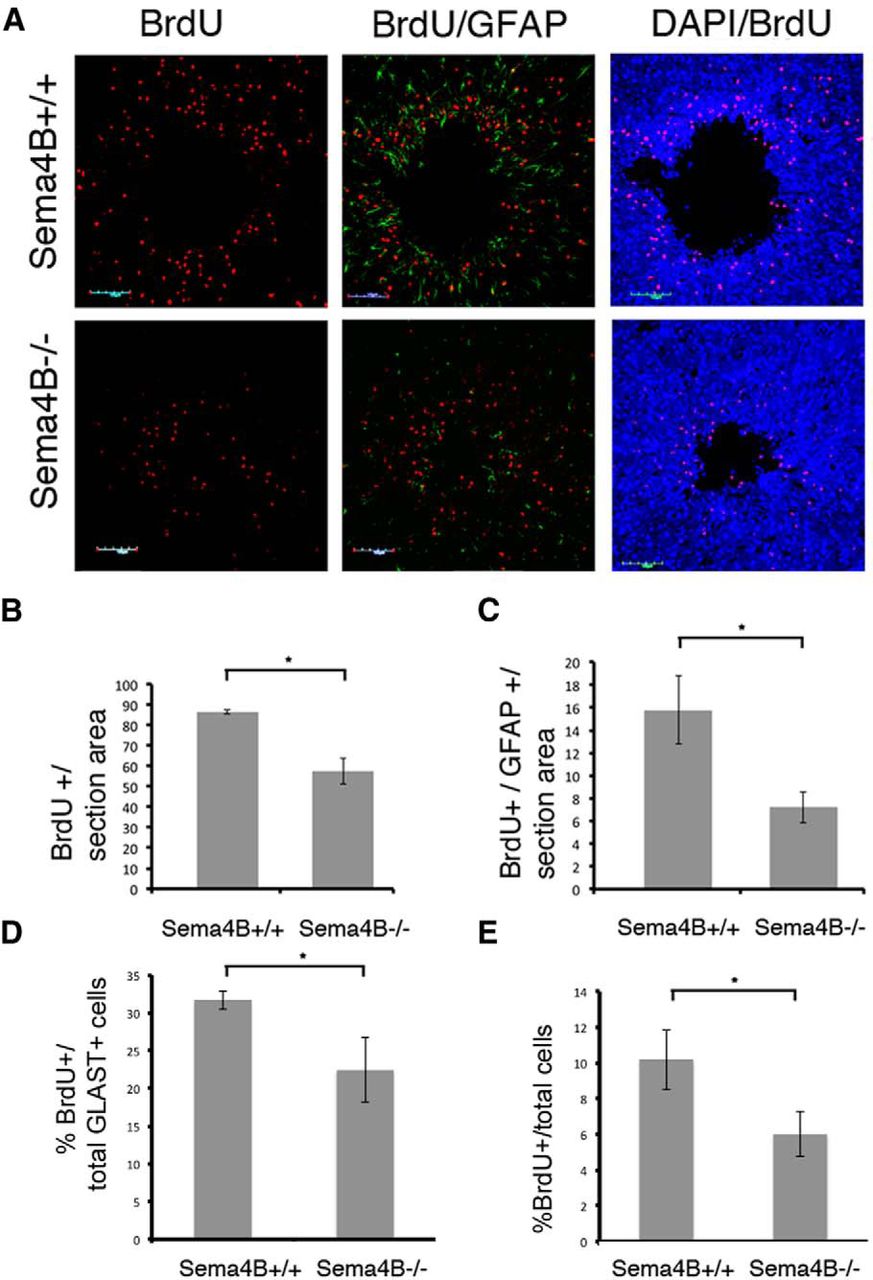
- Figure 3
Astrocyte proliferation in vivo is reduced in Sema4B−/− mutant mice. A, Representative cortical slices in Sema4B+/+ and Sema4B−/− mutant mice 7 d postinjury. The panel shows proliferating cells labeled with BrdU (red), activated astrocytes stained with anti-GFAP (green), and total cells labeled with DAPI (blue). Scale bars, 100 μm. B, C, Quantification of the total number of proliferating cells (BrdU+; B) and of proliferating astrocytes (GFAP+/BrdU+; C). D, Cell proliferation evaluation by flow cytometry analysis of the cortical injury site. The cortical tissue site was dissociated, and analyzed using anti-BrdU and anti-GLAST antibodies. Results in B−E are given as the mean ± SEM. B, p = 0.032; C, p = 0.041; D, p = 0.0285; and E, p = 0.0385.
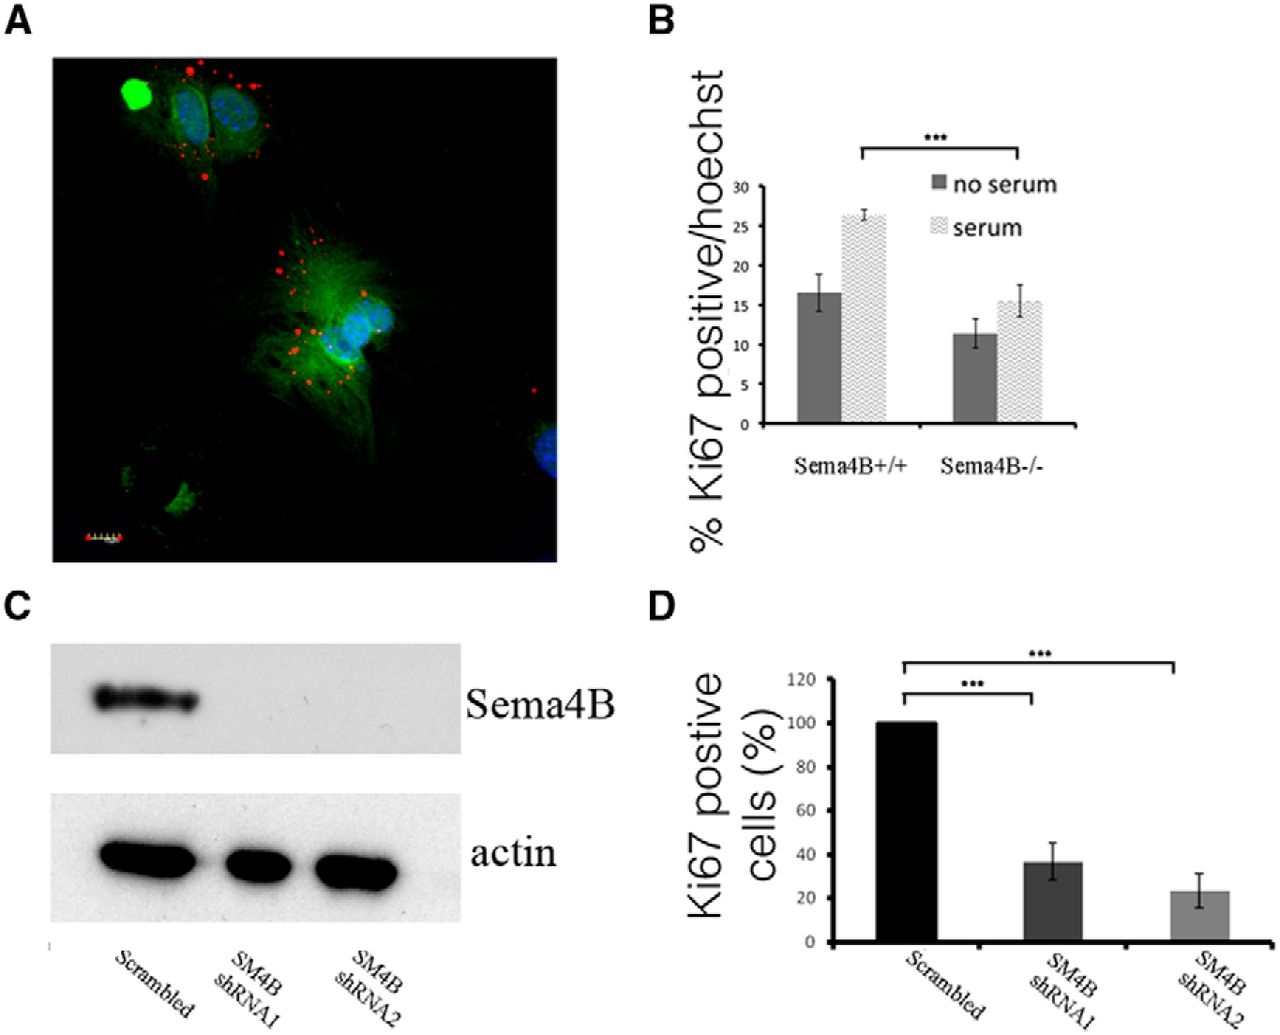
- Figure 4
Both short-term and long-term inhibition of Sema4B reduces the proliferation of astrocytes in vitro. A, Sema4B-expressing astrocytes in culture were identified using anti-β-gal antibody and GFAP. Scale bar, 10 μm. B, Quantification of proliferating cultured astrocytes (percentage of Ki-67-positive cells/Hoechst stain) is shown. For this experiment, astrocytes from wild-type and mutant mice were serum starved for 3 d before being stimulated with serum and tested for proliferation. C, D, Short-term inhibition of Sema4B in primary astrocytes from wild-type mice is shown. C, Representative Western blot showing reduction in the levels of Sema4B, 72 h after infection with two different anti-Sema4B shRNAs or a scrambled shRNA (n = 3). D, Quantification of proliferating shRNA-treated wild-type astrocytes (percentage of Ki-67-positive cells/Hoechst stain) is shown. Results in B and D are the mean ± SEM of four independent experiments in each case. B, p = 2.5E-9; and D, p = 0.000153 and p = 0.000704.
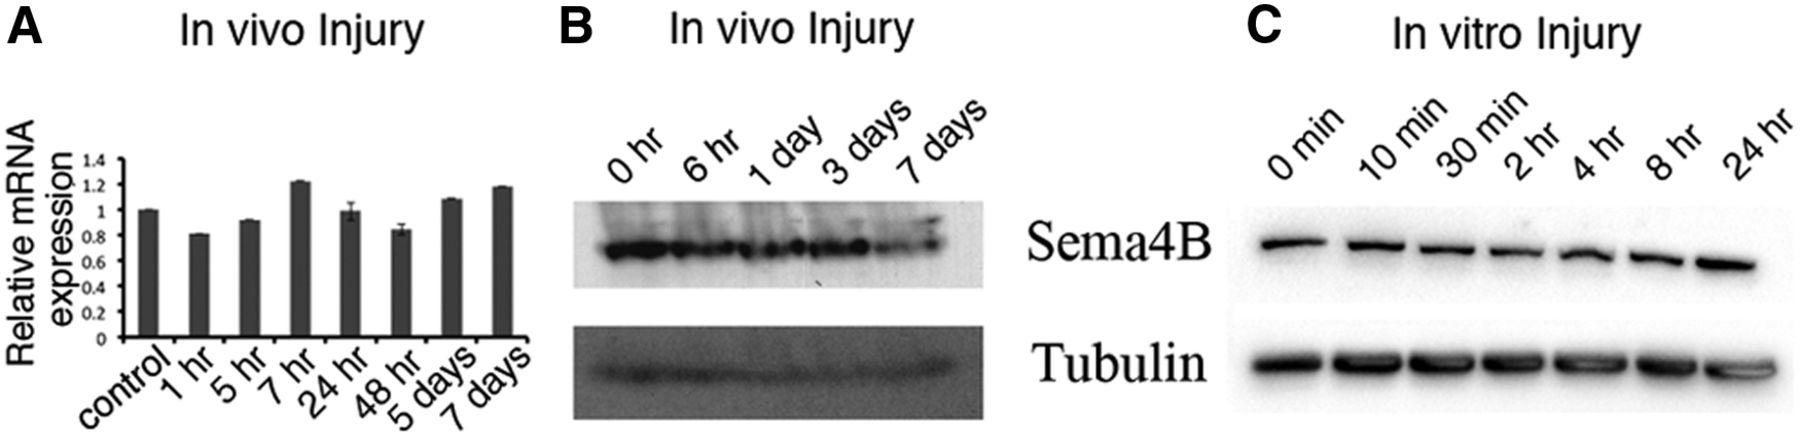
- Figure 5
Sema4B is not regulated at the level of mRNA or protein. A, B, Sema4B RNA (A) and protein (B) expression in a biopsy sample obtained from cortex near the site of injury. A, Real-time PCR assay of Sema4B mRNA in the cortex at different time points after injury (n = 3). B, Representative Western blot of protein samples at different time points after injury are shown (n = 4). C, Protein was extracted from confluent astrocyte cultures at different time points after scratch wound injury and analyzed with anti-Sema4B. The same blots were also tested for tubulin.
- Figure 6
Sema4B is phosphorylated at Ser825 after growth factor stimulation or injury. A, Immunoblots of protein samples extracted from Sema4B+/+ and Sema4B−/− brains and tested with anti-phospho-Sema4B and anti-tubulin are shown. B, Protein extracted from biopsy samples from the site of the mouse cortical stab wound injury at different times after injury. Representative results are shown. C, Densitometric analysis of the phospho-Sema4B/actin ratio at different times after cortical injury is shown (n = 4). D, Western blots of protein samples were extracted from mouse cortical astrocytes at different times after mechanical injury. Representative Western blots obtained with anti-phospho-Sema4B at various time points are shown. The same blots were also tested for p-ERK1/2 and actin. E, Quantification of the phospho-Sema4B/actin ratios obtained in the mechanical injury experiments are shown (n = 4). F, Western blots of protein samples were extracted from mouse cortical astrocytes at different times after stimulation with 100 ng/ml EGF. G, Densitometric analysis of the phospho-Sema4B/actin ratio at different times after stimulation with 100 ng/ml EGF (mean ± SEM of three independent experiments is shown for each time point). Results in B, D, and E are given as the mean ± SEM of four independent experiments.


Tables
- Table 1
Post hoc power calculations for m independent experiments with Bonferroni correction k
Figure Panel Data structure Type of test Power 2 C Normality not assumed Mann-Whitney 55.9 D Normality not assumed Mann-Whitney 53.2 F Normality not assumed Mann-Whitney 61.7 G Normality not assumed Mann-Whitney 10.7 H Normality not assumed Mann-Whitney 12.3 I Normality not assumed Mann-Whitney 2.6 J Normality not assumed Mann-Whitney 12.6 3 B Normality not assumed Mann-Whitney 21.5 C Normality not assumed Mann-Whitney 63.3 D Normality not assumed Mann-Whitney 36.4 4 B Normality not assumed Mann-Whitney 100 D Normality not assumed Mann-Whitney 100100 7 A Normality not assumed Mann-Whitney 37.1 B Normality not assumed Mann-Whitney 90 J Normality not assumed Mann-Whitney 100100 K Normality not assumed Mann-Whitney 99.9100 From Fisher's χ2 test for combined probabilities, we have that χ2 (df = 2m) ∼ –2ln(p1p2…pm), where pi is the p value for the ith independent experiment. The post hoc expected value of χ2 is just the df + the noncentrality parameter (λ). Thus, for three independent experiments, say λ is given by –2ln(p1p2p3) – 6. The power can then be obtained directly using G*Power 3 software with α = 0.05/k.
In this issue


