

Article Figures & Data
Figures
- Figure 1
BACE1 protein expression is increased in LRP1-KO cells relative to WT cells. A, Cell lysates of LRP1-KO and WT cells were analyzed by Western blotting with antibodies against APP, BACE1, and LRP1. B, Quantification of relative protein levels in A (n = 3, *p < 0.05). C, The amounts of Aβ40 in 24-h-conditioned media from LRP1-KO and WT cells were measured by sandwich ELISA (n = 3, *p < 0.05). D, LRP1-KO and WT cells infected with recombinant adenoviruses expressing LacZ, WT APP, or rho-tagged BACE1 were maintained for 2 d, and cell lysates were analyzed by Western blotting as above. APP CTFs were analyzed by immunoprecipitation−Western blot analysis with anti-APP antibody, as described previously (Motoki et al., 2012). Images from the same blots were merged in the left panel. E−G, LRP1-KO and WT cells infected with recombinant adenoviruses expressing LacZ (E), BACE1 (F), or WT APP (G) were subjected to sucrose density gradient fractionation, as described in Materials and Methods. Each fraction was analyzed by Western blotting with antibodies against the rhodopsin tag (1D4), APP, BACE1, or flotillin-1. The level of BACE1 or APP in each fraction was quantified and expressed as a percentage of the total level in all fractions. For detection of APP CTFs in G, each fraction was additionally analyzed by immunoprecipitation−Western blot analysis with an anti-APP antibody, and the levels of α-CTF and β’-CTF in each fraction were quantified as above (n = 3).
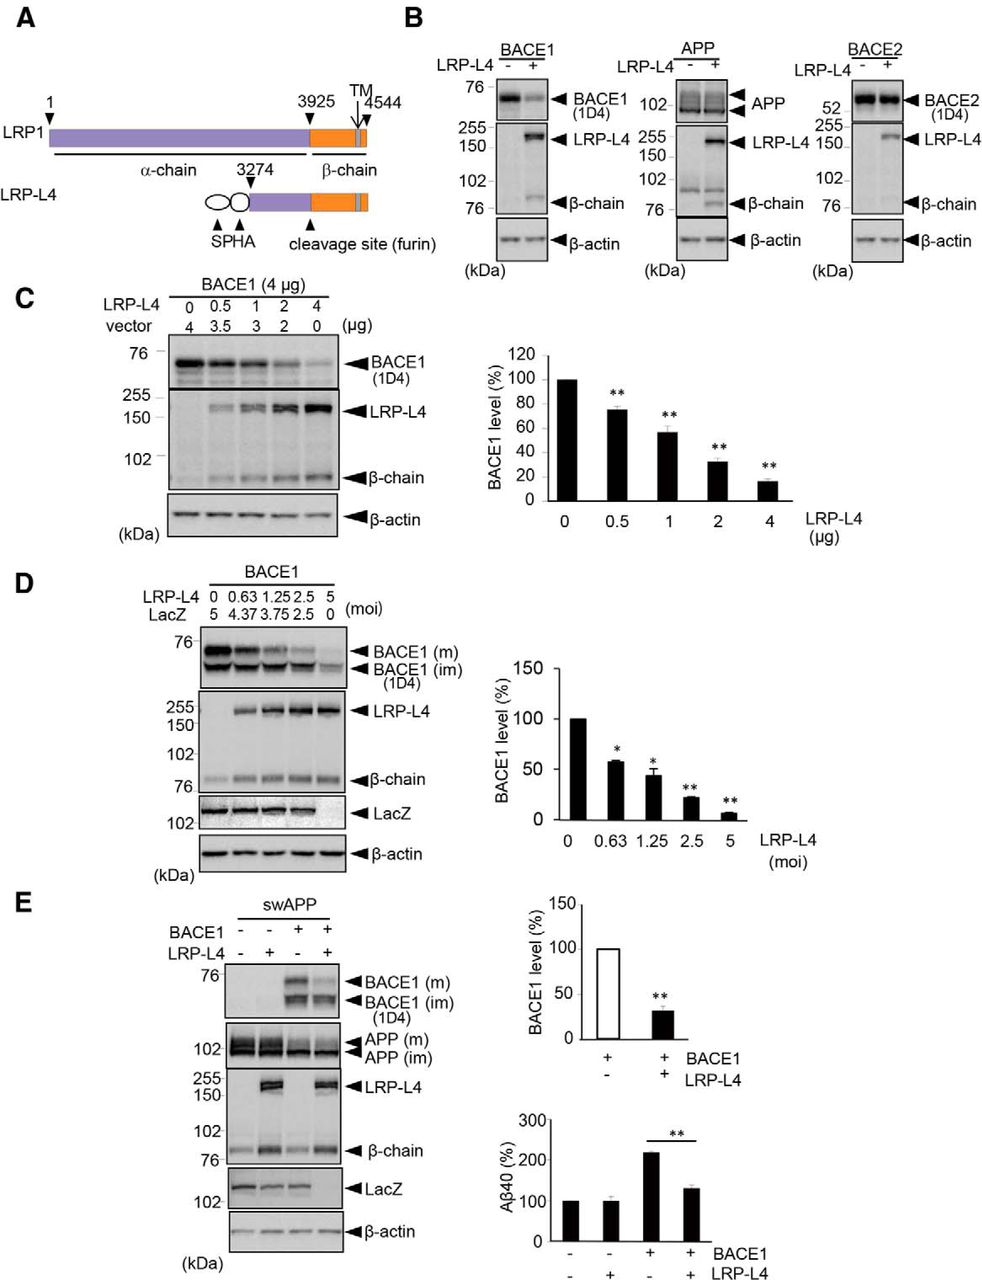
- Figure 2
LRP-L4 down-regulates BACE1 in HEK293 cells and primary neurons. A, LRP1 constructs. LRP-L4 is a functional LRP1 mini-receptor; an HA epitope was inserted into LRP-L4 after the signal peptide (SP) at the N-terminus. LRP1 is cleaved by furin to generate an N-terminal α-chain and a C-terminal β-chain. TM, Transmembrane domain. B, HEK293 cells were cotransfected with BACE1 and either LRP-L4 or empty vector. Similarly, cells were cotransfected with APP and LRP-L4 or BACE2 and LRP-L4. Cell lysates were analyzed by Western blotting with the indicated antibodies. C, HEK293 cells were cotransfected with BACE1 and the indicated amounts of LRP-L4 and/or empty vector. Cell lysates were analyzed by Western blotting with 1D4 or anti-LRP1 antibody. Relative BACE1 levels were quantified and graphed. D, Primary cultured neurons were infected with adenoviruses expressing BACE1 (5 moi) plus those expressing the indicated amounts of recombinant LRP-L4 and/or LacZ, and cell lysates were analyzed by Western blotting after 2 d. The graph indicates relative mature BACE1 levels. M, Mature; im, immature. E, Primary neurons were coinfected with the indicated adenoviruses expressing swAPP, BACE1, and/or LRP-L4 (3 moi each), and maintained for 2 d. The total amount of adenovirus infected was equalized by addition of LacZ adenovirus. Cell lysates were analyzed by Western (continued in page 6). blotting as above. The graph indicates relative mature BACE1 levels. Aβ40 levels in 24-h-conditioned media were determined with sandwich ELISA. C−E, n = 3; *p < 0.05, **p < 0.01.
- Figure 3
Physical association and colocalization of BACE1 and LRP-L4. A, HEK293 cells were transfected with LRP-L4 and either BACE1 or empty vector. Protein extracts of membrane fractions were immunoprecipitated with 1D4 antibody and the precipitated proteins were analyzed by Western blotting, as described in Materials and Methods. B, HEK293 cells transfected with BACE1 plus LRP-L4, BACE1 only, or LRP-L4 only were analyzed by double-immunofluorescence staining with 1D4 (green) and anti-HA (magenta) antibodies. Overlapping 1D4 and HA immunoreactive signals were observed in cells coexpressing BACE1 and LRP-L4. Scale bar, 10 μm. C, Primary neurons were infected with the indicated amounts of recombinant adenoviruses expressing BACE1, LRP-L4, and/or LacZ. Two days after infection, cell lysates were analyzed by Western blotting with 1D4, anti-LRP1, or anti-β-galactosidase. Comparable BACE1 levels were observed in neurons infected with BACE1 adenoviruses (2.5 moi) only and those infected with BACE1 (5 moi) and LRP-L4 (1.25 moi) adenoviruses. D, Primary neurons grown on coverslips were infected with BACE1 plus LacZ adenoviruses, BACE1 plus LRP-L4 adenoviruses, or LRP-L4 plus LacZ adenoviruses. Cells were analyzed as in B. Neurons coexpressing BACE1 and LRP-L4 exhibited overlapping 1D4 and HA immunoreactive signals in soma and (continued in page 8). neurites. Scale bar, 20 μm. E, Protein extracts of membrane fractions of primary neurons were immunoprecipiated with anti-BACE1 (MAB9311) or 1D4 (negative control), followed by immunoblotting with anti-LRP1. The blots were reprobed with anti-BACE1 antibodies (AB5832 and D10E5). Images from the same blots were merged in this figure. F, Primary neurons grown on coverslips were analyzed by double-immunofluorescence staining with anti-LRP1 and Alexa568-labeled anti-BACE1. BACE1 and LRP1 immunoreactivities were clearly overlapped in both soma and neurites of neurons. Scale bar, 20 μm.
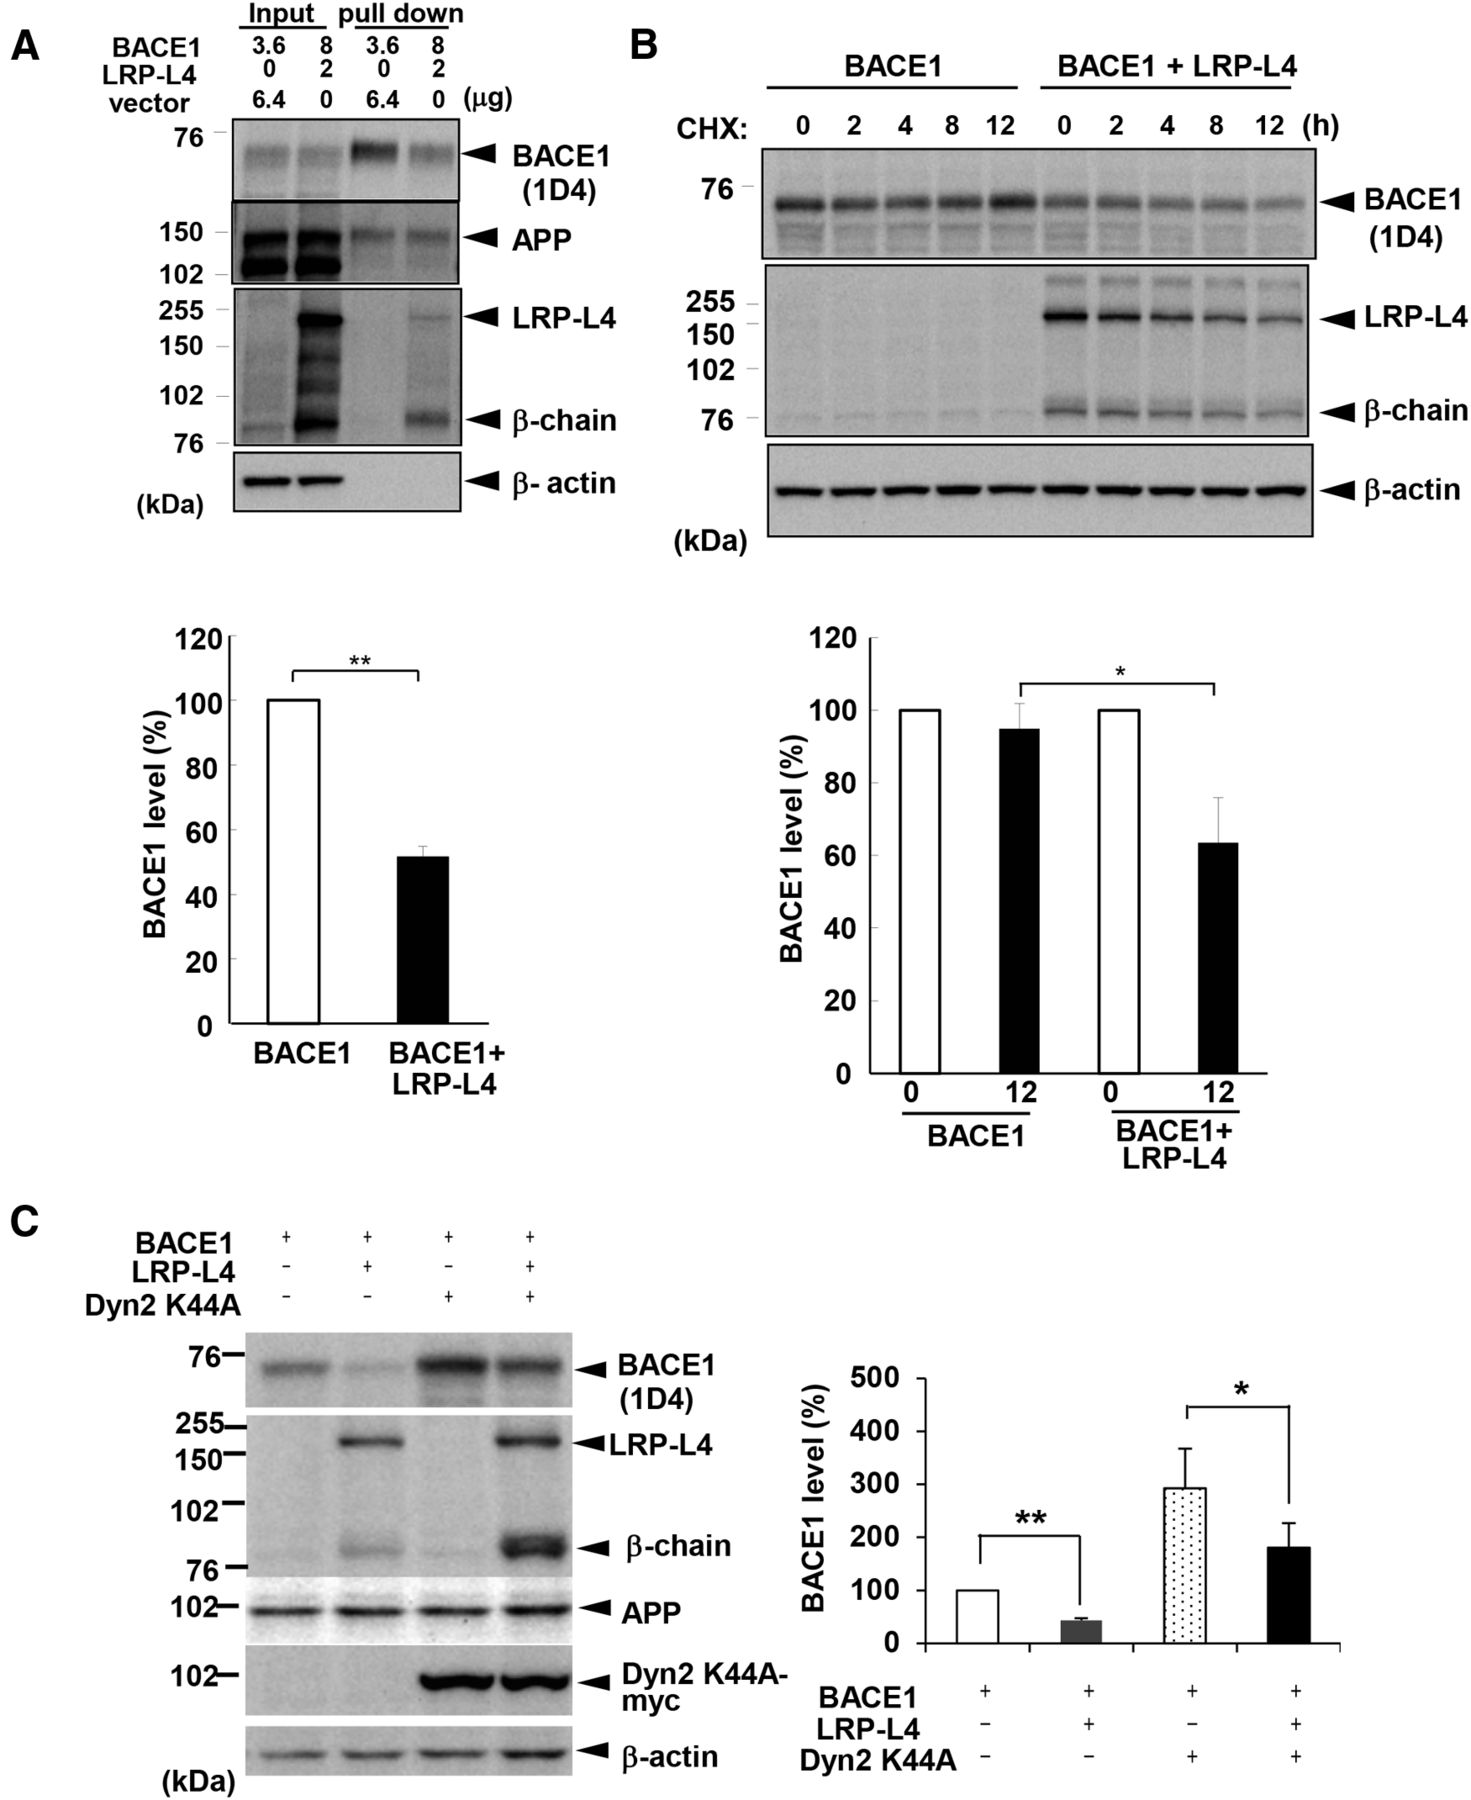
- Figure 4
LRP1 decreases BACE1 stability and reduces the cell surface expression of BACE1. A, HEK293 cells were transfected with the indicated amounts of BACE1 and either LRP-L4 or vector. Cell-surface biotinylation experiments were performed as described in Materials and Methods. Western blots of total cell lysates and avidin-agarose-precipitated material are shown. Relative BACE1 levels were quantified and graphed. B, HEK293 cells transfected with BACE1 plus LRP-L4 or vector as in A were subjected to cycloheximide chase experiments, as described in Materials and Methods. After incubation with cycloheximide (CHX) for the indicated times, cells were lysed and analyzed by Western blotting. Relative BACE1 levels at 0 and 12 h were quantified and graphed. (A, B: n = 3, *p < 0.05, **p < 0.01). C, HEK293 cells were cotransfected with BACE1, LRP-L4, and/or Dyn2 K44A as indicated. The total amount of DNA was equalized by the addition of vector. Cell lysates were analyzed by Western blotting with appropriate antibodies. Relative BACE1 levels in blots were quantified and graphed (n = 3, *p < 0.05, **p < 0.01).
- Figure 5
LRP1 induces a shift in the subcellular localization of BACE1 from early to late endosomes in both HEK293 and primary neurons, likely promoting lysosomal degradation. A, HEK293 cells transfected with BACE1 plus LRP-L4 (B+L) or BACE1 only (B only) were analyzed by triple-immunofluorescence staining with anti-EEA1/anti-rab7a (green), anti-HA (red), and 1D4 (blue) antibodies, or double-immunofluorescence staining with anti-EEA1/anti-rab7a (green) and 1D4 (red) antibodies. Note that colocalization of HA, 1D4, and EEA1/rab7a immunoreactive signals was observed in cells expressing BACE1 and LRP-L4, whereas colocalization of signals for 1D4 and EEA1, but not rab7a, was observed in cells expressing BACE1 only. Scale bars, 20 μm. B, HEK293 cells transfected with BACE1 plus LRP-L4 or BACE1 only were analyzed by triple-immunofluorescence staining with anti-β-COP/anti-γ1-adaptin (green), anti-HA (red), and 1D4 (blue) antibodies, or double-immunofluorescence staining with anti-β-COP/anti-γ1- (continued in page 11). adaptin (green) and 1D4 (red) antibodies, as in A. C, Primary neurons grown on coverslips were infected with BACE1 plus LRP-L4 adenoviruses or BACE1 plus LacZ adenoviruses. Cells were analyzed as in A, except that goat anti-EEA1 and rabbit anti-HA antibodies were used. Neurons coexpressing BACE1 and LRP-L4 exhibited overlapping 1D4, HA, and EEA1/rab7a immunoreactive signals in soma and neurites, whereas neurons expressing only BACE1 exhibiting overlapping signals of 1D4 and EEA1, but not rab7a. Scale bars, 20 μm. D, Primary neurons infected with BACE1 plus LRP-L4 adenoviruses or BACE1 plus LacZ adenoviruses were analyzed by triple- or double-immunofluorescence analysis performed with anti-β-COP/anti-γ1-adaptin, anti-HA, and 1D4 antibodies, as in B. Scale bars, 20 μm. E, HEK293 cells transfected with BACE1 plus LRP-L4 were subjected to cycloheximide (CHX) chase experiments, in which cells were coincubated with or without chloroquine (CQ; 50 μM). After 12 h, cells were lysed and analyzed by Western blotting. Relative levels of BACE1 and LRP-L4 were quantified and graphed (n = 3, *p < 0.05).
- Figure 6
Subcellular localization of endogenous BACE1 and LRP1 in neurons. A, Primary neurons grown on coverslips were analyzed by triple-immunofluorescence staining with anti-BACE1 (red), anti-LRP1 (blue), and anti-EEA1 (green), as described in Materials and Methods. Overlapping immunoreactivities were significantly observed in both soma and neurites of neurons. B, Triple-immunofluorescence staining with anti-BACE1, anti-LRP1, and anti-rab7 exhibited overlapping immunoreactivities mainly in soma of neurons. C, Triple-immunofluorescence staining with anti-BACE1, anti-LRP1, and anti-GM130 displayed only limited overlapping immunoreactivities in soma of neurons. Scale bars, 20 μm.
- Figure 7
Hypothetical model. In neurons, BACE1 is recycled through the TGN, the plasma membrane and early endosomes, maintaining relative stable BACE1 levels. LRP1 complexes with BACE1 and facilitates the transit of BACE1 from early to late endosomes, promoting lysosomal targeting and degradation of BACE1. BACE1-LRP1 complexes may be sorted directly from the TGN to early endosomes. LRP1 may possibly be recycled back from late endosomes to the plasma membrane, as in the case of RAP-LRP1 complexes (Laatsch et al., 2012).


In this issue


