

Article Figures & Data
- Figure 1
Schematic view of the setup and a representative nicotine-evoked Ca2+-response in the MBs of a control fly. A, Recording setup. The head capsule of a living fly is opened and the brain is bathed in Ringer’s solution, into which the agonist or antagonist is applied. B, Fluorescent image, taken with a Dim+Fluorescent light, of a 4-d-old female control fly (GFP-aequorin/CS; OK107/CS) after preparation and dissection. C, Fluorescent image of the MBs taken at the beginning of the experiment and used as the reference image. Light emission was quantified from the blue and red circles, which represent the CCB and the ML ROIs, respectively (scale bar, 50 μm). D, Bioluminescence image (accumulation time: 120 s) of the nicotine-evoked response in a typical control fly. E, Bioluminescent Ca2+-activity profile in MBs, evoked by nicotine (n = 15). Values are mean ± SEM. F, Six sequential bioluminescence images from t = −10 s to t = 50 s (accumulation time: 10 s) of the nicotine-evoked response. G, Decomposition image of the CCB showing that the first component corresponds to the response in the calyx (dendrites, ROI circled in green in H), while the second corresponds to that of the cell-bodies (ROI circled in orange in H). Because of the recording angle, the response in the calyx, unavoidably, partially overlaps with the response in the cell bodies. H, Accumulated (10 s) bioluminescence image of the nicotine-evoked response corresponding to each ROI, separately. Because it is not possible to perfectly separate the response from the two ROIs, we use a single ROI comprised of both of them: the CCB complex (ROI circled in blue). For the medial lobes (red circle in C), again here, since we privileged the overall view of the MBs, this approach did not permit us to separate the response of the various sublobes, such as β, β’, or γ.
- Figure 2
Modulation of nicotine-evoked transient Ca2+-response related to the cAMP pathway through rut. A−D, Bioluminescent Ca2+-activity profile in MBs evoked by nicotine with downregulated cAMP production in rut1 (n = 6), rut2080 (continued in page 7). (n = 7), rut-RNAi(1) (n = 8), and rut-RNAi(2) (n = 6). E−H, Bioluminescent Ca2+-activity evoked by nicotine with upregulated cAMP production in UAS-rut (n = 8), UAS-Gαs * (n = 7), flies incubated 10 min with forskolin (13 μM; n = 6), and flies incubated 10 min with 8Br-cAMP (200 μM; n = 7). I, J, Bioluminescent nicotine-evoked Ca2+-activity with different genetic background controls in Control-RNAi(1) (VDRC-60100: n = 17; I) and in Control-RNAi(2) (VDRC-60000: n = 15; J) as well as in Control-RNAi(2), incubated 10 min with ethanol 1/200 (n = 11; J). Values are mean ± SEM. K, Bioluminescent image (accumulation time: 120 s) of the nicotinic Ca2+-response of a typical fly for each genotype (except for the other controls presented in I and J). L, M, Total number of photons during the nicotine response in the CCB (L) and in the ML (M). N, O, Total duration of the response in the CCB (N) and in the medial lobe (O). Values are mean ± SEM. Statistics: A−D, One-way ANOVA was followed by a planned comparison of the predicted means to compare the levels of the selected effect using the Benjamini-Hochberg's test with rank transformation: *p < 0.05; **p < 0.01; ***p < 0.001 (for complete statistics, see Tables 1 and 2).
- Figure 3
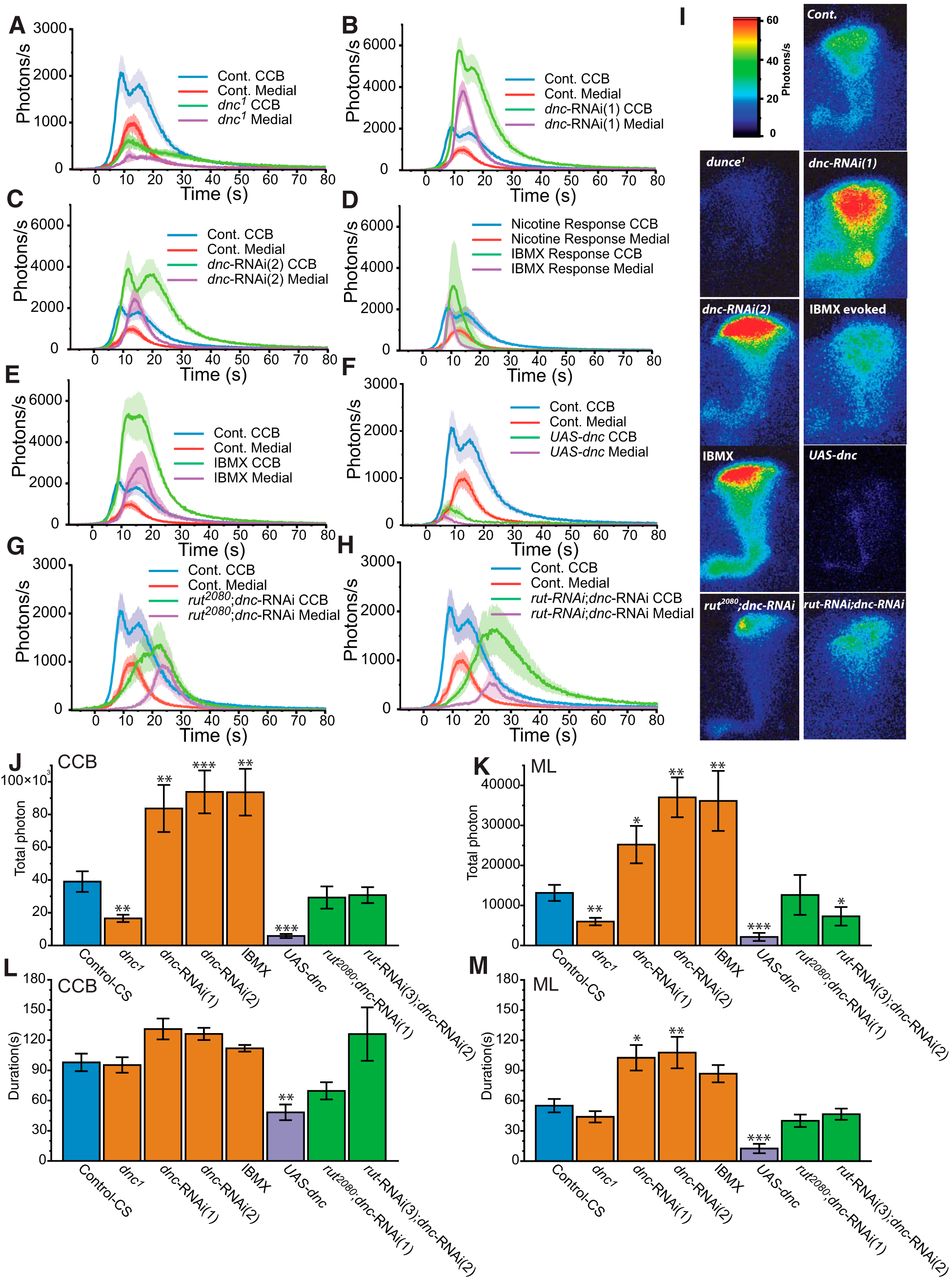
Modulation of nicotine-evoked transient Ca2+-response related to the cAMP pathway through dnc. A−E, Bioluminescent Ca2+-activity with downregulated degradation of cAMP through a perturbation of the dnc-PDE. A−C, dnc1 mutant flies (n = 14, A), dnc-RNAi(1) (n = 9, B), and dnc-RNAi(2) (n = 7, C). D, E, Flies incubated 25 min with IBMX (200 μM) followed (continued in page 11). by nicotine application (n = 6, D) and IBMX spontaneous Ca2+-response (n = 4, E). F, Bioluminescent Ca2+-activity with upregulated degradation of cAMP through an overexpression of dnc-PDE using UAS-dnc transgenic construct (n = 8). G, H, Bioluminescent nicotine-evoked Ca2+-activity with downregulated cAMP production, combined with downregulated cAMP degradation in rut2080 ;dnc-RNAi(1) (n = 7, G), and in rut-RNAi(2);dnc-RNAi(2) (n = 7, H). I, Bioluminescent image (accumulation time: 120 s) of the nicotinic Ca2+-response of a typical fly for each genotype. J, K, Total number of photons during the nicotine response in the CCB (J) and in the ML (K). L, M, Total duration of the response in the CCB (L) and in the medial lobe (M). Values are mean ± SEM. Statistics: same as for Figure 2.
- Figure 4
Modulation of the nicotine-evoked Ca2+-transient with CaM disturbance. A, B, Bioluminescent Ca2+-activity profile evoked by nicotine with a downregulated CaM expression in cam-RNAi(1) (n = 8) and cam-RNAi(2) (n = 8) flies. C, Bioluminescent Ca2+-activity profile evoked by nicotine with a downregulated CaM expression in cam-RNAi(2) and stimulated AC flies incubated 10 min with forskolin (13 μM) (n = 8). D, E, Bioluminescent Ca2+-activity profile evoked by nicotine with a downregulated CaM expression in cam-RNAi(2) and a blockade of the PDE with dnc-RNAi(1) flies (n = 8, D) or flies incubated 10 min with IBMX (200 μM, n = 8, E). F, Bioluminescence image (accumulation time: 120 s) of the nicotinic response in a representative fly for each genotype. G, H, Total number of photon during the nicotine response in the CCB (G) and in the ML (H). I, J, Total duration of the response in the CCB (I) and in the medial lobe (J). Values are means ± SEM. Statistics: same as for Figure 2.
- Figure 5
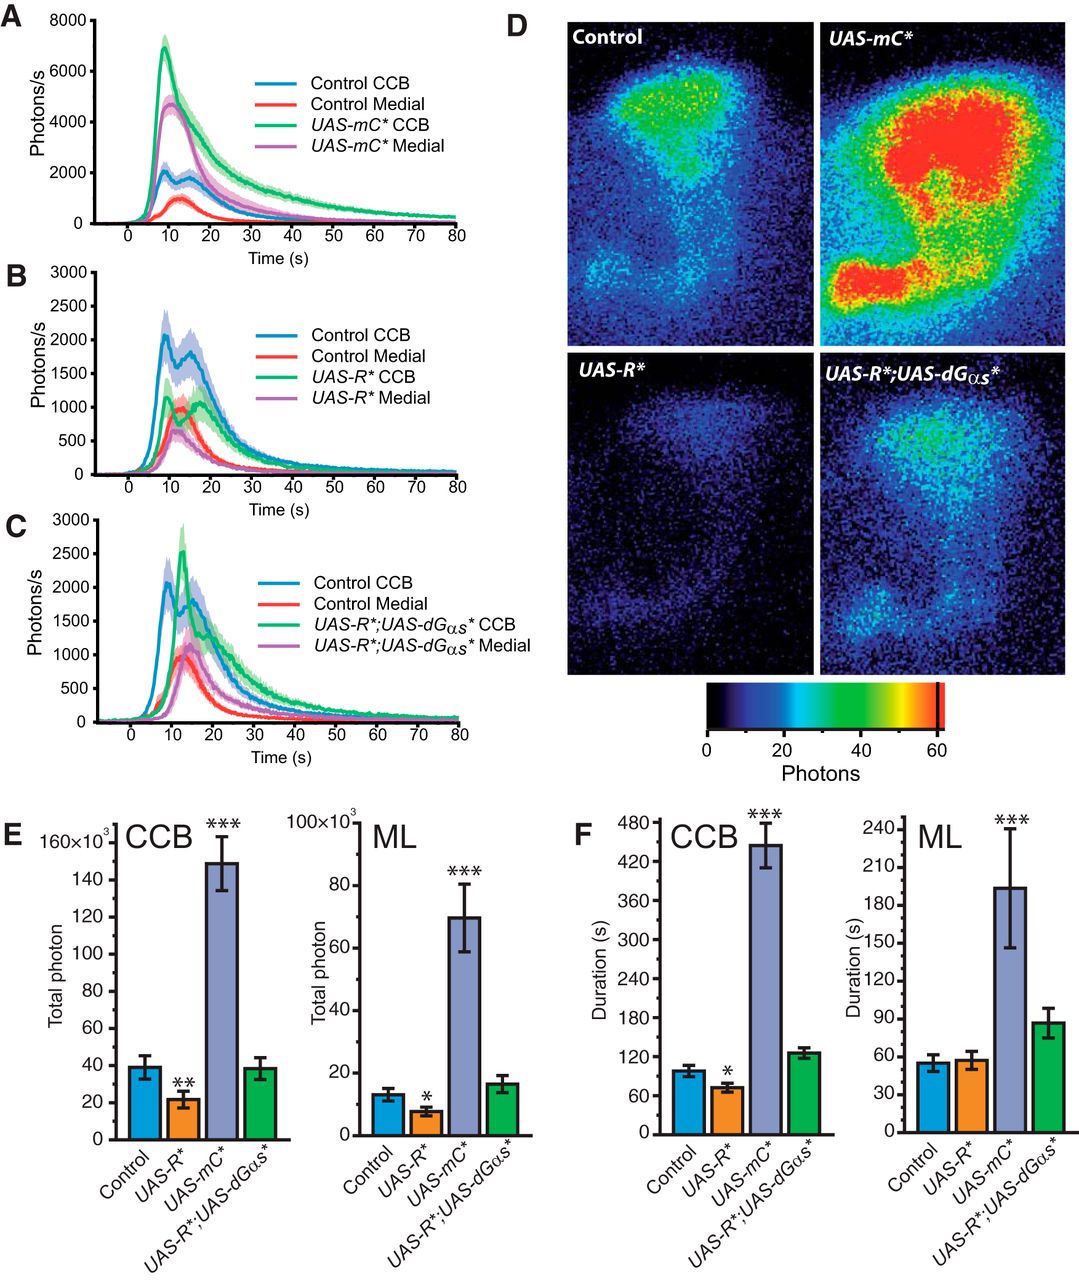
Modulation of the nicotine-evoked Ca2+-transient with PKA disruption. A−C, Bioluminescent Ca2+-activity evoked by nicotine with a constitutively activated PKA in mC* transgenic flies (n = 10, A), with downregulated PKA production in R* transgene flies (n = 8, B) and a high level of cAMP with PKA blocked in R* combined with a Gαs*(n = 9, C). D, Bioluminescent image (accumulation time: 120 s) of the nicotinic response in a typical fly of each genotype. E, Total number of photons during the nicotine response in the CCB and in the ML. F, Total duration of the response in the CCB and in the ML. Values are mean ± SEM. Statistics: same as in Figure 2.
- Figure 6
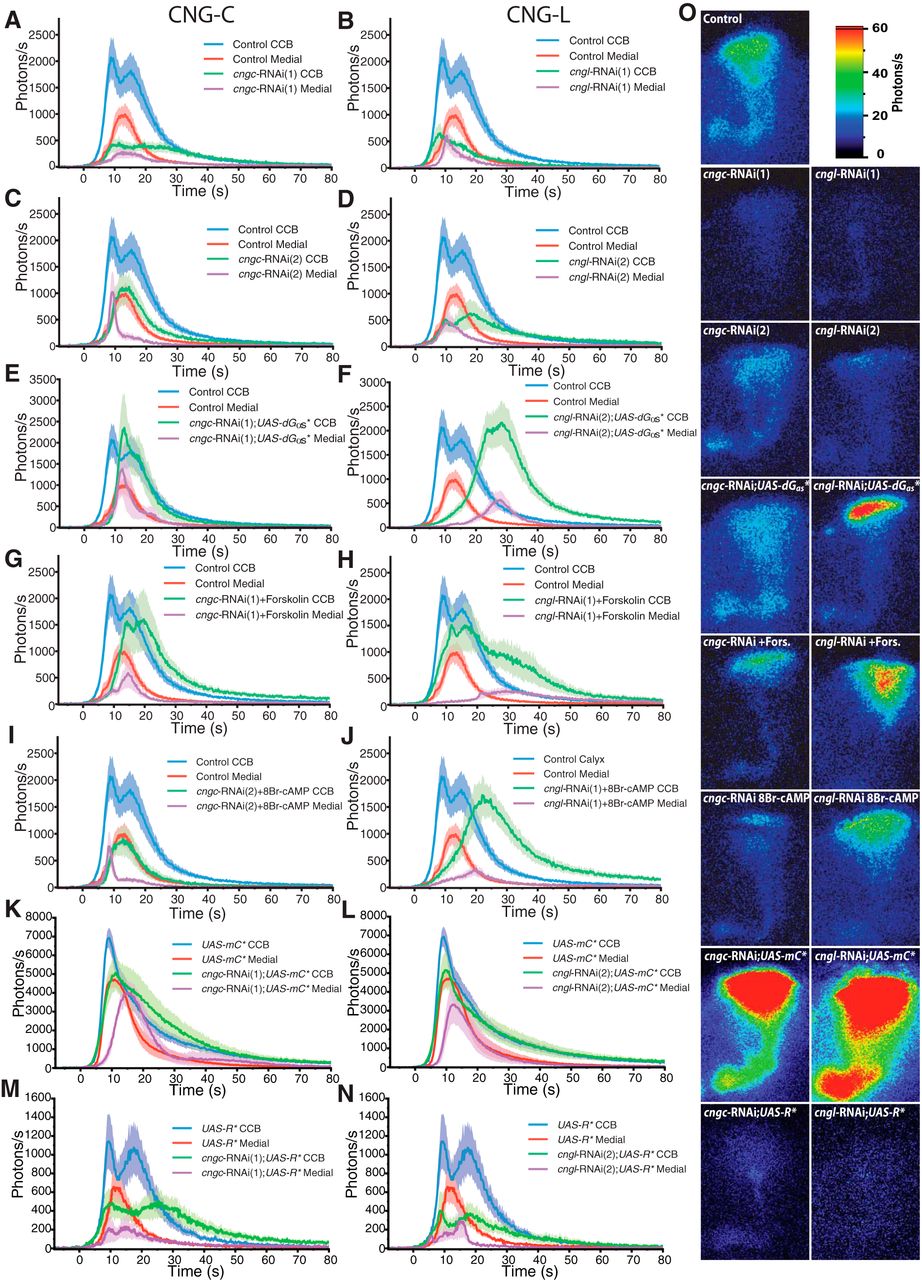
Modulation of nicotine-evoked Ca2+-transient with CNG disruption. A−D, Bioluminescent Ca2+-activity evoked by nicotine in CNGs knocked-down using the following: cngc-RNAi(1) (n = 11, A), cngc-RNAi(2) (n = 9, B), cngl-RNAi(1) (continued in page 16). (n = 6, C), and cngl-RNAi(2) (n = 7, D). E, G, I, Bioluminescent Ca2+-activity in CNGC knockdown with upregulated cAMP production in Gαs* (n = 5) transgenic flies (E), flies incubated for 10 min with forskolin (13 μM, n = 7, F), and flies incubated for 10 min with 8Br-cAMP (200 μM, n = 7, I). F, H, J, Bioluminescent Ca2+-activity in CNGL knockdown with upregulated cAMP production in Gαs* (n = 11) transgenic flies (F), flies incubated for 10 min with forskolin (13 μM, n = 8, H), and flies incubated for 10 min with 8-Br-cAMP (200 μM, n = 8, J). K, M, Bioluminescent Ca2+-activity in CNGC knockdown with upregulated PKA activity in UAS-mC* (n = 8, K) and downregulated PKA activity in UAS-R* (n = 9, M). L, N, Bioluminescent Ca2+-activity in CNGL knockdown with upregulated PKA activity in UAS-mC* (n = 9, L) and downregulated PKA activity in UAS-R* (n = 9, N). O, Bioluminescent image (accumulation time: 120 s) of the nicotine-evoked response in a typical fly of each genotype.
- Figure 7
Quantification of the modulation of the nicotine-evoked Ca2+-transient with CNGs disruption A, B, Total number of photons during the nicotine response in the CCB (A) and in the ML (B). C, D, Total duration of the response in the CCB (C) and in the ML (D). Values are mean ± SEM. Statistics: The tables located under the histograms represent the comparison between different conditions (one modification vs two modifications). The first line is the comparison with the control group. The second line (labeled CNGs) compares groups exposed to two modifications (RNAi + transgenes or RNAi + pharmacology) with results obtained for its single-channel RNAi counterpart (either cngc-RNAi or cngl-RNAi). The third line (labeled cAMP/PKA) compares the groups exposed to two modifications with their respective single modification affecting either cAMP or the PKA. Statistical tests are the same as for Figure 2.
- Figure 8
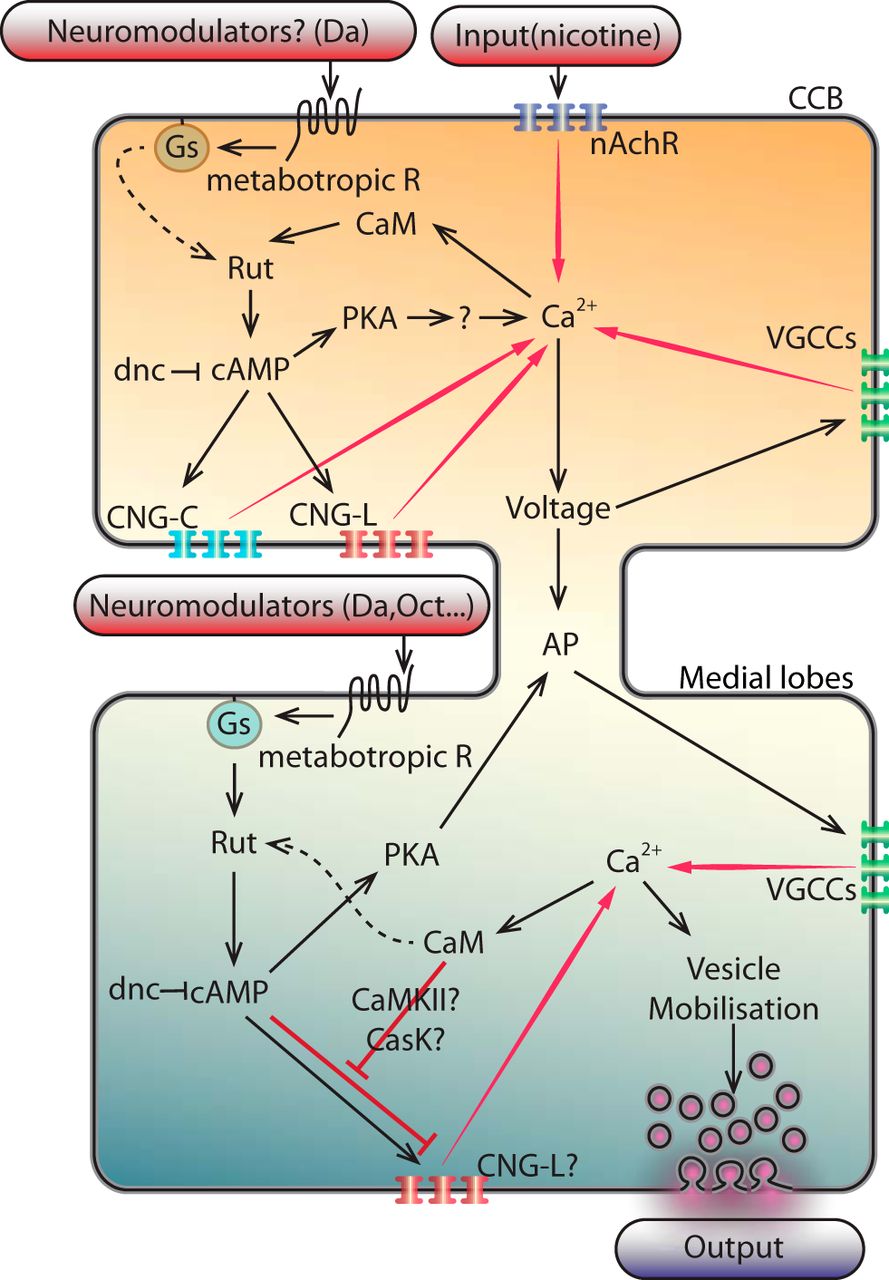
Schematic integrative model of interactions of the different partners involved in the Ca2+-response modulation in the CCB and the medial lobe. In the CCB: the conditional stimulus (e.g., an olfactory stimulus) triggers nicotinic inputs, which activate the nAchR located on the KCs of the MBs, allowing the Ca2+-entry. Calcium binds to CaM and subsequently activates the production of cAMP by RUT. In agreement with the coincidence detector model, in certain conditions, e.g., when the conditional stimulus is simultaneously applied with an unconditional stimulus (e.g., a nociceptive electric shock), the dopaminergic receptors could costimulate the rut-AC to increase further the cAMP level through Gαs. The resulting increase in cAMP stimulates the PKA as well as the CNGs (CNGC and CNGL), which both participate in amplifying the Ca2+-entry. At the same time, the PKA allows the Ca2+-entry and/or the persistence of the Ca2+-entry, likely by affecting the repolarisation of the cells, possibly through the K+-channels. In parallel and simultaneously, the Ca2+-entry modifies the voltage of the cells that allows the voltage-gated calcium channels (VGCC) to also participate to the Ca2+-entry. Altogether, these activities trigger actions potentials (APs) that propagate to the lobes. In the medial lobes: at the axon terminals, the APs open the VGCC, allowing Ca2+-entry. This Ca2+ stimulates the CaM. In parallel or simultaneously (as for instance in certain environmental conditions), a neuromodulator (e.g., dopamine, octopamine) activates a metabotropic receptor, which stimulates a G-protein, and then stimulates the RUT to increase the cAMP. Then, the cAMP stimulates the CNGs (and more likely the CNGL; as suggested by our results in Fig. 6F,H,J). Moreover, according to our results (knocking-down the CaM and handling the cAMP level; Fig. 4), we hypothesize that the CaM might act as an inhibitor of the cAMP-stimulation of the CNGL (red line). This could be achieved either through the CaMKII or CASK, since both of them have been implicated in learning and memory, or directly by the CaM on the CNGL (since in some organisms, certain CNGs have been reported to be sensitive to CaM; Kaupp and Seifert, 2002). These successive events lead to the fine tuning of the Ca2+-level that mobilize the synaptic vesicles and the output. This hypothetical concomitant inhibition by the CaM and the cAMP on the CNGL could represent a coincidence detector.


- Table 1
Statistical significance of all different tested conditions (histograms of Figs. 2, 3, 4, 5, 7)
Total Photon Duration Comparison back to control N CCB Medial CCB Medial Control-CS 15 NA NA NA NA Control-RNAi(1) 17 NA NA NA NA Control-RNAi(2) 15 NA NA NA NA Control ethanol 11 NA NA NA NA rut1 6 0.001 0.002 0.020 0.085 rut2080 7 0.025 0.097 0.225 0.490 rut-RNAi(1) 7 0.025 0.268 0.391 0.209 rut-RNAi(2) 6 0.017 0.005 0.524 0.047 UAS-rut 8 0.023 0.745 0.524 0.254 UAS-dGαs* 7 0.015 0.025 0.029 0.006 Forskolin 6 0.015 0.025 0.225 0.008 8Br-cAMP 7 0.025 0.010 0.481 0.146 dnc1 14 0.002 0.002 0.974 0.316 dnc-RNAi(1) 7 0.005 0.029 0.065 0.010 dnc-RNAi(2) 9 < 0.001 0.001 0.065 0.008 IBMX 6 < 0.001 < 0.001 0.002 < 0.001 UAS-dnc 8 0.001 0.006 0.351 0.065 rut2080;dnc-RNAi(1) 7 0.333 0.242 0.091 0.316 rut-RNAi(3);dnc-RNAi(2) 7 0.702 0.025 0.439 0.739 UAS-mC* 10 < 0.001 < 0.001 < 0.001 < 0.001 UAS-R* 8 0.003 0.025 0.017 0.931 UAS-dGαs*;UAS-R* 9 0.778 0.242 0.078 0.056 CaM-RNAi(1) 8 0.010 0.404 0.066 0.535 CaM-RNAi(2) 8 0.039 0.322 0.481 0.264 CaM-RNAi(2) Forskolin 8 0.288 0.495 0.007 0.254 CaM-RNAi(2);dnc-RNAi(1) 8 0.014 < 0.001 0.013 0.004 CaM-RNAi(2) IBMX 8 0.039 < 0.001 0.346 0.009 cngc-RNAi(1) 11 0.001 0.002 0.481 0.870 cngc-RNAi(2) 9 0.015 0.007 0.499 0.004 cngc-RNAi(1);UAS-dGαs* 5 0.050 0.527 0.029 0.458 cngc-RNAi(1) Foskolin 7 0.911 0.045 0.524 0.725 cngc-RNAi(2) 8Br-cAMP 7 < 0.001 < 0.001 0.007 0.008 cngc-RNAi(1);UAS-mC* 8 < 0.001 < 0.001 < 0.001 < 0.001 cngc-RNAi(1);UAS-R* 9 0.025 0.007 0.091 0.338 cngl-RNAi(1) 6 < 0.001 0.003 0.002 0.008 cngl-RNAi(2) 7 < 0.001 0.001 0.346 0.243 cngl-RNAi(2);UAS-dGαs* 11 0.138 0.072 0.070 0.874 cngl-RNAi(1) Foskolin 8 0.444 0.299 0.065 0.163 cngl-RNAi(1) 8Br-cAMP 8 0.130 0.033 < 0.001 0.088 cngl-RNAi(2);UAS-mC* 9 < 0.001 < 0.001 < 0.001 < 0.001 cngl-RNAi(2);UAS-R* 9 < 0.001 < 0.001 0.016 < 0.001 - Table 2:
Statistical significance of all different tested conditions (histograms of Figs. 2, 3, 4, 5, 7)
Total Photon Duration Comparison between CCB Medial CCB Medial cngc-RNAi(1);UAS-dGαs* cngc-RNAi(1) 0.966 0.215 0.138 0.108 cngc-RNAi(1) Foskoline cngc-RNAi(1) 0.041 0.736 0.296 0.003 cngc-RNAi(2) 8Br-cAMP cngc-RNAi(2) 0.256 0.393 0.058 0.942 cngc-RNAi(1);UAS-mC* cngc-RNAi(1) < 0.001 < 0.001 < 0.001 < 0.001 cngc-RNAi(1);UAS-R* cngc-RNAi(1) 0.898 0.992 0.389 0.060 cngc-RNAi(1);UAS-dGαs* UAS-Gαs* < 0.001 0.030 < 0.001 0.004 cngc-RNAi(1) Foskolin Forskolin 0.048 < 0.001 0.571 0.043 cngc-RNAi(2) 8Br-cAMP 8Br-AMPc < 0.001 < 0.001 0.004 < 0.001 cngc-RNAi(1);UAS-mC* UAS-mC* 0.999 0.649 0.842 0.449 cngc-RNAi(1);UAS-R* UAS-R* 0.565 0.780 0.493 0.477 cngl-RNAi(2);UAS-dGαs* cngl-RNAi(2) < 0.001 0.191 < 0.001 0.005 cngl-RNAi(1) Foskolin cngl-RNAi(1) < 0.001 0.093 < 0.001 < 0.001 cngl-RNAi(1) 8Br-cAMP cngl-RNAi(1) < 0.001 0.394 < 0.001 < 0.001 cngl-RNAi(2);UAS-mC* cngl-RNAi(2) < 0.001 < 0.001 < 0.001 < 0.001 cngl-RNAi(2);UAS-R* cngl-RNAi(2) 0.875 0.287 0.357 0.600 cngl-RNAi(2);UAS-dGαs* UAS-Gαs* 0.317 < 0.001 0.556 0.009 cngl-RNAi(1) Foskolin Forskolin 0.134 0.005 0.748 0.256 cngl-RNAi(1) 8Br-cAMP 8Br-AMPc 0.568 < 0.001 0.015 0.909 cngl-RNAi(2);UAS-mC* UAS-mC* 0.751 0.945 0.971 0.146 cngl-RNAi(2);UAS-R* UAS-R* 0.395 0.033 0.957 0.002 UAS-Gas*;UAS-R* UAS-Gαs* 0.057 0.359 0.597 0.396 UAS-Gas*;UAS-R* UAS-R* 0.004 0.003 < 0.001 0.080
- Movie 1
In vivo bioluminescence imaging of Ca2+-responses in the KCs of the MBs induced by nicotine application. On the left, we observe a wild-type control-Canton-S fly; the right corresponds to the so-called spontaneous activity induced by the IBMX application. Each frame represents 1 s of light accumulation and is shifted by 250 ms, seen at 25 frames/s. The light emission is coded in pseudocolors (2-6 photons/pixel) (MP4 = 2.89 Mb).
- Movie 2
In vivo bioluminescence imaging of Ca2+-responses in the KCs induced by nicotine application on a fly expressing the UAS-mC*. Left, Control-CS (same fly as in Movie 1). Right, A fly expressing the UAS-mC*, a constitutively activated PKA. We remark that the level and the duration of activity is importantly increased in mC* fly. However, for the sake of the visualization of the movie, notice that the duration of this movie does not exactly correspond to the calculated duration reported in Figure 5F, because the accumulation time of the signal is settled and displayed differently. Each frame represents 1 s of light accumulation and is shifted by 250 ms, seen at 25 frames/s. The light emission is coded in pseudocolors (2-6 photons/pixel) (MP4 = 2.89 Mb).
- Movie 3
In vivo bioluminescence imaging of Ca2+-responses in the KCs induced by nicotine application on a fly expressing the cngc-RNAi(1). Left, Control-CS fly. Right, A fly expressing the cngc-RNAi(1). We remark that the level and the duration of activity are importantly reduced in this fly. Each frame represents 1 s of light accumulation and is shifted by 250 ms, seen at 25 frames/s. The light emission is coded in pseudocolors (2-6 photons/pixel) (MP4 = 2.89 Mb).
In this issue


