
Main menu

  • HOME
  • CONTENT
    • Early Release
    • Featured
    • Current Issue
    • Issue Archive
    • Blog
    • Collections
    • Podcast
  • TOPICS
    • Cognition and Behavior
    • Development
    • Disorders of the Nervous System
    • History, Teaching and Public Awareness
    • Integrative Systems
    • Neuronal Excitability
    • Novel Tools and Methods
    • Sensory and Motor Systems
  • ALERTS
  • FOR AUTHORS
  • ABOUT
    • Overview
    • Editorial Board
    • For the Media
    • Privacy Policy
    • Contact Us
    • Feedback
  • SUBMIT

User menu

Search

  • Advanced search
eNeuro
eNeuro

Advanced Search


  • HOME
  • CONTENT
    • Early Release
    • Featured
    • Current Issue
    • Issue Archive
    • Blog
    • Collections
    • Podcast
  • TOPICS
    • Cognition and Behavior
    • Development
    • Disorders of the Nervous System
    • History, Teaching and Public Awareness
    • Integrative Systems
    • Neuronal Excitability
    • Novel Tools and Methods
    • Sensory and Motor Systems
  • ALERTS
  • FOR AUTHORS
  • ABOUT
    • Overview
    • Editorial Board
    • For the Media
    • Privacy Policy
    • Contact Us
    • Feedback
  • SUBMIT
PreviousNext
Research ArticleNew Research, Sensory and Motor Systems

Quantitative Reevaluation of the Effects of Short- and Long-Term Removal of Descending Modulatory Inputs on the Pyloric Rhythm of the Crab, Cancer borealis

Albert W. Hamood, Sara A. Haddad, Adriane G. Otopalik, Philipp Rosenbaum and Eve Marder
eNeuro 14 January 2015, 2 (1) ENEURO.0058-14.2015; https://doi.org/10.1523/ENEURO.0058-14.2015
Albert W. Hamood
Volen Center and Biology Department, Brandeis University, Waltham, Massachusetts 02545
  • Find this author on Google Scholar
  • Find this author on PubMed
  • Search for this author on this site
Sara A. Haddad
Volen Center and Biology Department, Brandeis University, Waltham, Massachusetts 02545
  • Find this author on Google Scholar
  • Find this author on PubMed
  • Search for this author on this site
Adriane G. Otopalik
Volen Center and Biology Department, Brandeis University, Waltham, Massachusetts 02545
  • Find this author on Google Scholar
  • Find this author on PubMed
  • Search for this author on this site
Philipp Rosenbaum
Volen Center and Biology Department, Brandeis University, Waltham, Massachusetts 02545
  • Find this author on Google Scholar
  • Find this author on PubMed
  • Search for this author on this site
Eve Marder
Volen Center and Biology Department, Brandeis University, Waltham, Massachusetts 02545
  • Find this author on Google Scholar
  • Find this author on PubMed
  • Search for this author on this site
  • ORCID record for Eve Marder
  • Article
  • Figures & Data
  • Info & Metrics
  • eLetters
  • PDF
Loading

Article Figures & Data

Figures

  • Tables
  • Figure 1
    • Download figure
    • Open in new tab
    • Download powerpoint
    Figure 1

    Acute effects of decentralization on the pyloric rhythm. A, Schematic diagram of the dissected STNS, as pinned out for recording, showing the location of the STG and its associated anterior modulatory ganglia (CoG, OG). Grey circles identify where Vaseline wells were built for monitoring pyloric activity extracellularly. Decentralization was accomplished by blocking or transecting the stn at the indicated location. B, Example lvn recordings from a preparation before (blue trace) and 30 min following decentralization (red trace). C, D, Histograms of pyloric cycle frequencies immediately before decentralization (C, blue bars) and 30 min after (D, red bars). E, F, Phase relationships among the PD and LP cells in the pyloric rhythm for intact (E, blue) and 30 min decentralized (F, red) preparations. Lines represent fits by linear regression.

  • Figure 2
    • Download figure
    • Open in new tab
    • Download powerpoint
    Figure 2

    Long-term, continuous extracellular recordings of preparations of the STNS reveal stable behavior. Example 15 s lvn traces from two preparations, one in which with the stn left intact throughout the experiment (blue traces, left), and one in which the stn was transected shortly after the baseline recording (red traces, right).

  • Figure 3
    • Download figure
    • Open in new tab
    • Download powerpoint
    Figure 3

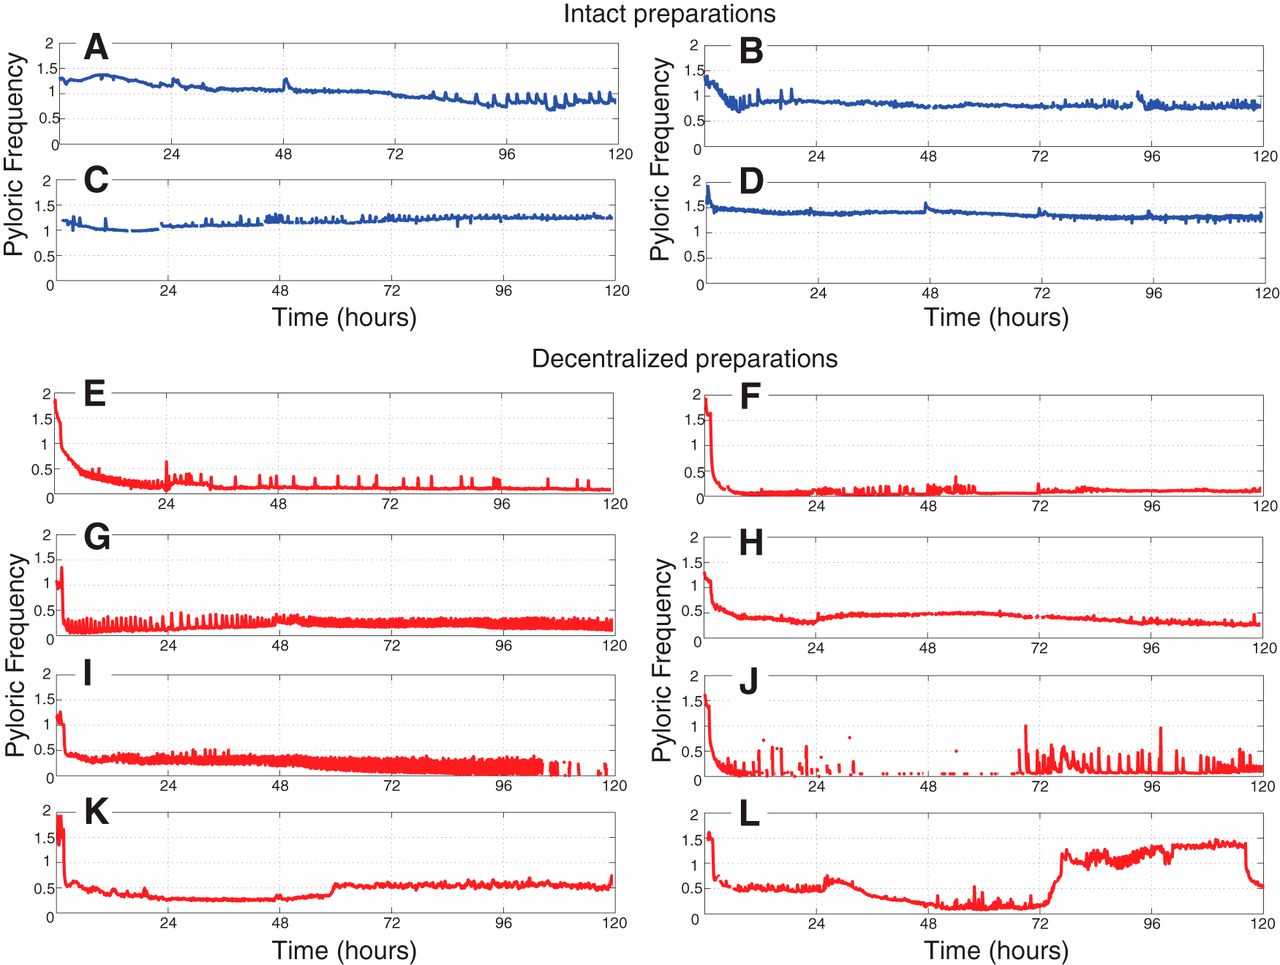
    Example long-term pyloric cycle frequency plots of intact (A−D) and decentralized (E−L) preparations of the STNS. Data are plotted after binning frequencies into 0.1 h bins. Intact preparations (blue) tend to maintain stable pyloric rhythms with frequencies in the normal range of controls. Decentralized preparations (red) display more varied and variable behavior. Decentralization was accomplished approximately 1 h following the beginning of these recordings.

  • Figure 4
    • Download figure
    • Open in new tab
    • Download powerpoint
    Figure 4

    Long-term population effects of decentralization on the pyloric rhythm. A, Population data for intact (n = 9) and decentralized (n = 19) preparations is shown for the first 6 d in culture. Data are plotted as box plots (see Materials and Methods) for each hour; data from intact preparations are shown in blue while decentralized preparations are shown in red. B−E, Cycle frequency correlations within preparations across time (dc, decentralized). Black diagonal line represents unity. Insets report R and p values of Pearson correlations. B, Following decentralization, all preparations exhibit a lower pyloric cycle frequency. C, All examined preparations also exhibit a lower frequency on the second day following decentralization (average frequency, 24−48 h). D, E, On subsequent days, preparations are more correlated, and show an equal tendency to increase or decrease frequency. F−K, Measures of frequency (F), across-preparation variability (coefficient of variation (C.V.), G), within-preparation variability (H), and pyloric phase relationships (I−K) are plotted for intact (blue) and decentralized (red) preparations. Box plots are created from population data consisting of the average value for each preparation in 24 h bins following decentralization.

  • Figure 5
    • Download figure
    • Open in new tab
    • Download powerpoint
    Figure 5

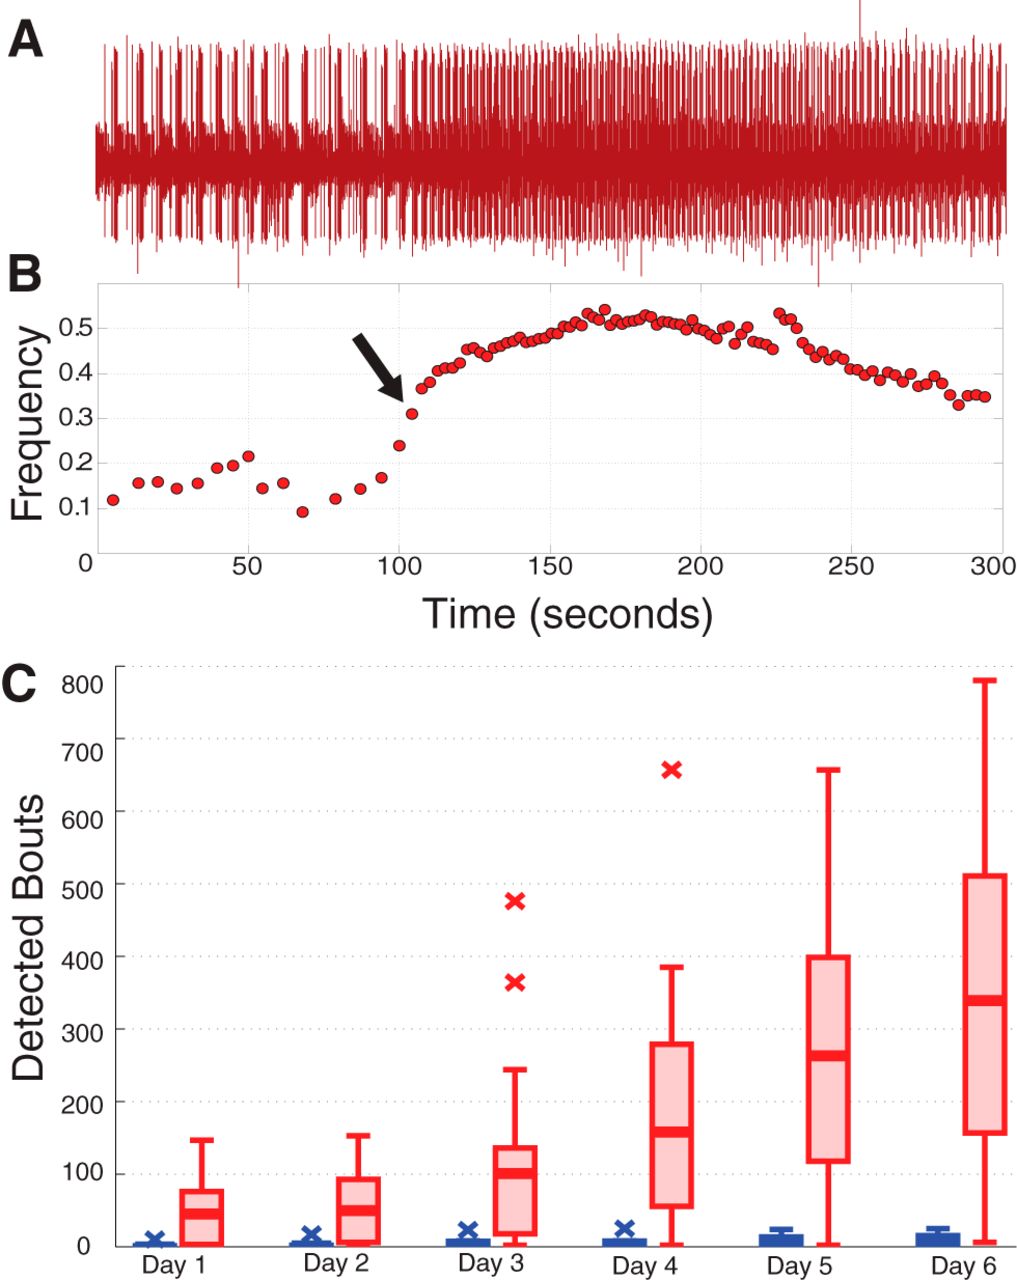
    Analysis of bouting. A, Example lvn recording featuring one detected bout, visible here in the noticeable increase in pyloric cycle frequency starting mid-trace. B, Frequency plot corresponding to the data in A. Arrow designates the point at which the bout was detected. C, Box plots show population data of the number of detected bouts by day for intact (blue) and decentralized (red) preparations.

  • Figure 6
    • Download figure
    • Open in new tab
    • Download powerpoint
    Figure 6

    Analysis of previously used measures of recovery. A. Two previously described definitions of recovery (time to first bout, and 5 h strong and steady rhythm) fail to correlate. B−F, Box plots show population data of intact (blue), 30 min decentralized (dc; red), and the fastest 5 h post-decentralization period of data from each decentralized preparation within the first 120 h. n.s., not significant; ***p < 0.001.

  • Figure 7
    • Download figure
    • Open in new tab
    • Download powerpoint
    Figure 7

    Daily saline exchanges transiently activate the pyloric rhythm. A, Example pyloric cycle frequency plot for an 8 h stretch surrounding a saline exchange that transiently activates the pyloric rhythm (done at arrow). B, Raw data from the same preparation reveals an increased frequency lasting several hours. C, Population data showing the average effect of exchanging saline in 10 long-term decentralized preparations. Left-most box shows time-matched data from continuously superfused preparations. ***p < 0.001.

Tables

  • Figures
    • View popup
    Table 1

    Pearson correlations

    DatanRp value
    Intact, Hz vs PD off1230.41131.19E-05
    Intact, Hz vs LP on1230.05550.5759
    Intact, Hz vs LP off1230.34223.77E-04
    Decentralized, Hz vs PD off1150.8229<1E-06
    Decentralized, Hz vs LP on1150.8298<1E-06
    Decentralized, Hz vs LP off1150.8295<1E-06
    Intact, Hz vs 30 min decentralized Hz1150.40776.1049E-06
    30 min decentralized Hz vs 2 d decentralized Hz190.52340.0258
    2 d decentralized Hz vs 3 d decentralized Hz190.60467.90E-03
    3 d decentralized Hz vs 4 d decentralized Hz190.42490.0788
    5 h recovery time vs time to first bout190.1510.537
    • View popup
    Table 2

    t tests

    Datantp value
    Paired t tests
    Intact Pyloric Hz vs 30 min decentralized Hz11540.768<1E-06
    Hz, pre- vs post-saline exchanges (avg)10−5.28975.01E-04
    Unpaired t tests
    Time-matched vs saline-exchange pre13 matched; 10 exchanged−2.46620.028
    Time-matched vs saline-exchange post13 matched; 10 exchanged−5.28975.01E-04
    • View popup
    Table 3

    Mixed-model ANOVAs

    DatanBetween-subjects FBetween-subjects pWithin-subjects FWithin-subjects pInteraction FInteraction p
    Pyloric Hz19; 9108.12<1E-061.6320.15781.7750.1234
    Cycle variation19; 95.1340.03470.4260.829750.3650.87119
    PD off19; 924.9446.07E-050.2540.937190.7030.6226
    LP on19; 95.3820.04890.6870.636160.7020.625
    LP off19; 99.2340.0162.1750.0760.550.7376
    Bouts19; 99.4176.06E-037.3376.8E-066.3933.42E-06
    • View popup
    Table 4:

    Mood's median tests

    Datanχ2p value
    Fastest 5 h decentralized vs intact Pyloric Hz19 5-h decentralized stretches; 123 intact17.562.78E-05
    Fastest 5 h decentralized vs intact cycle variation19 5-h decentralized stretches; 123 intact21.9352.82E-06
    Fastest 5 h decentralized vs intact PD off19 5-h decentralized stretches; 123 intact17.61872.70E-05
    Fastest 5 h decentralized vs intact LP on19 5-h decentralized stretches; 123 intact8.10444.40E-03
    Fastest 5 h decentralized vs intact LP off19 5-h decentralized stretches; 123 intact11.67036.35E-04
    Fastest 5 h decentralized vs 30 min decentralized Hz19 5-h decentralized stretches; 115 30-min decentralized1.53320.2156
    Fastest 5 h decentralized vs 30 min decentralized cycle variation19 5-h decentralized stretches; 115 30-min decentralized5.19890.0226
    Fastest 5 h decentralized vs 30 min decentralized PD off19 5-h decentralized stretches; 115 30-min decentralized1.55850.2119
    Fastest 5 h decentralized vs 30 min decentralized LP on19 5-h decentralized stretches; 115 30-min decentralized1.3480.2456
    Fastest 5 h decentralized vs 30 min decentralized LP off19 5-h decentralized stretches; 115 30-min decentralized1.3480.2456
Back to top

In this issue

eneuro: 2 (1)
eNeuro
Vol. 2, Issue 1
January/February 2015
  • Table of Contents
  • Index by author
Email

Thank you for sharing this eNeuro article.

NOTE: We request your email address only to inform the recipient that it was you who recommended this article, and that it is not junk mail. We do not retain these email addresses.

Enter multiple addresses on separate lines or separate them with commas.
Quantitative Reevaluation of the Effects of Short- and Long-Term Removal of Descending Modulatory Inputs on the Pyloric Rhythm of the Crab, Cancer borealis
(Your Name) has forwarded a page to you from eNeuro
(Your Name) thought you would be interested in this article in eNeuro.
CAPTCHA
This question is for testing whether or not you are a human visitor and to prevent automated spam submissions.
Print
View Full Page PDF
Citation Tools
Quantitative Reevaluation of the Effects of Short- and Long-Term Removal of Descending Modulatory Inputs on the Pyloric Rhythm of the Crab, Cancer borealis
Albert W. Hamood, Sara A. Haddad, Adriane G. Otopalik, Philipp Rosenbaum, Eve Marder
eNeuro 14 January 2015, 2 (1) ENEURO.0058-14.2015; DOI: 10.1523/ENEURO.0058-14.2015

Citation Manager Formats

  • BibTeX
  • Bookends
  • EasyBib
  • EndNote (tagged)
  • EndNote 8 (xml)
  • Medlars
  • Mendeley
  • Papers
  • RefWorks Tagged
  • Ref Manager
  • RIS
  • Zotero
Respond to this article
Share
Quantitative Reevaluation of the Effects of Short- and Long-Term Removal of Descending Modulatory Inputs on the Pyloric Rhythm of the Crab, Cancer borealis
Albert W. Hamood, Sara A. Haddad, Adriane G. Otopalik, Philipp Rosenbaum, Eve Marder
eNeuro 14 January 2015, 2 (1) ENEURO.0058-14.2015; DOI: 10.1523/ENEURO.0058-14.2015
Twitter logo Facebook logo Mendeley logo
  • Tweet Widget
  • Facebook Like
  • Google Plus One

Jump to section

  • Article
    • Abstract
    • Significance Statement
    • Introduction
    • Materials and Methods
    • Results
    • Discussion
    • Footnotes
    • REFERENCES
    • Synthesis
    • Author Response
  • Figures & Data
  • Info & Metrics
  • eLetters
  • PDF

Keywords

  • central pattern generator
  • Homeostatic Regulation of Excitability
  • Stomatogastric Nervous System

Responses to this article

Respond to this article

Jump to comment:

No eLetters have been published for this article.

Related Articles

Cited By...

More in this TOC Section

New Research

  • A Very Fast Time Scale of Human Motor Adaptation: Within Movement Adjustments of Internal Representations during Reaching
  • TrkB Signaling Influences Gene Expression in Cortistatin-Expressing Interneurons
  • Optogenetic Activation of β-Endorphin Terminals in the Medial Preoptic Nucleus Regulates Female Sexual Receptivity
Show more New Research

Sensory and Motor Systems

  • Robust representation and nonlinear spectral integration of harmonic stacks in layer 4 of mouse primary auditory cortex
  • Changes in Palatability Processing across the Estrous Cycle Are Modulated by Hypothalamic Estradiol Signaling
  • Automatic, but not autonomous: Implicit adaptation is modulated by goal-directed attentional demands
Show more Sensory and Motor Systems

Subjects

  • Sensory and Motor Systems
  • Home
  • Alerts
  • Follow SFN on BlueSky
  • Visit Society for Neuroscience on Facebook
  • Follow Society for Neuroscience on Twitter
  • Follow Society for Neuroscience on LinkedIn
  • Visit Society for Neuroscience on Youtube
  • Follow our RSS feeds

Content

  • Early Release
  • Current Issue
  • Latest Articles
  • Issue Archive
  • Blog
  • Browse by Topic

Information

  • For Authors
  • For the Media

About

  • About the Journal
  • Editorial Board
  • Privacy Notice
  • Contact
  • Feedback
(eNeuro logo)
(SfN logo)

Copyright © 2026 by the Society for Neuroscience.
eNeuro eISSN: 2373-2822

The ideas and opinions expressed in eNeuro do not necessarily reflect those of SfN or the eNeuro Editorial Board. Publication of an advertisement or other product mention in eNeuro should not be construed as an endorsement of the manufacturer’s claims. SfN does not assume any responsibility for any injury and/or damage to persons or property arising from or related to any use of any material contained in eNeuro.