

Article Figures & Data
Figures
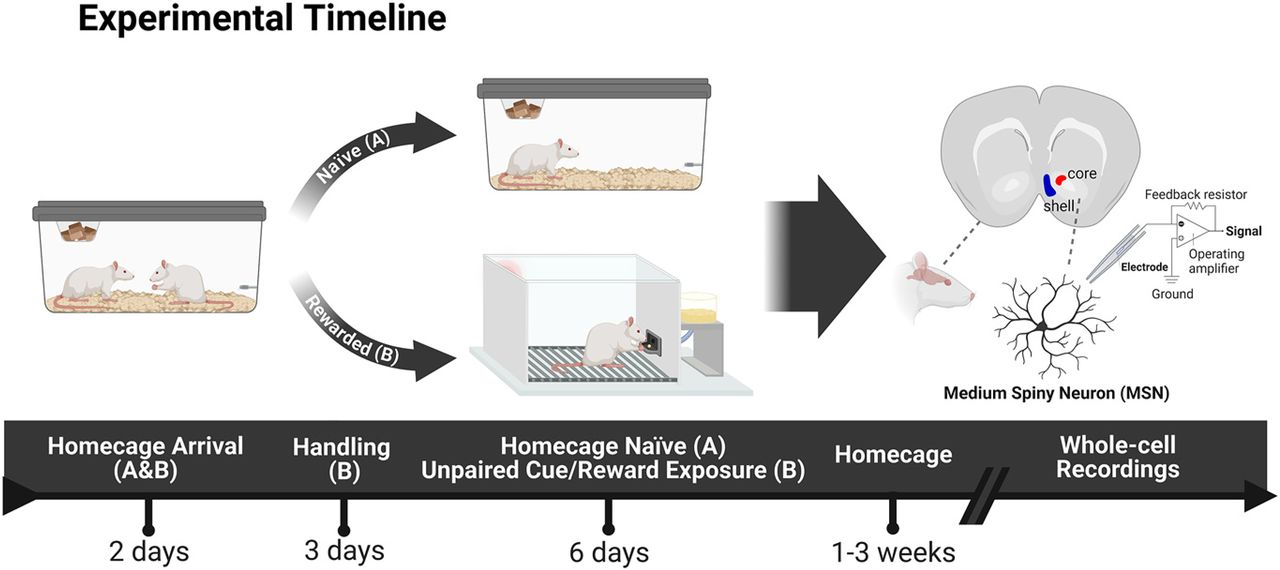
- Figure 1.
Experimental timeline. All rats were housed in pairs on arrival. The Naive group (A) was randomly selected and remained unhandled in their homecages for the entirety of the experiment until electrophysiological recordings were performed. The Rewarded group (B) was handled for 2 d after at least 2 d of acclimation to the housing room. They were then exposed to a pretraining session in the behavioral test apparatus where they received 25 pellets into a food-cup over the course of 30 min. For the following 6 d, they underwent a daily behavioral experience in which a neutral lever-cue was presented, and banana food pellet rewards were delivered into a food-cup randomly and independently of one another. Each session consisted of 25 independent trials of lever and reward presentations (ITI: 30–60 s). After the last session of unpaired cue/reward exposures, rats remained in their homecages for a period of one to three weeks. Subsequently, nucleus accumbens slices were prepared for whole-cell recordings of medium spiny neurons in the core and shell subregions. Behavioral responses for Rewarded rats were recorded and can be found in Extended Data Figure 1-1. Created with BioRender.
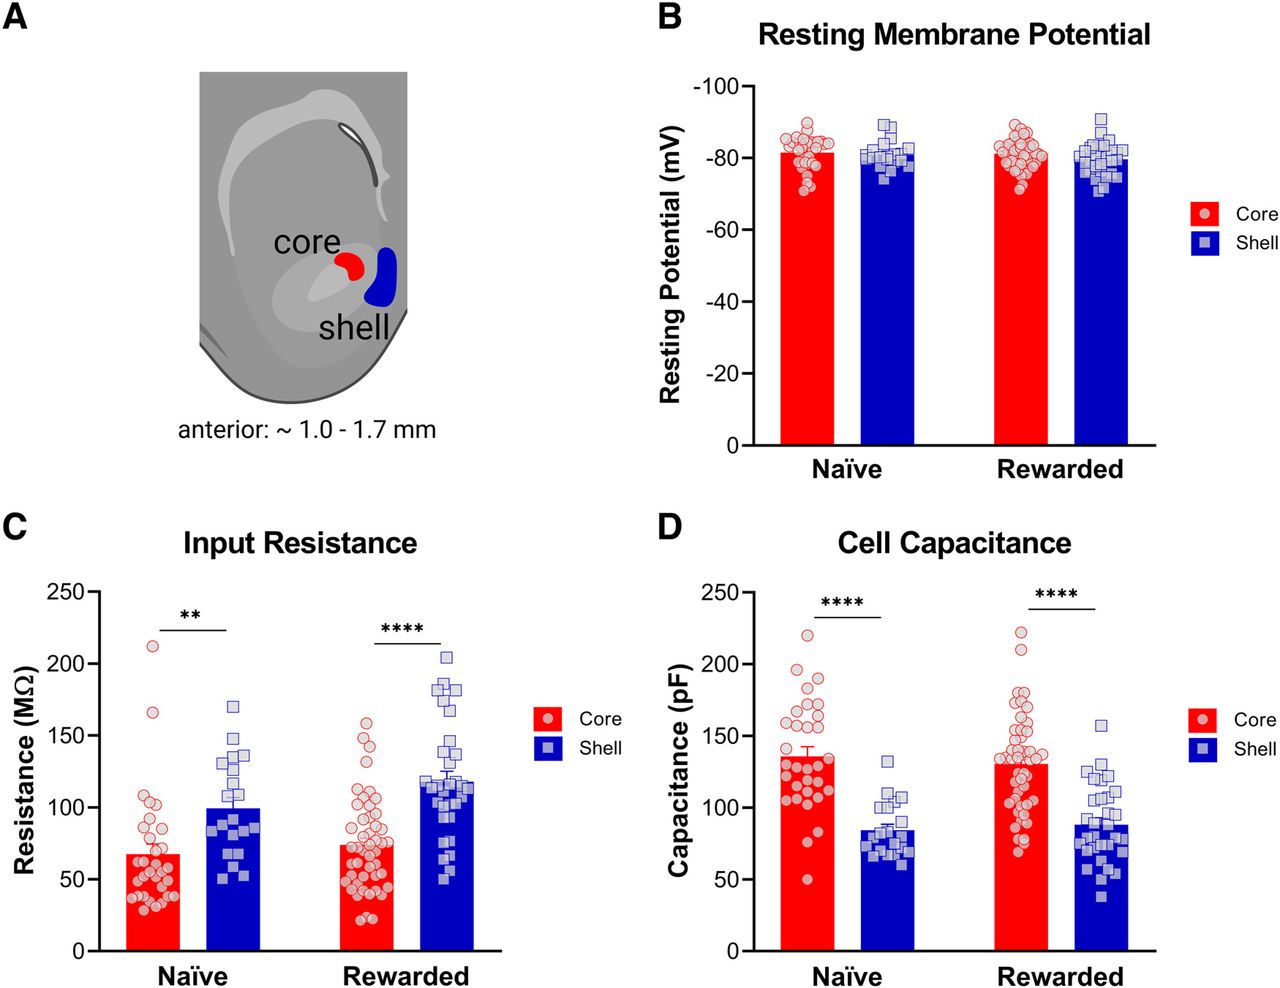
- Figure 2.
Nucleus accumbens (NAc) medium spiny neurons (MSNs) exhibit distinct passive membrane properties in the core versus shell subregions of both naive and rewarded rats. A, Representative diagram of coronal brain section containing the NAc core (red) and medial shell (blue) subregions (created with BioRender). Whole-cell patch-clamp recordings from medium spiny neurons were obtained from the highlighted areas. B, Resting potential. No significant differences were found in resting potential between NAc core and shell (two-way ANOVA: no main effect of subregion, p > 0.05). C, Input resistance. In both naive and rewarded groups, input resistance was significantly greater in NAc shell MSNs compared with core MSNs (two-way ANOVA: main effect of subregion, p < 0.001). D, Cell capacitance was significantly lower in NAc shell MSNs compared with core MSNs of both naive and rewarded rats (two-way ANOVA: main effect of subregion, p < 0.0001). Significance for Sidak’s post hoc test is shown as **p < 0.01, ****p < 0.0001. Each data point represents a single cell. Data are presented as mean ± SEM. Please refer to Table 2 for complete statistical report.
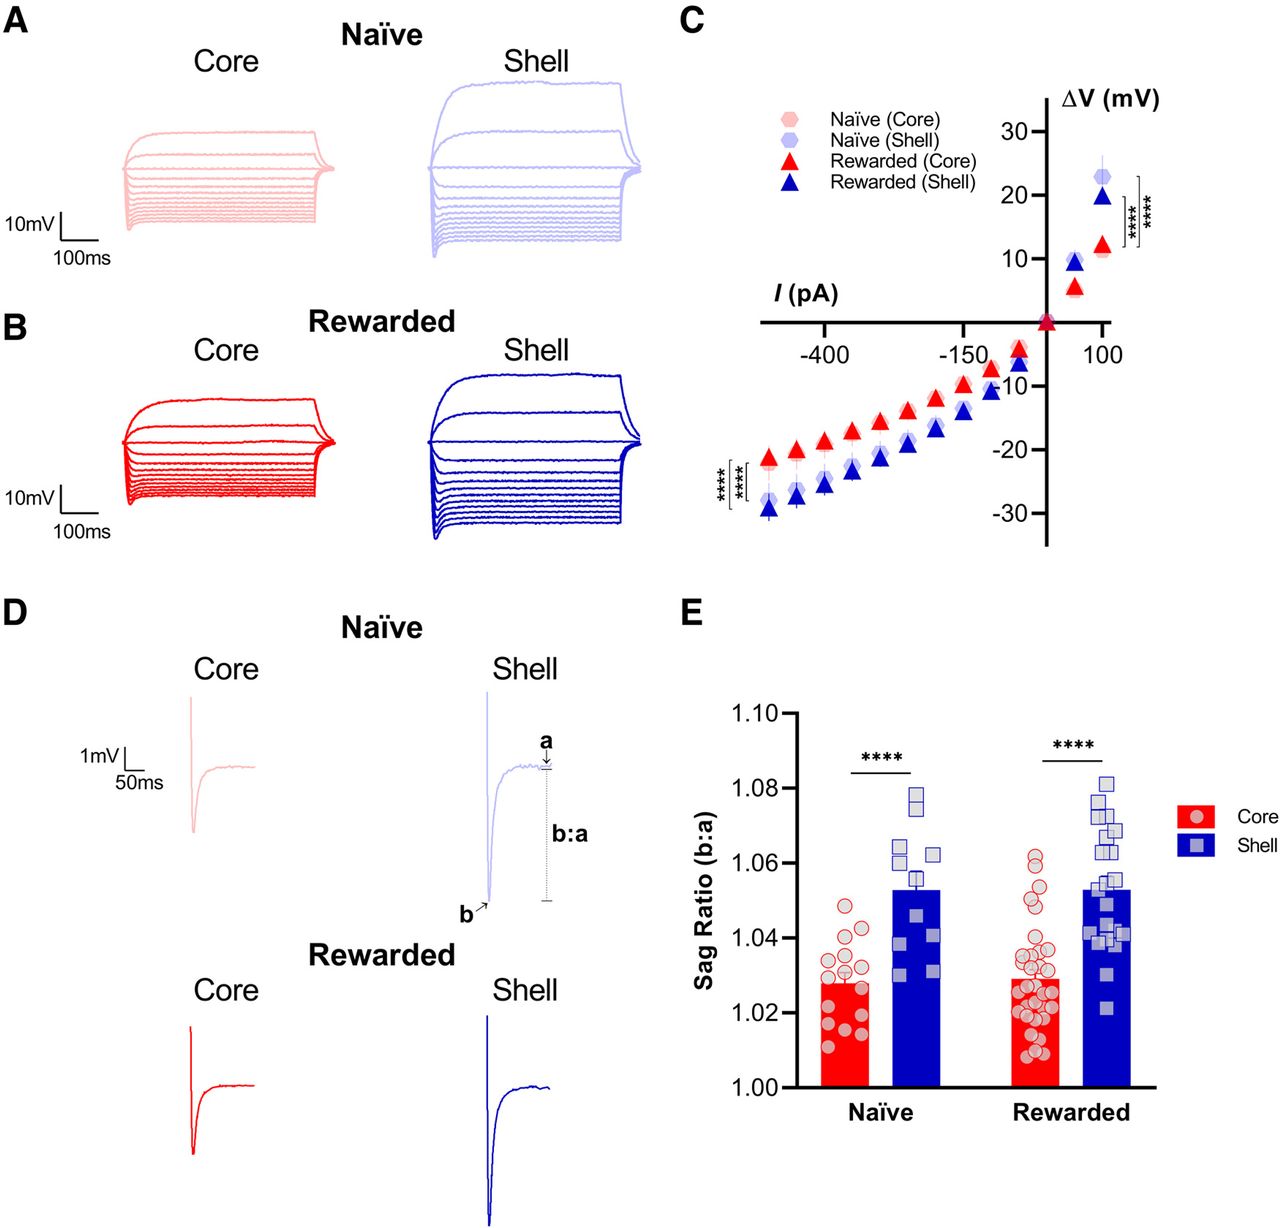
- Figure 3.
Nucleus accumbens (NAc) medium spiny neurons (MSNs) in the shell exhibit greater sag ratios and larger changes in membrane potential in response to current injections than core MSNs of both naive and rewarded rats. Representative voltage response traces from current-clamp recordings of MSNs in NAc core (left) and shell (right) slices from (A) naive and (B) rewarded rats. Current injection step protocol ranged from −500 to +100 pA and is shown here in 50-pA increments. C, Voltage/current (V/I) relationship curve is significantly different between NAc shell and core MSNs of both naive and rewarded rats. The same hyperpolarizing (−500–0 pA) and depolarizing (0–100 pA) current injection steps consistently elicited a greater change in membrane potential in the shell versus in the core, causing a significant shift of the V/I curve (hyperpolarizing: mixed-effects model: main effect of subregion, p < 0.0001; depolarizing: mixed-effects model: main effect of subregion, p < 0.0001). D, Representative current-clamp recordings of voltage sag response to a −500-pA current injection from MSNs of NAc core (left) and shell (right) slices from naive (top) and rewarded (left) rats. Traces are shown as the average from all cells for each group and subregion. E, Sag ratio (b:a) was obtained by dividing the peak voltage response to a −500-pA current injection (b) over the steady-state response 200 ms from the onset of stimulation (a). In both naive and rewarded rats, MSNs in the NAc shell showed a greater sag ratio, representative of a larger sag, compared with MSNs in the NAc core (two-way ANOVA: main effect of subregion, p < 0.0001). Significance for mixed-effect model planned comparison (C) and Sidak’s post hoc test (E) is shown as ****p < 0.0001. Each data point represents a single cell. Data are presented as mean ± SEM. Please refer to Table 2 for complete statistical report.
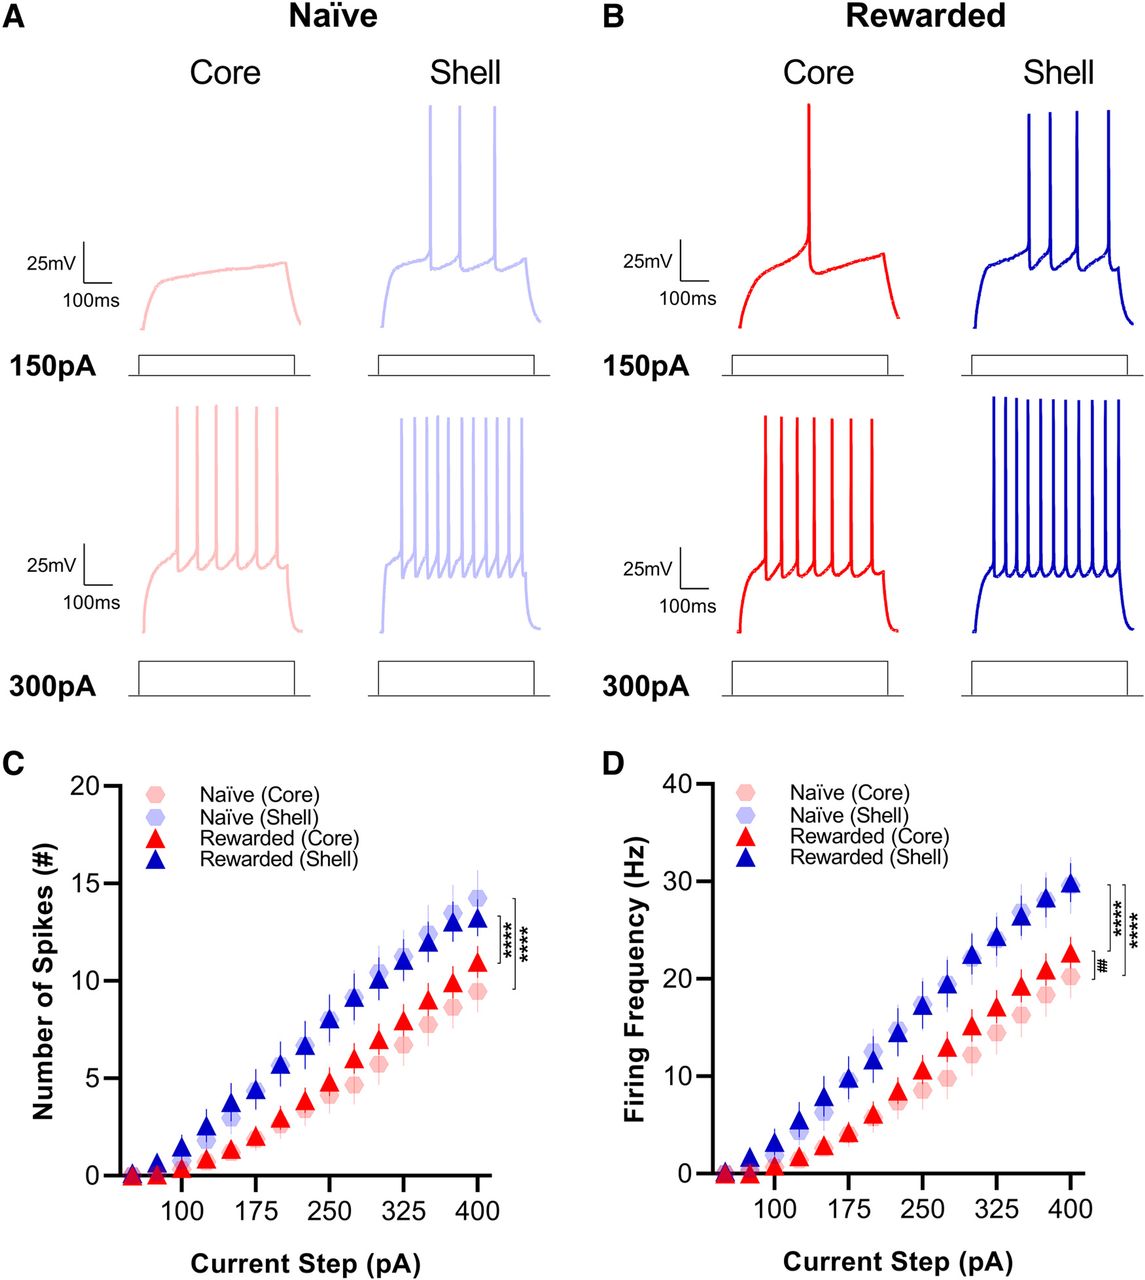
- Figure 4.
Medium spiny neurons (MSNs) located in the shell exhibit greater excitability than core MSNs of both naive and rewarded rats. Representative traces of current-clamp recordings from MSNs in NAc core (left) and shell (right) slices of (A) naive and (B) rewarded rats in response to 150-pA (top) and 300-pA (bottom) current injections. C, Number of spikes. MSNs in the NAc shell showed a higher number of spikes compared with MSNs in the NAc core in response to current injection steps of the same magnitude (mixed-effects model: main effect of subregion, p < 0.0001). D, Firing frequency. Similarly, MSNs in the NAc shell showed greater firing frequency compared with MSNs in the NAc core in response to current injection steps of the same magnitude (mixed-effects model: main effect of subregion, p < 0.0001). MSNs in the core of naive rats also had lower firing frequency compared with those in the rewarded group (mixed-effects model: main effect of group; p < 0.05). Significance for mixed-effect model planned comparison is shown as ****p < 0.0001, ##p < 0.01. Data are presented as mean ± SEM. Please refer to Table 2 for complete statistical report.
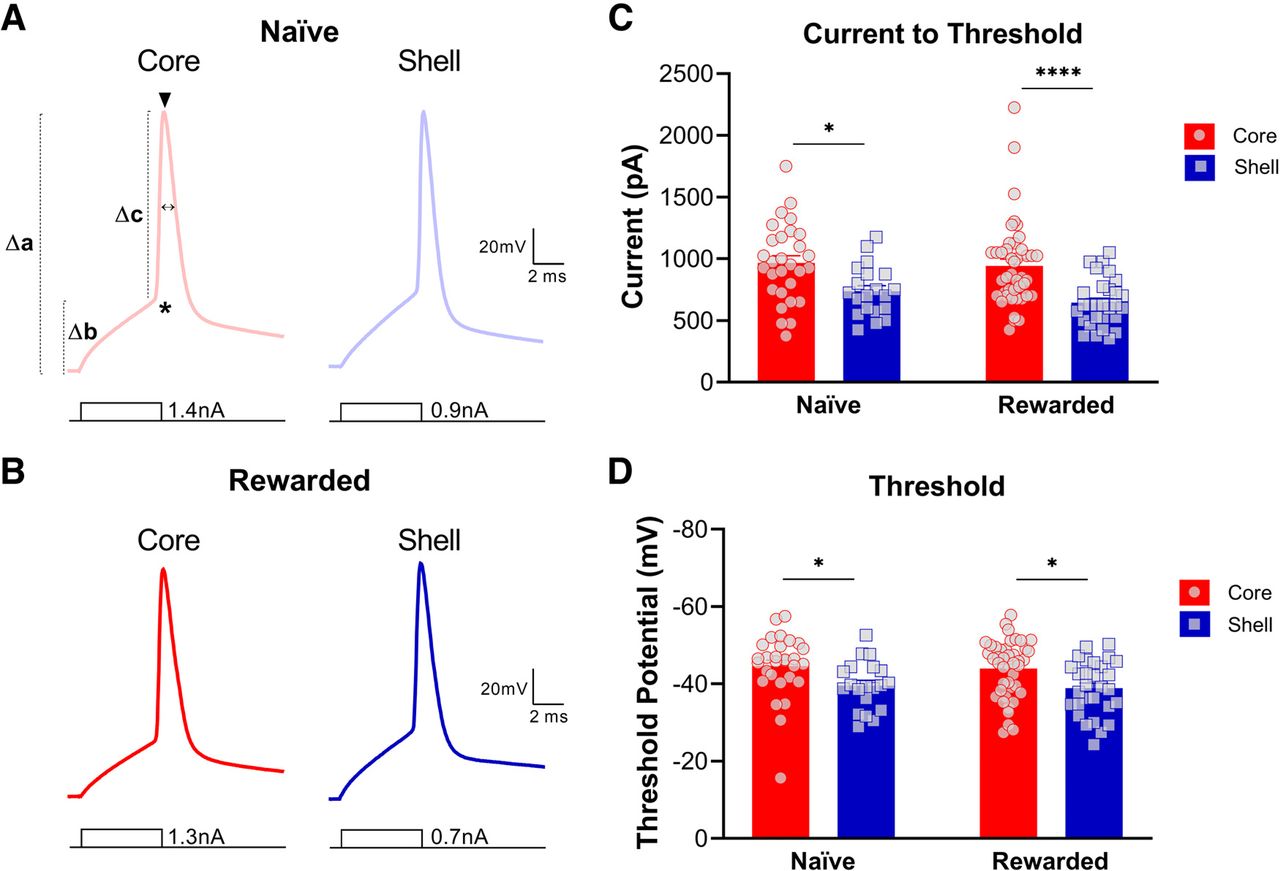
- Figure 5.
Nucleus accumbens (NAc) medium spiny neurons (MSNs) exhibit distinct action potential properties in the core versus shell subregions of both naive and rewarded rats. Representative single action potential traces of current-clamp recordings from MSNs in NAc core (left) and shell (right) slices of (A) naive and (B) rewarded rats. Symbols illustrated on A (left) represent the following: * = AP threshold (mV), Δb = Δ RMP/AP threshold (mV), ▾ = AP amplitude (mV), Δa = Δ RMP/AP amplitude (mV), Δc = Δ AP threshold/AP amplitude (mV), ↔ = AP halfwidth (ms). C, Current to threshold: In both naive and rewarded groups, the current necessary to elicit a single action potential was significantly lower in NAc shell MSNs compared with core MSNs (two-way ANOVA: main effect of subregion, p < 0.0001). D, Action potential threshold. AP threshold was significantly more depolarized in NAc shell MSNs compared with core MSNs of both naive and rewarded rats (two-way ANOVA: main effect of subregion, p < 0.001). Significance for Sidak’s post hoc test is shown as *p < 0.05, ****p < 0.0001. Each data point represented a single cell. Data are presented as mean ± SEM. Please refer to Table 2 for complete statistical report.


Tables
- Table 1
Electrophysiological passive and active properties of medium spiny neurons in the core and shell of nucleus accumbens of naive and rewarded animals
Naive Statistics Rewarded Statistics Core Shell t/F, p Core Shell t/F, p Passive membrane properties Resting membrane potential, mV −81.5 ± 0.8 (31) −80.0 ± 0.8 (20) 0.48, 0.86 −81.2 ± 0.6 (47) −79.7 ± 0.8 (31) 1.60, 0.21 Cell capacitance, pF 136 ± 7 (31) 84 ± 4 (20) 5.66, <0.0001 130 ± 5 (47) 88 ± 5 (31) 5.79, <0.0001 Input resistance, MΩ 67 ± 7 (31) 99 ± 8 (20) 3.07, 0.0053 74 ± 5 (47) 118 ± 7 (31) 5.23, <0.0001 Active membrane properties V/I curve (−500 to 0 pA) −12.0 ± 0.3 (15) −17.2 ± 0.4 (11) 55.8, 3.61−13 −12.7 ± 0.2 (33) −17.7 ± 0.3 (21) 227, 8.66–47 V/I curve (0 to +100 pA) 5.4 ± 0.5 (15) 10.8 ± 0.6 (11) 40.4, 4.11−9 6.1 ± 0.3 (33) 9.8 ± 0.4 (21) 47.3, 4.65−11 Sag ratio at −500 pA, mV 1.028 ± 0.003 (15) 1.053 ± 0.005 (11) 4.32, <0.0001 1.029 ± 0.002 (33) 1.053 ± 0.004 (21) 5.85, <0.0001 Number of spikes, AP# 3.2 ± 0.2 (31) 6.7 ± 0.3 (20) 72.8, 8.57−17 4.5 ± 0.2 (47) 6.8 ± 0.2 (31) 66.6, 8.93−16 Firing frequency, Hz 8.1 ± 0.4 (31) 14.5 ± 0.6 (20) 81.7, 1.48−18 9.6 ± 0.4 (47) 14.9 ± 0.4 (31) 84.1, 2.25−19 Current to threshold, pA 966 ± 58 (29) 737 ± 45 (20) 2.73, 0.014 943 ± 52 (43) 643 ± 36 (29) 4.32, <0.0001 AP threshold, mV (*) −44 ± 1.5 (29) −39.5 ± 1 (20) 2.37, 0.038 −44 ± 1 (43) −39 ± 1 (29) 2.85, 0.010 Δ RMP/AP threshold, mV (Δb) 36 ± 1.6 (29) 41 ± 1.6 (20) 2.21, 0.056 37 ± 1 (43) 40 ± 1.6 (29) 1.64, 0.20 AP amplitude, mV (▾) 53 ± 1 (29) 50 ± 1 (20) 1.23, 0.39 53 ± 1 (43) 50 ± 1 (29) 2.01, 0.090 Δ RMP/AP amplitude, mV (Δa) 134 ± 1.6 (29) 131 ± 2 (20) 1.01, 0.53 134 ± 1 (43) 128 ± 1.5 (29) 2.64, 0.018 Δ AP threshold/AP amplitude, mV (Δc) 97 ± 2 (29) 90 ± 2 (20) 2.20, 0.059 97 ± 2 (43) 88 ± 2 (29) 2.94, 0.0078 AP halfwidth, ms (↔) 0.66 ± 0.01 (29) 0.68 ± 0.02 (20) 0.76, 0.70 0.68 ± 0.02 (43) 0.70 ± 0.02 (29) 0.62, 0.79 Table lists mean ± SEM (sample size) for passive and active properties of core and shell MSNs for both naive and rewarded rats. Statistics for core versus shell comparisons were obtained from Sidak’s post hoc test (t value, p value) and mixed-effects model planned comparisons (F value, p value). Main effects and interactions are detailed in Table 2.
- Table 2
Full statistical report for electrophysiological passive and active properties of medium spiny neurons in the core and shell of nucleus accumbens of naive and rewarded animals
Effects F, df, p Post hoc
Comparisont/F, df, p Figure 2 2B, resting membrane
potentialSubregion (no main effect)a F(1,125) = 1.90, p = 0.17 - - 2C, input resistance Subregion (main effect)a F(1,125) = 32.2, p < 0.0001 Naive: core vs shellc
Rewarded: core vs shellct(125) = 3.067, p = 0.0053
t(125) = 5.232, p < 0.00012D, cell capacitance Subregion (main effect)a F(1,125) = 64.6, p < 0.0001 Naive: core vs shellc
Rewarded: core vs shellct(125) = 5.661, p < 0.0001
t(125) = 5.789, p < 0.0001Figure 3 3C, voltage/current curve
Hyperpolarizing: −500–0 pA
Depolarizing: 0–100 pASubregion (main effect)b
Current injection (main effect)b
Subregion × current injection
(interaction)b
Subregion (main effect)b
Current injection (main effect)b
Subregion × current injection
(interaction)bF(1,1596) = 224, p = 1.48 × 10−47
F(20,1596) = 109, p = 1.02 × 10−281
F(20,1793) = 1.68, p = 0.03
F(1,375) = 86.8, p = 1.06 × 10⁻¹⁸
F(4,375) = 142, p = 9.26 × 10−74
F(4,375) = 11.7, p = 6.17 × 10⁻⁹Naive: core vs shellb
Rewarded: core vs shelld
Naive: core vs shellb
Rewarded: core vs shelldF(1,504) = 55.8, p = 3.61 × 10⁻¹³
F(1,1092) = 227, p = 8.66 × 10−47
F(1,117) = 40.4, p = 4.11 × 10⁻⁹
F(1,258) = 47.3, p = 4.65 × 10−113E, sag ratio Subregion (main effect)a F(1,76) = 47.6, p < 0.0001 Naive: core vs shellc
Rewarded: core vs shellct(76) = 4.32, p < 0.0001
t(76) = 5.86, p < 0.0001Figure 4 4C, number of spikes Subregion (main effect)b
Current injection (main effect)b
Subregion × current injection
(interaction)bF(1,1793) = 137, p = 1.34 × 10⁻³⁰
F(14,1793) = 89.4, p = 2.17 × 10−194
F(14,1793) = 2.55, p = 0.001Naive: core vs shellb
Rewarded: core vs shelldF(1,706) = 72.8, p = 8.57 × 10⁻¹⁷
F(1,1087) = 66.6, p = 8.93 × 10−164D, firing frequency Subregion (main effect)b
Current injection (main effect)b
Group (main effect)b
Subregion × current injection
(interaction)bF(1,1793) = 162, p = 9.17 × 10−36
F(14,1793) = 97.7, p = 8.23 × 10−209
F(1,1793) = 4.09, p = 0.043
F(14,1793) = 2.94, p = 0.0002Naive: core vs shellb
Rewarded: core vs shelld
Core: Naive vs rewardeddF(1,706) = 81.7, p = 1.48 × 10⁻¹⁸
F(1,1087) = 84.1, p = 2.25 × 10⁻¹⁹
F(1,1097) = 7.38, p = 0.007Figure 5 5C, current to threshold Subregion (main effect)a F(1,117) = 23.6, p < 0.0001 Naive: core vs shellc
Rewarded: core vs shellct(117) = 2.73, p = 0.014
t(117) = 4.32, p < 0.00015D, threshold potential Subregion (main effect)a F(1,117) = 13.3, p = 0.0004 Naive: core vs shellc
Rewarded: core vs shellct(117) = 2.37, p = 0.038
t(117) = 2.86, p = 0.01Table 1 (not in figure) Δ RMP/AP threshold Subregion (main effect)a F(1,117) = 7.59, p = 0.0068 Naive: core vs shellc
Rewarded: core vs shellct(117) = 2.22, p = 0.056
t(117) = 1.64, p = 0.20AP amplitude Subregion (main effect)a F(1,117) = 5.0, p = 0.028 Naive: core vs shellc
Rewarded: core vs shellct(117) = 1.23, p = 0.39
t(117) = 2.01, p = 0.090Δ RMP/AP amplitude Subregion (main effect)a F(1,117) = 6.07, p = 0.015 Naive: core vs shellc
Rewarded: core vs shellct(117) = 1.00, p = 0.53
t(117) = 2.64, p = 0.018Δ AP threshold/AP
amplitudeSubregion (main effect)a F(1,117) = 12.7, p = 0.0005 Naive: core vs shellc
Rewarded: core vs shellct(117) = 2.20, p = 0.059
t(117) = 2.94, p = 0.0078AP halfwidth Subregion (no main effect)a F(1,117) = 0.96, p = 0.33 - -
Extended Data Figure 1-1
Individual behavioral responses of Rewarded rats during random lever presentations. Number (A) and latency (B) of lever presses (black) and magazine entries (gray) during the 10-s lever presentation for each rat in the Rewarded group across all six training sessions. Rats exhibited significantly greater number of magazine entries than lever presses (mixed-effects model: behavioral response × session interaction, p < 0.0001) as well as lower latency (mixed-effects model: behavioral response × session interaction, p < 0.0001) for magazine entries than lever presses across all six sessions. Behavioral responses are consistent with absence of predictive learning about the lever cue and an increase in magazine entries due to unexpected reward deliveries. Significance for mixed-effect model interaction is shown as ****p < 0.0001. Download Figure 1-1, TIF file.
In this issue


