

Article Figures & Data
Figures
- Figure 1.
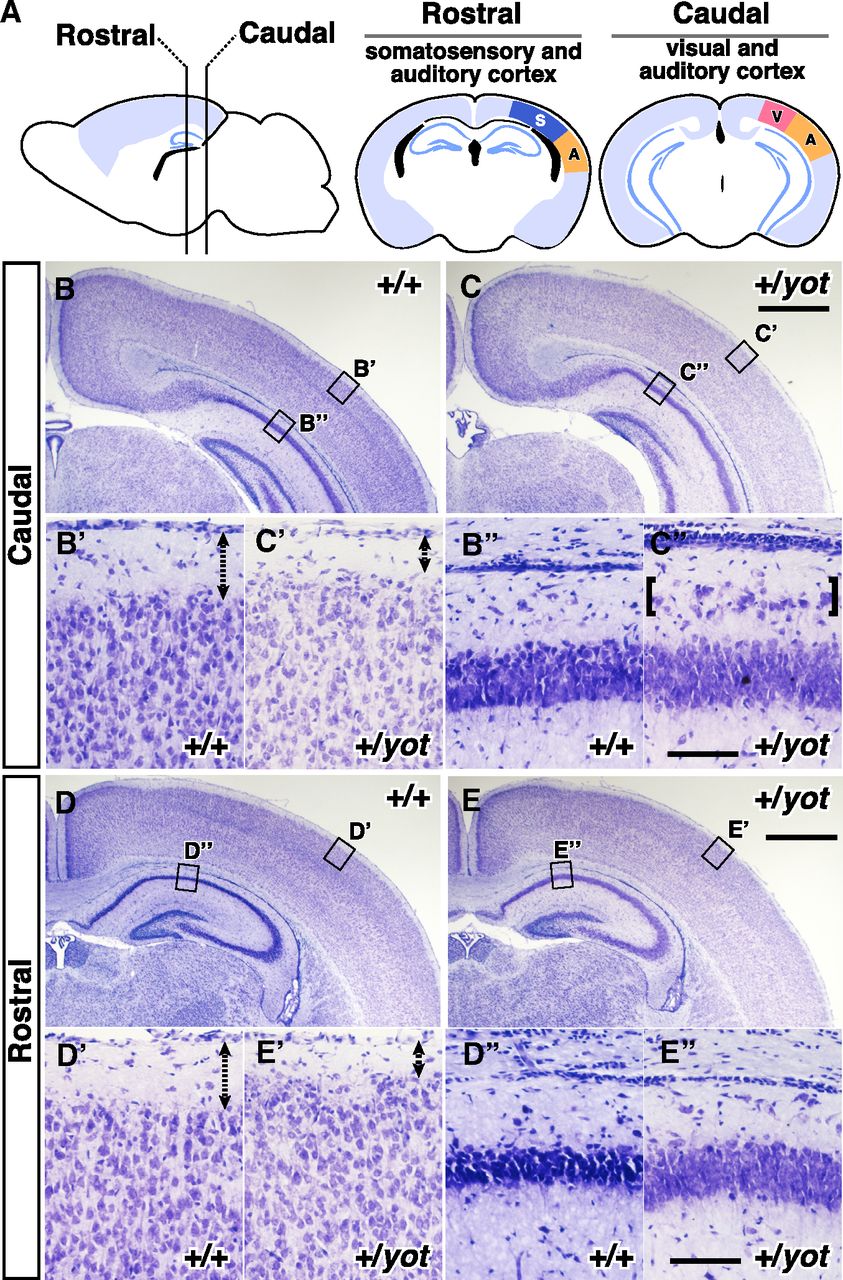
Cortical layer 1 is thinner and the CA1 pyramidal cell layer is split in the caudal hippocampus of heterozygous yotari mutant mice. A, Schematic illustrations of the analyzed brain regions in B–E’’. S: somatosensory cortex; A: auditory cortex; V: visual cortex. B–E’’, Nissl-stained coronal brain sections of the caudal region containing the visual and auditory cortices (B–C’’, Caudal) and rostral region containing the somatosensory and auditory cortices (D–E’’, Rostral) from wild-type mice (+/+; B, B’, B’’, D, D’, D’’) and heterozygous yotari mice (+/yot; C, C’, C’’, E, E’, E’’) at P7. Enlarged views from the regions enclosed by rectangles in B, C, D, E are shown in B’, B’’, C’, C’’, D’, D’’, E’, E’’, respectively. B’ and C’ show auditory cortex, and D’ and E’ show somatosensory cortex. Layer 1 is shown by dashed arrows with two ends (B’, C’, D’, E’). Ectopic cells in heterozygous yotari mutant mice are indicated by brackets in C’’. Scale bars: 1 mm (B, C, D, E) and 10 μm (B’, B’’, C’, C’’, D’, D’’, E’, E’’).
- Figure 2.
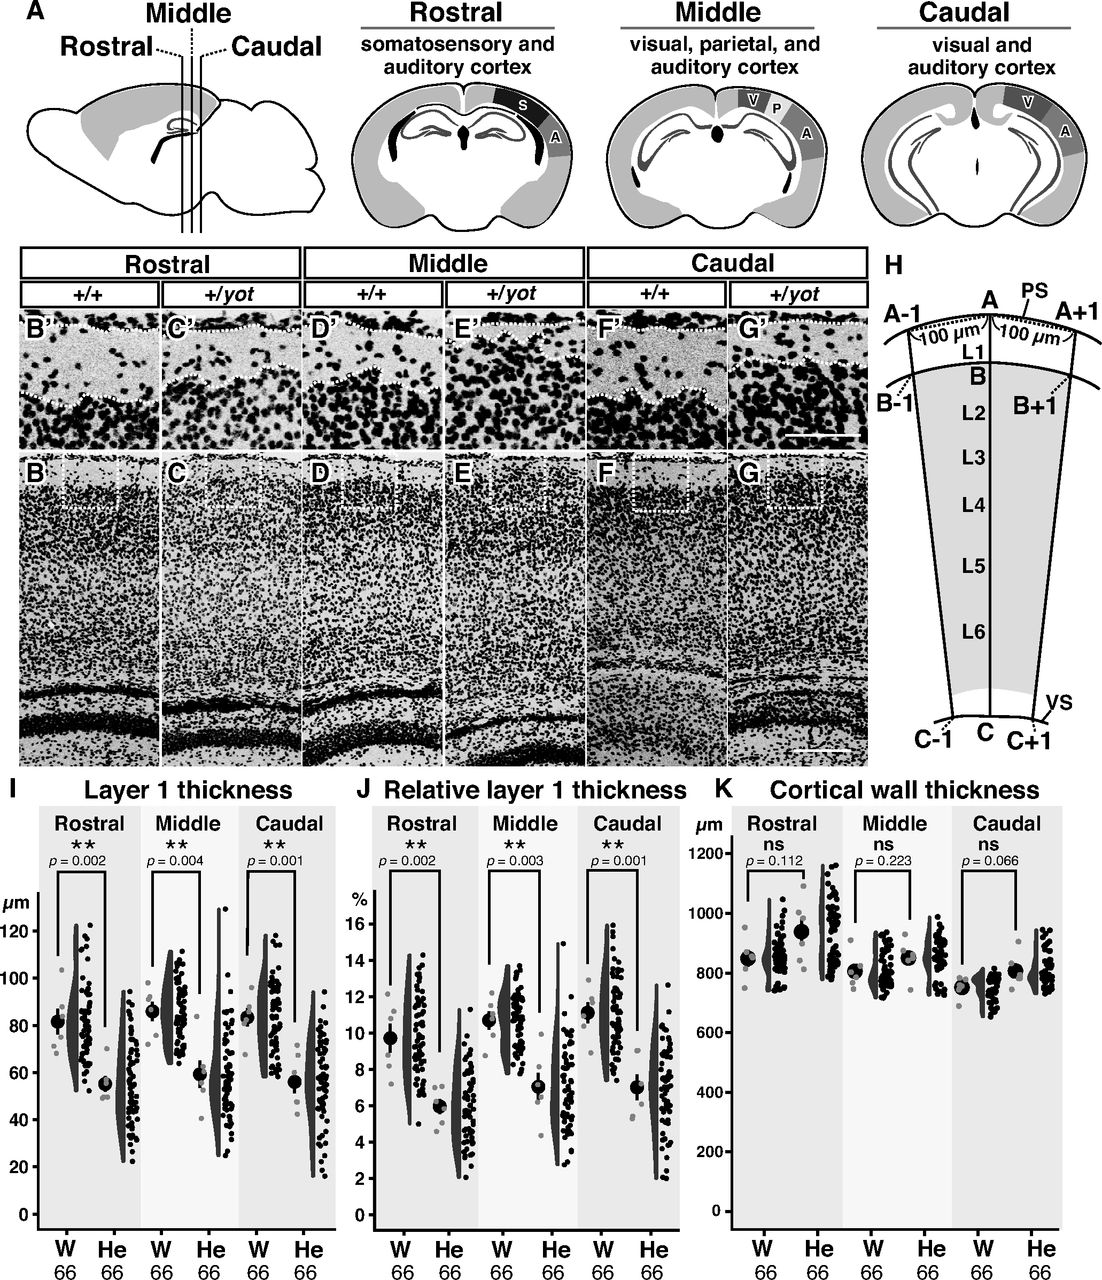
Reduced neocortical layer 1 thickness in heterozygous yotari mutant mice. A, Schematic illustrations showing brain regions analyzed for layer 1 and cortical wall thickness. S: somatosensory cortex; A: auditory cortex; V: visual cortex, P: parietal cortex. B–G’, DAPI staining of wild-type (+/+; B, B’, D, D’, F, F’) and heterozygous yotari (+/yot, C, C’, E, E’, G, G’) mouse cerebral neocortex at P7. Representative images obtained from the somatosensory (Rostral: B, B’, C, C’), parietal (Middle: D, D’, E, E’), and visual (Caudal: F, F’, G, G’) cortex. Boxed regions in B–G are magnified in B’–G’, respectively. H, Schematic illustration showing a region of the cerebral neocortex. Straight lines from points A, A − 1, and A + 1 on the pial surface (PS) to points C, C − 1, and C + 1 on the ventricular surface (VS), and their intersections B, B − 1, and B + 1, respectively, between layer 1 (L1) and layer 2 (L2). See Materials and Methods and Extended Data Figure 2-1 for details. I–K, Combination of dot, violin, and scatter plots showing layer 1 thickness (I), relative layer 1 thickness (J), and cortical wall thickness (K) across brain regions. The black dot and bar in the leftmost dot plot indicate mean and SD, respectively, and each gray dot indicates the mean from one individual brain. Each black circle in the scatter plot is a raw datapoint. Measurement was performed on six brains obtained from six different litters (n = 6). Three different coronal sections were obtained from the caudal, middle, and rostral brain of each mouse as shown in A, and 11 positions were analyzed per brain region. Mean values were then calculated for each brain region. Genotype differences were analyzed by Student’s t test. **p < 0.01, ns (not significant) p > 0.05. Scale bars: 200 μm (B–G) and 50 μm (B’–G’).
- Figure 3.
Half reduction of the Dab1 gene dosage does not cause a significant positional change of neocortical layer 2–6 neurons. A, TBR1-positive, RORB-positive, or BRN2-positive cells in the somatosensory (Rostral), parietal (Middle), and visual (Caudal) cortices of P7 wild-type (+/+) and heterozygous yotari mice (+/yot). Representative images of coronal neocortical sections in the middle brain region are shown. B, Schematic illustration showing a region of the cerebral neocortex. Distances from the ventricular surface (VS) to the target cells (D1) and cortical wall thickness (D2) were measured, and the relative positions of cells were calculated by dividing D1 by D2 and multiplying by 10. C, D, Combination of dot, violin, and scatter plots showing the relative positions of layer marker-positive cells (C) and distances of layer marker-positive cells from the ventricular surface (D) within three brain regions along the rostro-caudal axis. The black dot and bar in the leftmost dot plot indicate the mean and SD, respectively, and each gray dot indicates the mean of one brain. Each black circle in the scatter plot is a raw datapoint. Measurements were performed on three brains from different litters (n = 3) per group. The total number of analyzed cells (pooled from three mice per group) are shown below each graph. After calculation of mean values for each brain, most group differences were analyzed by independent samples Student’s t test; however, some experiments were analyzed by Mann–Whitney U test [C, BRN2 (Middle)] or unpaired Welch’s t test [C, TBR1 (Rostral); D, TBR1 (Rostral)]. The p-values are labeled on the graph. ns (not significant) p > 0.05. Scale bar: 100 μm.
- Figure 4.
There were no significant positional changes in late-born, BRN2-positive, superficial neocortical neurons in yotari heterozygous mice. A, Coronal sections of P9 parietal neocortex from wild-type (+/+) and heterozygous yotari (+/yot) mice injected with BrdU at E16.5. Sections were co-stained with BrdU (green), the layer 2 marker BRN2 (magenta), and the nuclear stain DAPI (blue). B, C, Combination of dot, violin, and scatter plots showing relative positions of BrdU/BRN2 double-positive cells between the ventricular surface and pial surface (B) and distances of BrdU/BRN2 double-positive cells from the ventricular surface (C) in somatosensory (Rostral), parietal (Middle), and visual (Caudal) cortices of wild-type (W) and heterozygous yotari (He) mice. The black dot and bar in the leftmost dot plot indicate the mean and SD, respectively, each gray dot indicates the mean from one brain, and each black circle in the scatter plot is a raw datapoint. Data were obtained from three brains per group, each from different litters (n = 3). Total analyzed cell numbers pooled from three mice per group are shown below each graph. After calculation of the mean values for each brain, group differences were analyzed by independent samples Student’s t test. The p-values are labeled on the graph. ns (not significant). Scale bar: 100 μm.
- Figure 6.
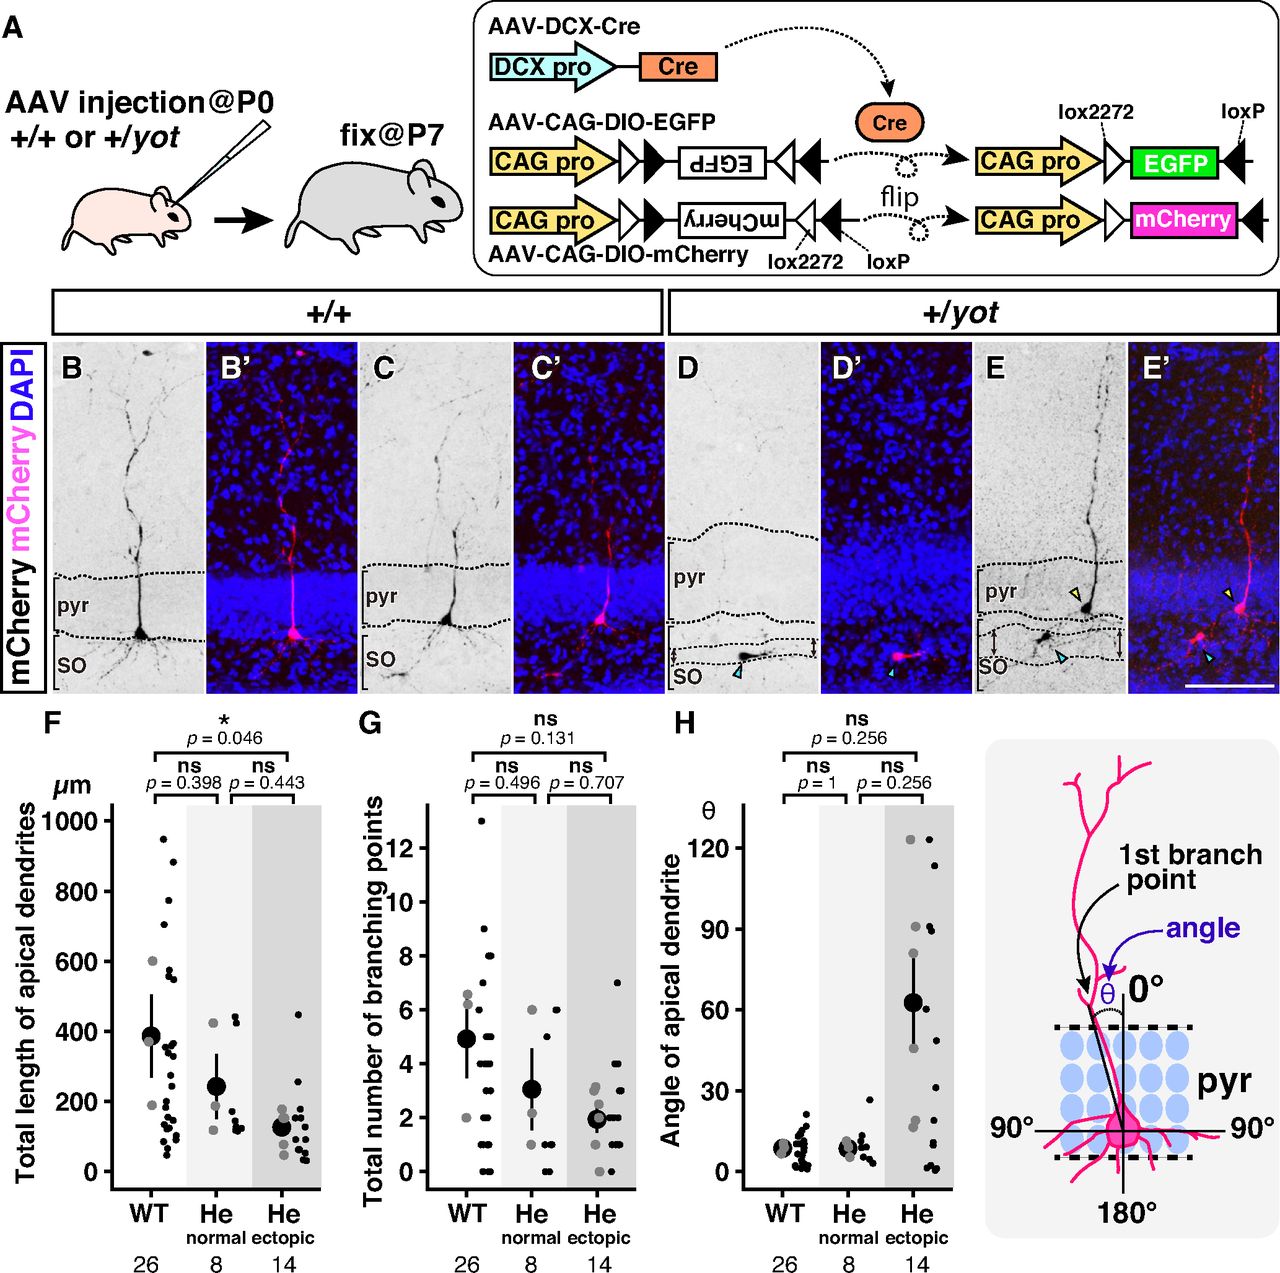
Ectopic cells within the split pyramidal cell layer have shorter and misoriented apical dendrites. A, Schematic illustration showing the time schedule and strategy for sparse labeling of hippocampal cells. A mixture of AAV-DCX-Cre, AAV-CAG-DIO-EGFP, and AAV-CAG-DIO-mCherry was injected into the lateral ventricles of wild-type and heterozygous yotari mice at P0, and brain slices were prepared at P7. AAV-DCX-Cre expresses Cre under the control of a DCX promoter (DCX pro), while AAV-CAG-DIO-EGFP and AAV-CAG-DIO-mCherry contain a DIO-EGFP or DIO-mCherry cassette driven by a CAG promoter (CAG pro). The DIO cassette is composed of two reciprocally oriented loxP sites (black triangles) and two lox2272 sites (white triangles), and EGFP, or mCherry cDNA was inserted within the DIO cassette in the opposite direction to the CAG promoter; therefore, there is no transcription of those cDNA under normal conditions. However, simultaneous infection with Cre recombinase flips the orientation of EGFP or mCherry cDNA into the forward direction by two-step recombination between loxP and lox2272 sites. The enclosed rectangle and rounded rectangle represent the Cre cDNA and Cre protein, respectively. B–E’, Coronal sections of caudal neocortex (including visual and auditory cortex) from wild-type (+/+, B–C’) and heterozygous yotari (+/yot, D–E’) mice were stained with anti-RFP (black or magenta) and DAPI (blue). Representative images of mCherry-positive cells in the pyramidal cell layer (pyr) of wild-type mice (B–C’), normally distributed cells in the pyramidal cell layer of heterozygous yotari mice (yellow arrowheads in E and E’), and ectopically distributed cells in the SO (cyan arrowheads in D–E’) of heterozygous yotari mice (D–E’). The ectopic cell regions in the SO of heterozygous yotari mice are indicated by double-headed arrows (D and E). F–H, Total length of apical dendrites (F), total number of branching points (G), and angle of apical dendrites (H) obtained for 26 neurons from three wild-type (WT) mice, eight normally distributed neurons from three heterozygous yotari mice (He, normal), and 14 ectopically distributed neurons from six heterozygous yotari mice (He, ectopic) are plotted by a combination of dot and scatter plots. All analyzed mice were obtained from different litters. The large black dot and the bar in the leftmost dot plot indicate the mean and SD, respectively, and the gray dots indicate the mean from one brain. Each small black dot in the scatter plot is a raw datapoint. The total number of analyzed cells is shown below each graph. After calculation of the mean values from each brain, groups were compared by Tukey–Kramer test (F and G) or Steel–Dwass test (H). The p-values are labeled on the graph. *p < 0.05, ns (not significant) p > 0.05. The schematic drawing in H shows a pyramidal neuron in the pyramidal cell layer (pyr). The angle (θ) of the primary apical dendrite was determined as the angle between a perpendicular line passing through the center of the neuron and the first branch point.
- Figure 7.
Superficial late-born neocortical neurons of heterozygous yotari mice show less apical dendrite sprouting in layer 1. A, Strategy and time schedule for sparse labeling of superficial neurons. The DCX promoter-driven Cre expression plasmid pDCX-Cre was co-electroporated with the Cre-reporter plasmid pCAGGS-RG at E16.5, and mice were fixed at P9. In the absence of Cre, the pCAGGS-RG expresses DsRed under the CAG promoter, whereas in the presence of Cre, the floxed-DsRed-poly A expression cassette is excised and the plasmid expresses EGFP. To reduce the recombination probability, pDCX-Cre plasmid concentration was significantly reduced. DCX pro, CAG pro, and pA represent the DCX promoter, CAG promoter, and simian virus 40 polyadenylation signal, respectively. The rectangle and rounded rectangle represent the Cre cDNA and Cre protein, respectively. B, C, Electroporated brains at P9 obtained from wild-type (B, +/+) and heterozygous yotari mice (C, +/yot) were sectioned coronally. The superficial part of the somatosensory cortex is shown. Scale bar: 100 μm. D, Sparsely labeled EGFP-positive cells obtained from wild-type (+/+) and heterozygous yotari mice (+/yot) for measurement of primary apical dendrite angle. Cyan dotted lines are drawn from the center of the cell body to the first branch point. Scale bar: 20 μm. E, A schematic illustrating a neuron in the superficial cerebral neocortex. The angle of the primary apical dendrite (θ) was defined as the angle between a perpendicular line passing through the center of the cell and the first branch point. E–G, Combination of dot, violin, and scatter plots showing the apical dendrite angle (E), total length (F), and total lengths specifically in layer 1 (L1) and layer 2 (L2) (G). H, I, The total number of apical dendrite branching points (H) and the total number of branching points within layer 1 (L1) and layer 2 (L2) (I) obtained from three WT (+/+) and six heterozygous yotari mice (+/yot) from different litters. The black dot and bar in the leftmost dot plot indicate the mean and the SD, respectively, and the gray dots indicates the mean for each brain. Each black circle in the scatter plot is a raw datapoint. The total number of analyzed cells is shown below each graph. After calculation of mean values for each brain, groups were compared by independent samples Student’s t test (E, F, G, I) or Mann–Whitney U test (H). The p-values are labeled on the graph. *p < 0.05, **p < 0.01, ns (not significant) p > 0.05.
- Figure 5.
Abnormal splitting of the CA1 pyramidal cell layer in the caudal hippocampus of heterozygous yotari mice is due mainly to migration failure of later-born neurons. A, C, BrdU was administered at E12.5, E14.5, or E16.5 to wild-type (+/+) and heterozygous yotari (+/yot) mice, and brains were fixed at P9 (A) or P3 (C). Coronal sections of the caudal brain region containing the visual and auditory cortex were stained using anti-BrdU antibody (black or green) and anti-CTIP2 antibody (magenta), while nuclei were stained with DAPI (blue). Abnormal splitting of the CA1 pyramidal cell layer is indicated by the region between two brackets in stratum oriens. SO, stratum oriens; pyr, pyramidal cell layer. B, D, Proportions (%) of BrdU/CTIP2 double-positive cells within the SO and pyramidal cell layer (pyr) shown by 100% stacked bar chart and dot plots. The black dots within the bar indicate the mean percentage of four (B) or three (D) brains from different litters (n = 4 or 3), and the SD is shown by the black bars. Each gray dot indicates the mean from one brain. The number of analyzed cells is shown below each graph. After calculation of mean values from each brain, group differences were analyzed by independent samples Student’s t test (B, BrdU labeling at E12.5 in the wild-type vs heterozygote, BrdU labeling at E16.5 in the wild-type vs heterozygote, and D) or Welch’s unpaired t test (B, BrdU labeling at E14.5 in the wild-type vs heterozygote). The p-values are labeled on the graph. *p < 0.05, **p < 0.01, ns (not significant) p > 0.05. Scale bar: 100 μm.


Tables
Figure number Panel Comparison Data structure: normality Data structure: homoscedasticity Type of test 95%
confidence
interval/Zp-value Fig. 2 I Rostral: wild type vs heterozygote Normal distribution Shapiro–Wilk normality test wild type: W = 0.92806, p-value = 0.5652 heterozygote: W = 0.79679, p-value = 0.05498 Equal variance F test p-value = 0.3117 Unpaired Student’s t test 12.43746 to 40.41903 0.002 Fig. 2 I Middle: wild type vs heterozygote Normal distribution Shapiro–Wilk normality test wild type: W = 0.92585, p-value = 0.5484 heterozygote: W = 0.94264, p-value = 0.6805 Equal variance F test p-value = 0.4658 Unpaired Student’s t test 10.76698 to 42.59023 0.004 Fig. 2 I Caudal: wild type vs heterozygote Normal distribution Shapiro–Wilk normality test wild type: W = 0.956, p-value = 0.7885 heterozygote: W = 0.90402, p-value = 0.3982 Equal variance F test p-value = 0.6094 Unpaired Student’s t test 13.47947 to 41.17302 0.001 Fig. 2 J Rostral: wild type vs heterozygote Normal distribution Shapiro–Wilk normality test wild type: W = 0.93972, p-value = 0.657 heterozygote: W = 0.92768, p-value = 0.5623 Equal variance F test p-value = 0.178 Unpaired Student’s t test 1.766226 to 5.743795 0.002 Fig. 2 J Middle: wild type vs heterozygote Normal distribution Shapiro–Wilk normality test wild type: W = 0.97022, p-value = 0.8939 heterozygote: W = 0.98581, p-value = 0.9765 Equal variance F test p-value = 0.3674 Unpaired Student’s t test 1.605875 to 5.699706 0.003 Fig. 2 J Caudal: wild type vs heterozygote Normal distribution Shapiro–Wilk normality test wild type: W = 0.97971, p-value = 0.9501 heterozygote: W = 0.85301, p-value = 0.1664 Equal variance F test p-value = 0.658 Unpaired Student’s t test 2.105032 to 6.101853 0.001 Fig. 2 K Rostral: wild type vs heterozygote Normal distribution Shapiro–Wilk normality test wild type: W = 0.96263, p-value = 0.8398 heterozygote: W = 0.95556, p-value = 0.7849 Equal variance F test p-value = 0.3327 Unpaired Student’s t test −203.52664 to 24.79879 0.112 Fig. 2 K Middle: wild type vs heterozygote Normal distribution Shapiro–Wilk normality test wild type: W = 0.90479, p-value = 0.403 heterozygote: W = 0.91236, p-value = 0.4521 Equal variance F test p-value = 0.9113 Unpaired Student’s t test −120.71312 to 31.80191 0.223 Fig. 2 K Caudal: wild type vs heterozygote Normal distribution Shapiro–Wilk normality test wild type: W = 0.8622, p-value = 0.1969 heterozygote: W = 0.89865, p-value = 0.366 Equal variance F test p-value = 0.2966 Unpaired Student’s t test −114.245014 to 4.374468 0.066 Fig. 3 C TBR1 (rostral): wild type vs heterozygote Normal distribution Shapiro–Wilk normality test wild type: W = 0.87838, p-value = 0.3197 heterozygote: W = 0.99953, p-value = 0.9585 Unequal variance F test p-value = 0.03097 Unpaired Welch’s t test −0.7341526 to 0.7142779 0.959 Fig. 3 C TBR1 (middle): wild type vs heterozygote Normal distribution Shapiro–Wilk normality test wild type: W = 0.95681, p-value = 0.6002 heterozygote: W = 0.89516, p-value = 0.3703 Equal variance F test p-value = 0.8262 Unpaired Student’s t test −0.7341526 to 0.7142779 0.543 Fig. 3 C TBR1 (caudal): wild type vs heterozygote Normal distribution Shapiro–Wilk normality test wild type: W = 0.92614, p-value = 0.4743 heterozygote: W = 0.85654, p-value = 0.2581 Equal variance F test p-value = 0.7396 Unpaired Student’s t test −0.7341526 to 0.7142779 0.061 Fig. 3 C RORb (rostral): wild type vs heterozygote Normal distribution Shapiro–Wilk normality test wild type: W = 0.83679, p-value = 0.2057 heterozygote: W = 0.91815, p-value = 0.4458 Equal variance F test p-value = 0.1755 Unpaired Student’s t test −0.7304762 to 0.8176759 0.845 Fig. 3 C RORb (middle): wild type vs heterozygote Normal distribution Shapiro–Wilk normality test wild type: W = 0.81895, p-value = 0.1606 heterozygote: W = 0.92359, p-value = 0.4651 Equal variance F test p-value = 0.666 Unpaired Student’s t test −0.7304762 to 0.8176759 0.870 Fig. 3 C RORB (caudal): wild type vs heterozygote Normal distribution Shapiro–Wilk normality test wild type: W = 0.85562, p-value = 0.2556 heterozygote: W = 0.98158, p-value = 0.74 Equal variance F test p-value = 0.07155 Unpaired Student’s t test −2.202504 to 1.445244 0.486 Fig. 3 C BRN2 (rostral): wild type vs heterozygote Normal distribution Shapiro–Wilk normality test wild type: W = 0.99286, p-value = 0.8385 heterozygote: W = 0.98261, p-value = 0.7474 Equal variance F test p-value = 0.7735 Unpaired Student’s t test −1.8201310 to 0.7466688 0.305 Fig. 3 C BRN2: (middle) wild type vs heterozygote Non-normal distribution Shapiro–Wilk normality test wild type: W = 0.99043, p-value = 0.8129 heterozygote: W = 0.76126, p-value = 0.02503 Equal variance F test p-value = 0.4921 Mann–Whitney U test Z = 0.65465 0.700 Fig. 3 C BRN2 (caudal): wild type vs heterozygote Normal distribution Shapiro–Wilk normality test wild type: W = 0.984, p-value = 0.7578 heterozygote: W = 0.93876, p-value = 0.5224 Equal variance F test p-value = 0.3267 Unpaired Student’s t test −2.011466 to 1.115294 0.413 Fig. 3 D TBR1 (rostral): wild type vs heterozygote Normal distribution Shapiro–Wilk normality test wild type: W = 0.99311, p-value = 0.8413 heterozygote: W = 0.8151, p-value = 0.1511 Equal variance F test p-value = 0.5543 Unpaired Welch’s t test −42.65128 to 80.04344 0.445 Fig. 3 D TBR1 (middle): wild type vs heterozygote Normal distribution Shapiro–Wilk normality test wild type: W = 0.81232, p-value = 0.1443 heterozygote: W = 0.99621, p-value = 0.8824 Equal variance F test p-value = 0.9107 Unpaired Student’s t test −2.011466 to 1.115294 0.215 Fig. 3 D TBR1 (caudal): wild type vs heterozygote Normal distribution Shapiro–Wilk normality test wild type: W = 0.99479, p-value = 0.862 heterozygote: W = 0.90284, p-value = 0.3946 Equal variance F test p-value = 0.362 Unpaired Student’s t test −77.58617 to 17.77541 0.157 Fig. 3 D RORb (rostral): wild type vs heterozygote Normal distribution Shapiro–Wilk normality test wild type: W = 0.92163, p-value = 0.4581 heterozygote: W = 0.94029, p-value = 0.5286 Equal variance F test p-value = 0.2323 Unpaired Student’s t test −101.65007 to 82.43556 0.786 Fig. 3 D RORb (middle): wild type vs heterozygote Normal distribution Shapiro–Wilk normality test wild type: W = 0.8246, p-value = 0.1747 heterozygote: W = 0.95008, p-value = 0.5697 Equal variance F test p-value = 0.8781 Unpaired Student’s t test −95.84147 to 113.25092 0.829 Fig. 3 D RORb (caudal): wild type vs heterozygote Normal distribution Shapiro–Wilk normality test wild type: W = 0.96848, p-value = 0.6591 heterozygote: W = 0.96668, p-value = 0.6494 Equal variance F test p-value = 0.9331 Unpaired Student’s t test −146.25097 to 33.68333 0.157 Fig. 3 D BRN2 (rostral): wild type vs heterozygote Normal distribution Shapiro–Wilk normality test wild type: W = 0.85, p-value = 0.2404 heterozygote: W = 0.88077, p-value = 0.3267 Equal variance F test p-value = 0.9132 Unpaired Student’s t test −259.03986 to 83.37571 0.228 Fig. 3 D BRN2: (middle) wild type vs heterozygote Normal distribution Shapiro–Wilk normality test wild type: W = 0.90474, p-value = 0.4008 heterozygote: W = 0.9984, p-value = 0.9235 Equal variance F test p-value = 0.6548 Unpaired Student’s t test −211.6771 to 138.7905 0.595 Fig. 3 D BRN2 (caudal): wild type vs heterozygote Normal distribution Shapiro–Wilk normality test wild type: W = 0.98321, p-value = 0.7518 heterozygote: W = 0.95459, p-value = 0.5899 Equal variance F test p-value = 0.7567 Unpaired Student’s t test −259.03986 to 83.37571 0.228 Fig. 4 B Rostral: wild type vs heterozygote Normal distribution Shapiro–Wilk normality test wild type: W = 0.88946, p-value = 0.3527 heterozygote: W = 0.90024, p-value = 0.3863 Equal variance F test p-value = 0.3471 Unpaired Student’s t test −0.5520192 to 0.2715238 0.398 Fig. 4 B Middle: wild type vs heterozygote Normal distribution Shapiro–Wilk normality test wild type: W = 0.97423, p-value = 0.6921 heterozygote: W = 0.77489, p-value = 0.05587 Equal variance F test p-value = 0.8878 Unpaired Student’s t test −0.9814349 to 0.2605900 0.182 Fig. 4 B Caudal: wild type vs heterozygote Normal distribution Shapiro–Wilk normality test wild type: W = 0.96518, p-value = 0.6415 heterozygote: W = 0.94166, p-value = 0.5341 Equal variance F test p-value = 0.1779 Unpaired Student’s t test −1.381734 to 0.107321 0.076 Fig. 4 C Rostral: wild type vs heterozygote Normal distribution Shapiro–Wilk normality test wild type: W = 0.98083, p-value = 0.7347 heterozygote: W = 0.99765, p-value = 0.9075 Equal variance F test p-value = 0.9134 Unpaired Student’s t test −334.0189 to 298.0080 0.882 Fig. 4 C Middle: wild type vs heterozygote Normal distribution Shapiro–Wilk normality test wild type: W = 0.83705, p-value = 0.2064 heterozygote: W = 0.95242, p-value = 0.5801 Equal variance F test p-value = 0.6733 Unpaired Student’s t test −157.30316 to 97.03834 0.547 Fig. 4 C Caudal: wild type vs heterozygote Normal distribution Shapiro–Wilk normality test wild type: W = 0.97936, p-value = 0.7246 heterozygote: W = 0.99965, p-value = 0.9645 Equal variance F test p-value = 0.9995 Unpaired Student’s t test −61.38874 to 29.16489 0.379 Fig. 5 B E12.5 BrdU -> P9 fix wild type vs heterozygote Normal distribution Shapiro–Wilk normality test wild type: W = 0.84955, p-value = 0.2247 heterozygote: W = 0.90757, p-value = 0.4696 Equal variance F test p-value = 0.06273 Unpaired Student’s t test −12.9173912 to 0.5582761 0.066 Fig. 5 B E14.5 BrdU -> P9 fix wild type vs heterozygote Non-normal distribution Shapiro–Wilk normality test wild type: W = 0.78785, p-value = 0.08216 heterozygote: W = 0.89427, p-value = 0.4031 Unequal variance F test p-value = 0.03346 Unpaired Welch’s t test −46.46305 to −18.39430 0.004 Fig. 5 B E16.5 BrdU -> P9 fix wild type vs heterozygote Normal distribution Shapiro–Wilk normality test wild type: W = 0.81206, p-value = 0.1257 heterozygote: W = 0.96273, p-value = 0.7961 Equal variance F test p-value = 0.6301 Unpaired Student’s t test −45.14384 to −13.72628 0.004 Fig. 5 D E16.5 BrdU -> P3 fix wild type vs heterozygote Normal distribution Shapiro–Wilk normality test wild type: W = 0.87183, p-value = 0.3007 heterozygote: W = 0.79291, p-value = 0.09768 Equal variance F test p-value = 0.7788 Unpaired Student’s t test −25.481745 to −5.383604 0.013 Fig. 6 F Wild type vs heterozygote (normal position) Normal distribution Shapiro–Wilk normality test wild type: W = 0.99526, p-value = 0.8685 heterozygote (normal position): W = 0.90932, p-value = 0.4158 Equal variance Bartlett test p-value = 0.0678 Tukey–Kramer test −437.8421 to 150.364845 0.398 Fig. 6 F Wild type vs heterozygote (ectopic position) Normal distribution Shapiro–Wilk normality test wild type: W = 0.99526, p-value = 0.8685 heterozygote (ectopic position): W = 0.82469, p-value = 0.09685 Equal variance Bartlett test p-value = 0.0678 Tukey–Kramer test −514.7175 to −5.315335 0.046 Fig. 6 F Heterozygote (normal position) vs heterozygote (ectopic position) Normal distribution Shapiro–Wilk normality test heterozygote (normal position): W = 0.90932, p-value = 0.4158 heterozygote (ectopic position): W = 0.82469, p-value = 0.09685 Equal variance Bartlett test p-value = 0.0678 Tukey–Kramer test −138.4233 to 370.978869 0.443 Fig. 6 G Wild type vs heterozygote (normal position) Normal distribution Shapiro–Wilk normality test wild type: W = 0.8105, p-value = 0.1398 heterozygote (normal position): W = 0.9134, p-value = 0.4295 Equal variance Bartlett test p-value = 0.3671 Tukey–Kramer test −6.306416 to 2.5699079 0.496 Fig. 6 G Wild type vs heterozygote (ectopic position) Normal distribution Shapiro–Wilk normality test wild type: W = 0.8105, p-value = 0.1398 heterozygote (ectopic position): W = 0.91542, p-value = 0.473 Equal variance Bartlett test p-value = 0.3671 Tukey–Kramer test −6.826894 to 0.8602276 0.131 Fig. 6 G Heterozygote (normal position) vs heterozygote (ectopic position) Normal distribution Shapiro–Wilk normality test heterozygote (normal position): W = 0.9134, p-value = 0.4295 heterozygote (ectopic position): W = 0.91542, p-value = 0.473 Equal variance Bartlett test p-value = 0.3671 Tukey–Kramer test −2.728482 to 4.9586403 0.707 Fig. 6 H Wild type vs heterozygote (normal position) Normal distribution Shapiro–Wilk normality test wild type: W = 0.98032, p-value = 0.7312 heterozygote (normal position): W = 0.97948, p-value = 0.7255 Unequal variance Bartlett test p-value = 0.0005376 Steel–Dwass test 1.000 Fig. 6 H Wild type vs heterozygote (ectopic position) Normal distribution Shapiro–Wilk normality test wild type: W = 0.98032, p-value = 0.7312 heterozygote (ectopic position): W = 0.92588, p-value = 0.5487 Unequal variance Bartlett test p-value = 0.0005376 Steel–Dwass test 0.256 Fig. 6 H Heterozygote (normal position) vs heterozygote (ectopic position) Normal distribution Shapiro–Wilk normality test heterozygote (normal position): W = 0.97948, p-value = 0.7255 heterozygote (ectopic position): W = 0.92588, p-value = 0.5487 Unequal variance Bartlett test p-value = 0.0005376 Steel–Dwass test 0.256 Fig. 7 E Wild type vs heterozygote Normal distribution Shapiro–Wilk normality test wild type: W = 0.98136, p-value = 0.7384 heterozygote: W = 0.82619, p-value = 0.1787 Equal variance F test p-value = 0.1953 Unpaired Student’s t test −27.896256 to 6.444708 0.158 Fig. 7 F Wild type vs heterozygote Normal distribution Shapiro–Wilk normality test wild type: W = 0.98334, p-value = 0.7528 heterozygote: W = 0.79961, p-value = 0.1136 Equal variance F test p-value = 0.5522 Unpaired Student’s t test −18.92532 to 75.37736 0.172 Fig. 7 G L1: wild type vs heterozygote Normal distribution Shapiro–Wilk normality test wild type: W = 0.89302, p-value = 0.3636 heterozygote: W = 0.89602, p-value = 0.3729 Equal variance F test p-value = 0.9608 Unpaired Student’s t test 49.88475 to 142.24042 0.004 Fig. 7 G L2: wild type vs heterozygote Normal distribution Shapiro–Wilk normality test wild type: W = 0.95785, p-value = 0.6051 heterozygote: W = 0.8297, p-value = 0.1876 Equal variance F test p-value = 0.1826 Unpaired Student’s t test −113.18916 to −22.48398 0.021 Fig. 7 H Wild type vs heterozygote Non-normal distribution Shapiro–Wilk normality test wild type: W = 0.76125, p-value = 0.02501 heterozygote: W = 0.77171, p-value = 0.0486 Mann–Whitney U test Z = −0.65465 0.700 Fig. 7 I L1: wild type vs heterozygote Normal distribution Shapiro–Wilk normality test wild type: W = 0.80732, p-value = 0.1321 heterozygote: W = 0.998, p-value = 0.9147 Equal variance F test p-value = 0.6222 Unpaired Student’s t test 2.056330 to 4.188658 0.001 Fig. 7 I L2: wild type vs heterozygote Non-normal distribution Shapiro–Wilk normality test wild type: W = 0.80371, p-value = 0.1234 heterozygote: W = 0.96722, p-value = 0.6523 Equal variance F test p-value = 0.2364 Unpaired Student’s t test −6.311426 to −0.491803 0.032 Extended Data Fig. 3-1 B Rostral: wild type vs heterozygote Non-normal distribution Shapiro–Wilk normality test wild type: W = 0.85766, p-value = 0.1813 heterozygote: W = 0.82895, p-value = 0.1053 Equal variance F test p-value = 0.7773 Unpaired Student’s t test −0.0421572482 to 0.0007444148 0.057 Extended Data Fig. 3-1 B Middle: wild type vs heterozygote Non-normal distribution Shapiro–Wilk normality test wild type: W = 0.88419, p-value = 0.2889 heterozygote: W = 0.92997, p-value = 0.5799 Equal variance F test p-value = 0.1479 Unpaired Student’s t test −0.033846035 to −0.002103765 0.030 Extended Data Fig. 3-1 B Caudal: wild type vs heterozygote Non-normal distribution Shapiro–Wilk normality test wild type: W = 0.93585, p-value = 0.6259 heterozygote: W = 0.90844, p-value = 0.4262 Equal variance F test p-value = 0.9502 Unpaired Student’s t test −0.030801905 to −0.009642128 0.002 Extended Data Fig. 3-1 C Rostral: wild type vs heterozygote Non-normal distribution Shapiro–Wilk normality test wild type: W = 0.90901, p-value = 0.4299 heterozygote: W = 0.93146, p-value = 0.5914 Unequal variance F test p-value = 0.02958 Unpaired Welch’s t test −164.72649 to 42.39315 0.199 Extended Data Fig. 3-1 C Middle: wild type vs heterozygote Non-normal distribution Shapiro–Wilk normality test wild type: W = 0.93329, p-value = 0.6057 heterozygote: W = 0.97804, p-value = 0.9414 Equal variance F test p-value = 0.1447 Unpaired Student’s t test −187.04365 to −24.62301 0.016 Extended Data Fig. 3-1 C Caudal: wild type vs heterozygote Non-normal distribution Shapiro–Wilk normality test wild type: W = 0.82064, p-value = 0.08938 heterozygote: W = 0.80381, p-value = 0.06359 Equal variance F test p-value = 0.6413 Unpaired Student’s t test −232.61149 to 44.94482 0.163 Extended Data Fig. 3-1 D Rostral: wild type vs heterozygote Non-normal distribution Shapiro–Wilk normality test wild type: W = 0.71196, p-value = 0.008242 heterozygote: W = 0.93999, p-value = 0.6591 Mann–Whitney U test Z = −0.64051 0.589 Extended Data Fig. 3-1 D Middle: wild type vs heterozygote Non-normal distribution Shapiro–Wilk normality test wild type: W = 0.87287, p-value = 0.2379 heterozygote: W = 0.94396, p-value = 0.6912 Equal variance F test p-value = 0.8054 Unpaired Student’s t test −953.6398 to 772.9249 0.820 Extended Data Fig. 3-1 D Caudal: wild type vs heterozygote Non-normal distribution Shapiro–Wilk normality test wild type: W = 0.89833, p-value = 0.3642 heterozygote: W = 0.68099, p-value = 0.003873 Mann–Whitney U test Z = −0.2445 0.853 Extended Data Fig. 3-2 TBR1: wild type vs heterozygote Non-normal distribution Shapiro–Wilk normality test wild type: W = 0.93052, p-value = 0.4906 heterozygote: W = 0.8333, p-value = 0.1967 Equal variance F test p-value = 0.3502 Unpaired Student’s t test −50.99473 to 10.79854 0.145 Extended Data Fig. 3-2 RORB: wild type vs heterozygote Non-normal distribution Shapiro–Wilk normality test wild type: W = 0.77427, p-value = 0.05444 heterozygote: W = 0.90745, p-value = 0.4096 Equal variance F test p-value = 0.1612 Unpaired Student’s t test −38.81443 to −12.39362 0.006 Extended Data Fig. 3-2 Brn2: wild type vs heterozygote Non-normal distribution Shapiro–Wilk normality test wild type: W = 0.9922, p-value = 0.8311 heterozygote: W = 0.87014, p-value = 0.2959 Equal variance F test p-value = 0.7895 Unpaired Student’s t test −57.77120 to 86.12194 0.609 Extended Data Fig. 4-1 A Wild type vs heterozygote Non-normal distribution Shapiro–Wilk normality test wild type: W = 0.97442, p-value = 0.9297 heterozygote: W = 0.77181, p-value = 0.009691 Mann–Whitney U test Z = −1.7228 0.089 Extended Data Fig. 4-1 B Wild type vs heterozygote Non-normal distribution Shapiro–Wilk normality test wild type: W = 0.96529, p-value = 0.8517 heterozygote: W = 0.85836, p-value = 0.09203 Equal variance F test p-value = 0.7867 Unpaired Student’s t test −22.37795 to 178.75553 0.119 Extended Data Fig. 4-1 C Wild type vs heterozygote Non-normal distribution Shapiro–Wilk normality test wild type: W = 0.93988, p-value = 0.5806 heterozygote: W = 0.96297, p-value = 0.8289 Equal variance F test p-value = 0.3549 Unpaired Student’s t test −20.29773 to 17.85329 0.894 Extended Data Fig. 4-1 D Wild type vs heterozygote Non-normal distribution Shapiro–Wilk normality test wild type: W = 0.90943, p-value = 0.3119 heterozygote: W = 0.96112, p-value = 0.8099 Equal variance F test p-value = 0.6479 Unpaired Student’s t test −75.85538 to 144.40307 0.519 Extended Data Fig. 4-1 E Wild type vs heterozygote Non-normal distribution Shapiro–Wilk normality test wild type: W = 0.88971, p-value = 0.1982 heterozygote: W = 0.97785, p-value = 0.9523 Equal variance F test p-value = 0.944 Unpaired Student’s t test −47.06784 to 102.62339 0.443 Extended Data Fig. 4-1 F Wild type vs heterozygote Non-normal distribution Shapiro–Wilk normality test wild type: W = 0.8859, p-value = 0.181 heterozygote: W = 0.86775, p-value = 0.1163 Equal variance F test p-value = 0.6467 Unpaired Student’s t test −244.6362 to 902.2204 0.242
Extended Data Figure 1-1
Nissl staining of the cerebral cortex at P0. Nissl-stained coronal sections of cerebral cortex from wild-type (+/+) and heterozygous yotari (+/yot) mice obtained at P0. Scale bar: 1 mm. Download Figure 1-1, EPS file.
Extended Data Figure 2-1
Schematic illustrations showing the three brain regions along the rostro-caudal axis and the 11 positions analyzed in each brain region. Schematic illustrations of the three brain regions analyzed for layer 1 and cortical wall thickness, the rostral region containing the somatosensory and auditory cortices (Rostral), middle brain region containing the visual, parietal, and auditory cortices (Middle), and the caudal brain region containing the visual and auditory cortices (Caudal). In the lower panel, the 11 positions analyzed in each brain region (A, A + 1–5, A − 1–5) are shown by dashed lines. S: somatosensory cortex; A: auditory cortex; V: visual cortex, P: parietal cortex. Download Figure 2-1, EPS file.
Extended Data Figure 3-1
The neocortical region from layer 2 to the ventricular surface of heterozygous yotari mice is expanded and the number of cells is increased but there is no change in the cell density. A, Schematic showing the dorsolateral cerebral neocortex. The measurement area was from the boundary of layer 1 (L1) and layer 2 (L2) to the ventricular surface (VS; 200-μm width, dark gray area). PS: pial surface; L6: layer 6. B–D, Sections of the rostral brain region containing the somatosensory and auditory cortex (Rostral), middle brain region containing the visual, parietal, and auditory cortex (Middle), and caudal brain region containing the visual and auditory cortex (Caudal) from six wild-type (W) and heterozygous yotari mice (He) each, all from different litters. Confocal images were then taken of the somatosensory, parietal, and visual cortex, respectively. Numbers of DAPI-positive cells within the measurement region are shown in C and cell density in D on combination dot and scatter plots. The black dots with a black bar indicate the mean and SD, respectively, and each gray dot is a raw datapoint. The total numbers of analyzed mice are shown below each graph. Statistical significance was evaluated by independent samples Student’s t test (B–D: Middle) or Mann–Whitney U test (D: Rostral and Caudal). The p-values are labeled on the graph. *p < 0.05, ** p < 0.01, ns (not significant) p > 0.05. Download Figure 3-1, EPS file.
Extended Data Figure 3-2
Heterozygous yotari mice exhibit an expanded RORB-positive cell layer compared to wild-type mice. A, Schematic illustration showing how layer thickness was defined as the distance from the 20th to 80th percentile of layer marker-positive cells. B, Thicknesses of TBR1-positive, RORB-positive, or BRN2-positive cell layers measured on coronal sections of the somatosensory (Rostral), parietal (Middle), and visual (Caudal) cortex from three wild-type (W) and three heterozygous yotari mice (He), each of different litters. The black dot and bar in the leftmost dot plot indicate the mean and SD, respectively, each gray dot indicates the mean from one brain, and each black dot in the scatter plot is a datapoint obtained from the rostral, middle, or caudal brain regions. The total number of analyzed coronal brain sections is shown at the bottom of the graph. Groups were compared by independent samples Student’s t test. The p-values are labeled on the graph. **p < 0.01, ns (not significant) p > 0.05. Download Figure 3-2, EPS file.
Extended Data Figure 4-1
There were no significant changes in number and cell density of E16.5-BrdU-labeled cells, BRN2-positive cells, and BrdU/BRN2 double-positive cells between wild-type and heterozygous yotari mice. The numbers of BrdU/BRN2 double-positive cells (A), E16.5-BrdU-labeled cells (C), and BRN2-positive cells (E) were counted in a 200-μm-wide region between the layer 1–2 boundary and ventricular surface (shown in Extended Data Fig. 3-1A). Corresponding cell densities were then calculated (B, D, F). Measurements were performed in the somatosensory (rostral), parietal (middle), and the visual (caudal) cortex of three wild-type (W) and three yotari heterozygous mice (He), each from different litters. The large black dots and black bars in the graph represent the mean and SD, respectively. The gray dots indicate the mean from one brain and each small black dot in the scatter plot is a raw datapoint obtained from the rostral, middle, or caudal brain region. The total number of analyzed brain sections is shown at the bottom of the graph. Groups were compared by Mann–Whitney U test (A) or independent samples Student’s t test (B–F). The p-values are labeled on the graph. ns (not significant) p > 0.05. Download Figure 4-1, EPS file.
In this issue


