

Article Figures & Data
Figures
- Figure 1.
Expression of IGF1R in the developing pig brain. Ai–iii, IGF1R immunoreactivity shown as density color-coded heatmaps from coronal sections of the right brain hemisphere at postnatal day 1, in the dorsal (i) and ventral (iii) hippocampus, and in PvWM (arrows; ii). Blue–green–red colors correspond to low-, middle-, and high-density IGF1R immunoreactivity, respectively. D, Dorsal; V, ventral; M, medial; L, lateral. Scale bars: Ai–iii, 5 mm; Ai–iii insets, 1 mm. CC, corpus callosum; PHC, perirhinal cortex; Sub, subiculum. Arrows (yellow) indicate clusters of cells with high levels of IGF1R expression. B, Representative confocal microscopy images of the hippocampus (Hipp) and PvWM showing IGF1R (red) and DCX (green) fluorescence labeling, which is displayed as yellow when colocalized. Arrows (white) indicate areas with double staining. Double staining of IGF1R (red) with Olig2, GFAP, or Iba1 (all green) showed no overlapping labeling. Cell nuclei were counterstained with DAPI (blue). Scale bar, 50 μm. For details about primary and secondary antibodies used for labeling, see Extended Data Fig. 1-1. For additional images and single-channel images of IGF1R, DCX and Olig2 fluorescence labeling, see Extended Data Fig. 1-2.
- Figure 2.
Exposure to IGF-1 promotes neuronal maturation in a spatiotemporal manner. A, Representative image of NeuN/hematoxylin-labeled section illustrating the selected regions of interest analyzed in the study, including IGWM, cingulate, parietal, temporal, and perirhinal cortexes. D, Dorsal; V, ventral, M; medial, L; lateral. Insert, Enlarged ventral hippocampal area with the following delineated subregions selected for analysis: perirhinal cortex, CA1, CA3, granular cell layer (GCL), and hilus. The subiculum separates the hippocampus from the entorhinal cortex. B, Quantification of the intensity of NeuN-IR in cortical subregions at P5 and P9, respectively. C, Representative images of NeuN/hematoxylin-labeled dentate gyrus on P9 from pigs treated with vehicle (CON) or IGF-1. Scale bar, 200 μm. D, Quantification of the intensity of NeuN-IR in hippocampal subregions (average of ventral and dorsal) at P5 and P9. DG, Granular cell layer of DG; Sub, subiculum. E, Left, Quantification of the intensity of DCX-IR in subregions of the ventral hippocampus at P5. n = 11–12/age and treatment group. Right, Representative images of DCX/hematoxylin-labeled dentate gyrus on P5 from pigs treated with vehicle (CON) or IGF-1. Scale bar, 100 μm. Values are presented as the mean ± SEM. All data were analyzed using a linear model for each time point. Statistically significant effects of treatment are shown as follows: *p < 0.05, **p < 0.01, ***p < 0.001.
- Figure 3.
IGF-1 treatment is significantly associated with decreased synaptophysin expression on P9, when synaptophysin levels are no longer correlated with birth weight. A, Quantification of synaptophysin-IR in the total cortex area (average of temporal, cingulate, parietal, and entorhinal cortex) and hippocampus proper (Hipp; average of dorsal and ventral CA1, CA3 (plus pyramidal layer), dentate gyrus molecular layer plus subgranular zone, hilus, and ventral subiculum quantification) on P5 and P9. n = 11–12/age and treatment group. Values are presented as the mean ± SEM. Data were analyzed using a linear model for each time point and for each treatment group. Statistically significant effects of treatment or time are shown as follows: *p < 0.05; **p < 0.01. B, Representative images of synaptophysin/hematoxylin-labeled dentate gyrus on P5 and P9 from pigs treated with IGF-1. Scale bar, 100 μm. C, D, Correlation between birth weight and synaptophysin-IR on P5 (green) and P9 (purple) in the cortex and hippocampus proper (C), and in hippocampal subregions CA3, granular cell layer of DG, and hilus (D); data from hippocampal regions are the average of dorsal and ventral quantifications. Correlation data were analyzed by Pearson R correlation analysis; p < 0.05 is considered statistically significant. ns, Nonsignificant.
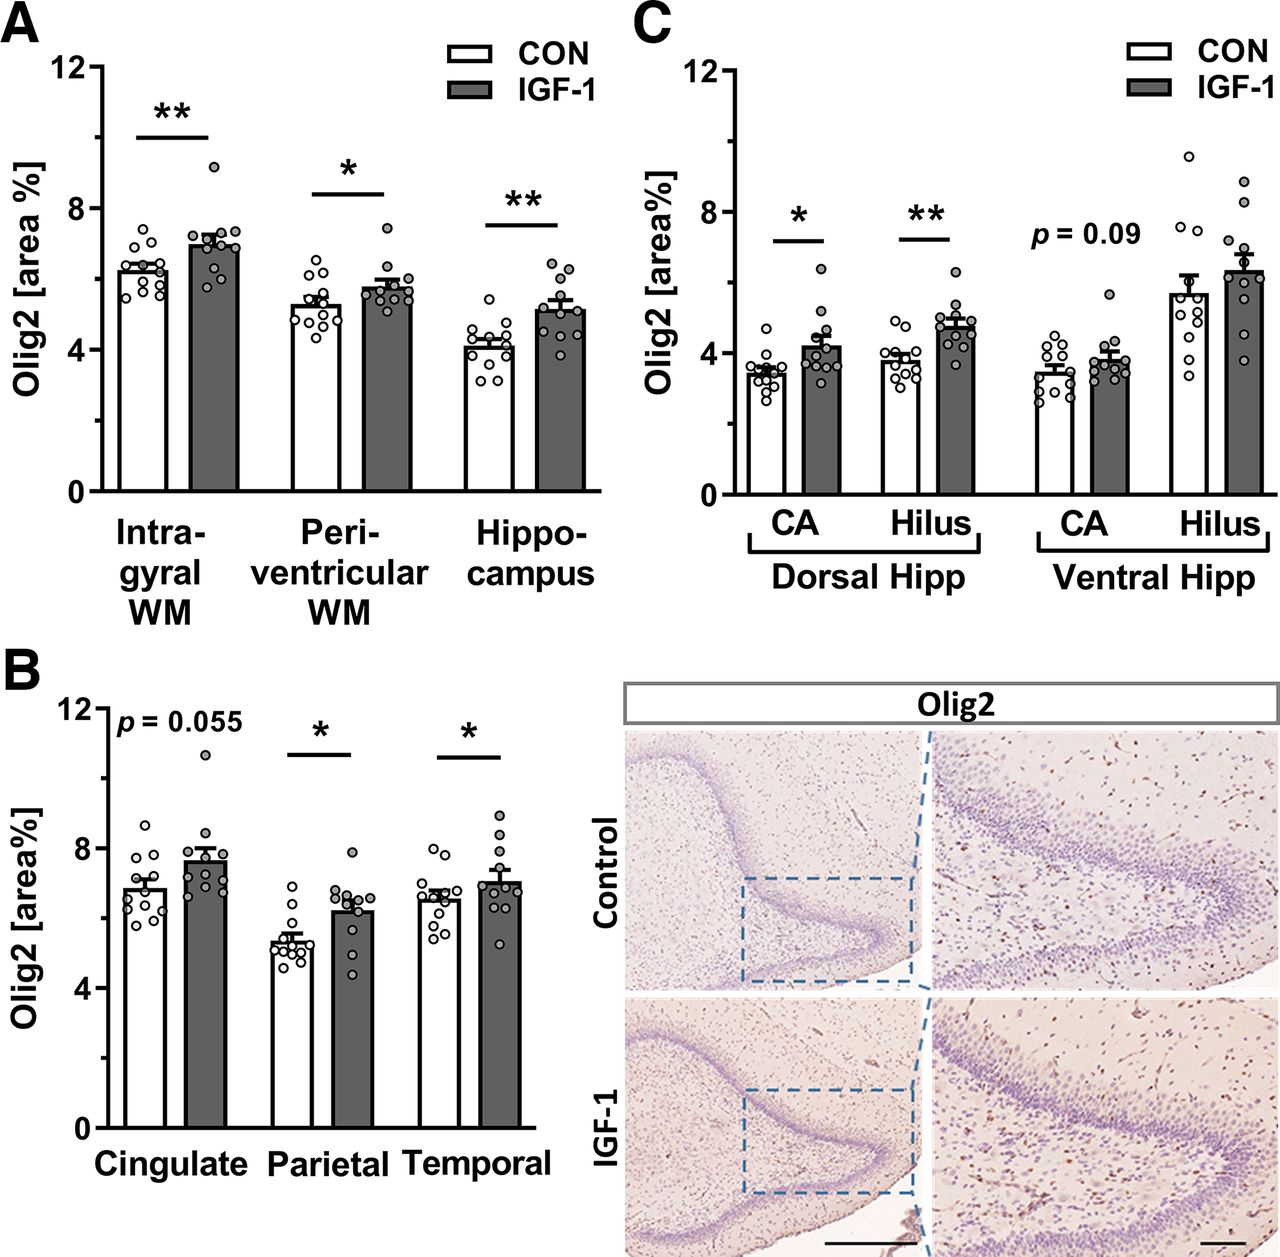
- Figure 4.
Continuous exposure to systemic IGF-1 promotes oligodendrocyte development. A–C, Quantification of the area of Olig2+-IR on P5 in IGWM (average of temporal, cingulate, and parietal subcortical tracts), PvWM, hippocampus proper (average of dorsal and ventral CA and hilus quantification; A), in different WM subcortical tracts (B, left), and in separate dorsal and ventral hippocampal total CA and hilar region at P5 (C). n = 11–12/treatment group. Data are given as the mean ± SEM. All data were analyzed using a linear model for each time point; statistically significant effects of treatment are shown as *p < 0.05, **p < 0.01. B, Right, Representative images of Olig2 labeling in the dentate gyrus of control and IGF-1-treated pigs at P5. Scale bars: left, 500 μm; right, 100 μm. Sections were counterstained with hematoxylin. For the effect of IGF-1 treatment on Olig2+ cell number and on the level of Olig2 on postnatal day 9, see Extended Data Figure 4-1.
- Figure 5.
Treatment with IGF-1 promotes myelination of fiber tracts in preterm pigs. A, Representative images of the posterior cingulate cortex on P9 at low magnification (left; scale bar, 1 mm) and high magnification (right; scale bar, 100 μm), immunostained for MBP and counterstained with hematoxylin. Preterm-born pigs were treated with either vehicle (Control; top panel) or IGF-1 (bottom panel). CC, Corpus callosum. B, Quantification of myelination in three intragyral white matter regions: cingulate (Cing), parietal and temporal (temperature) cortices on P5 and P9. CON, n = 12; IGF-1, n = 11. Data are given as the mean ± SEM. All data were analyzed using a linear model for each time point. Statistically significant effects of treatment are shown as *p < 0.05, **p < 0.01, ***p < 0.001.
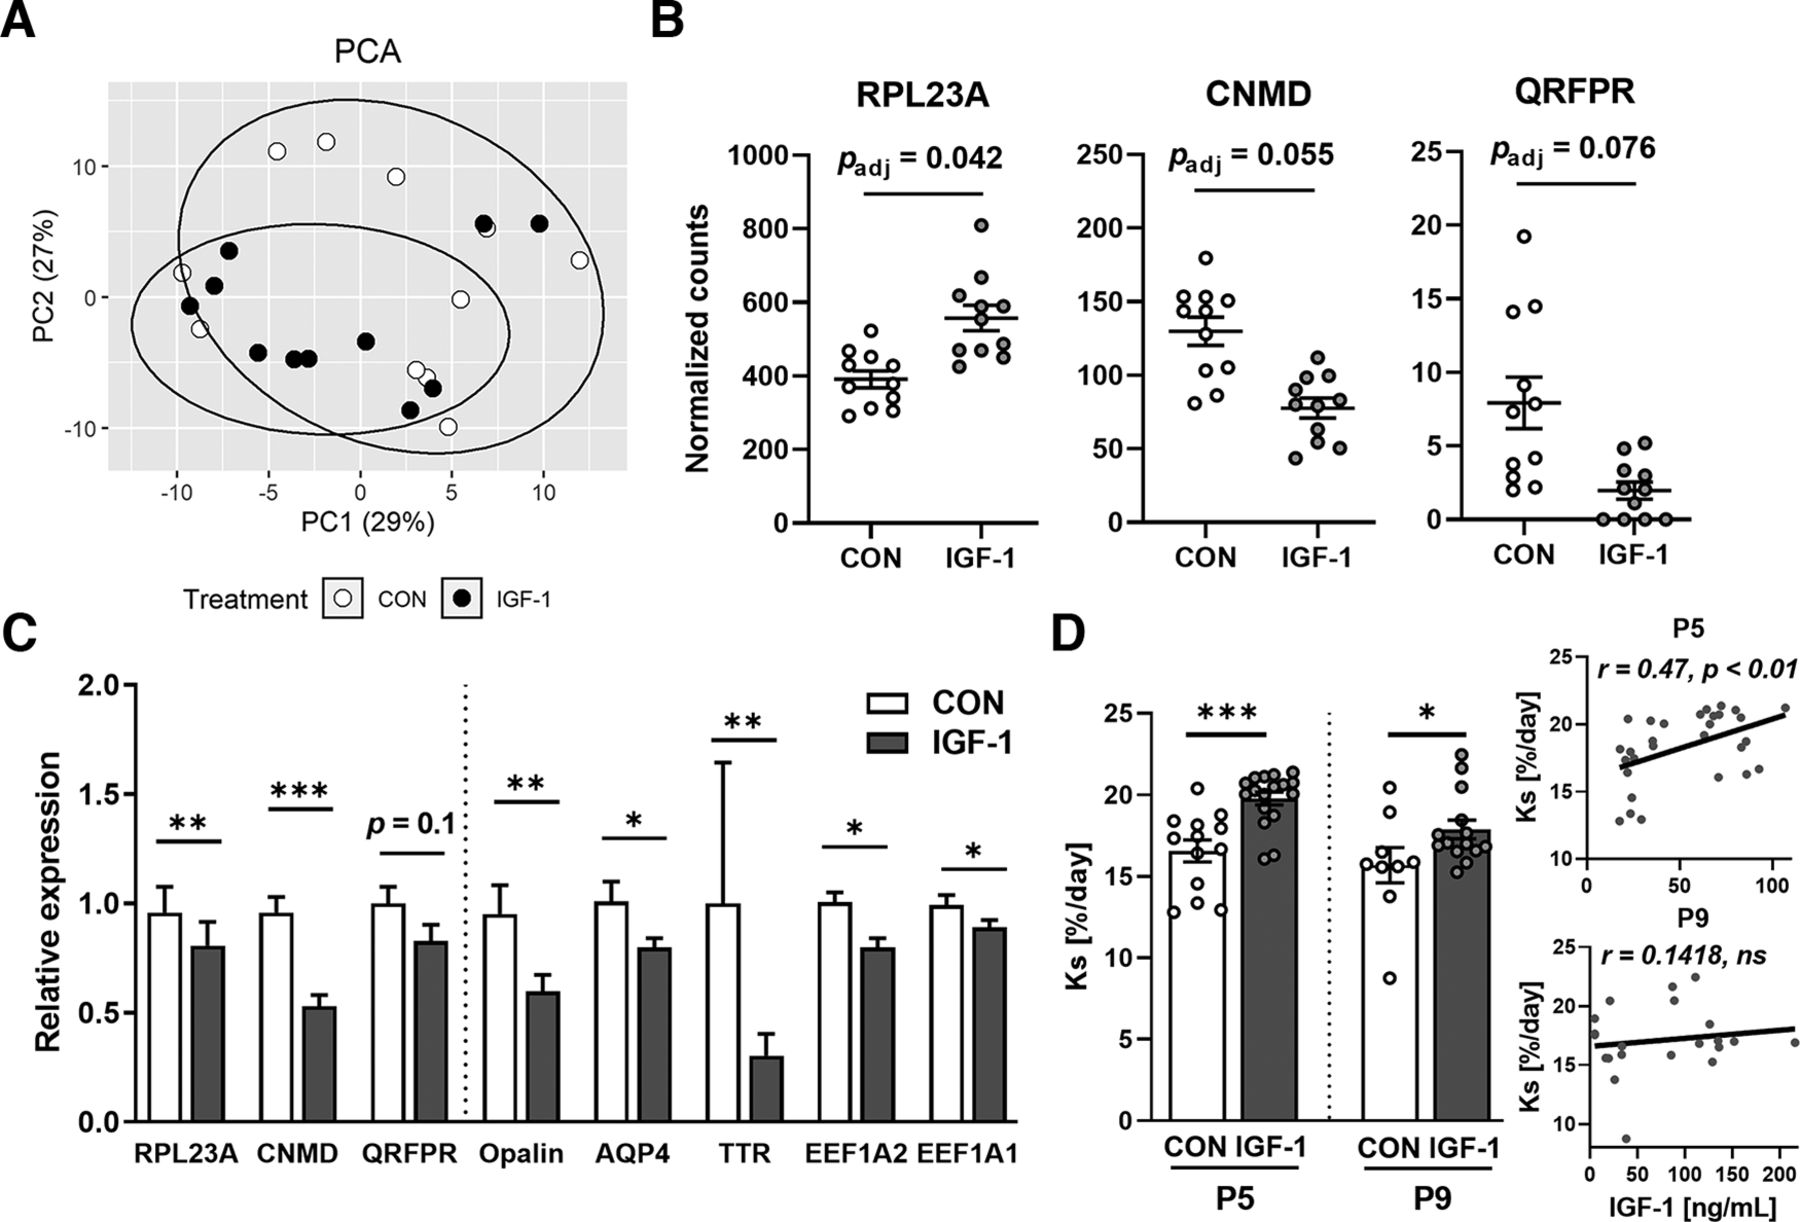
- Figure 6.
Hippocampal transcriptome profile in response to IGF-1 treatment. A, PCA plot demonstrating marginal segregation of hippocampal gene expression in the CON and IGF-1 groups at P5. B, Boxplot of three significant differentially expressed genes between CON and IGF-1. n = 11/treatment group. C, Relative expression (fold change compared with CON) of selected genes in the hippocampus of P5 pigs analyzed by qPCR. n = 11–13/treatment group. D, Left, Ks values (percentage of protein mass synthesized per day) in the cerebellum measured in the CON and IGF-1 groups at P5 and P9. D, Right, Correlation between Ks and plasma IGF-1 levels at P5 and P9. In B–D, results are presented as the mean ± SEM. Data were analyzed using a principal component analysis (A), DESeq2 (B), using a linear model for each time point (C, D, right), or Pearson R correlation (D, left), a Benjamini–Hochberg correction was applied in B; in C and D, statistically significant effects of treatment are shown as *p < 0.05, **p < 0.01, ***p < 0.001. ns, Nonsignificant. For qPCR primer list, see Extended Data Figure 6-1. For detailed RNA-sequencing results, see Extended Data Figure 6-2. For the effect of IGF-1 treatment on the expression of genes related to IGF-1 signaling and gene expression on P9, see Extended Data Figure 6-3A–C. For details on Iba-1 labeling, see Extended Data Figure 6-3D–F.


Tables
Parameter Unit Control (n = 9) IGF-1 (n = 12) p Mean velocity cm/s 5.92 ± 1.33 6.38 ± 1.02 0.73 Distance traveled cm 708.28 ± 159.34 762.13 ± 121.27 0.74 Time moving s 78.59 ± 9.70 79.17 ± 6.99 0.89 Time not moving s 41.16 ± 9.72 40.47 ± 7.09 0.85 Time in center % 45.16 ± 9.74 27.47 ± 9.47 0.48 Time in border area % 54.84 ± 9.74 72.53 ± 9.47 0.48 Time in zone LB % 1.09 ± 1.09 8.98 ± 3.06 0.10 Time in zone LT % 9.27 ± 4.77 13.50 ± 4.11 0.60 Time in zone RT % 3.62 ± 2.47 5.43 ± 2.90 0.70 Time in zone RB % 2.59 ± 1.57 2.20 ± 1.17 0.86 Results are presented as the mean ± SEM and analyzed using a linear model. For detailed outline of the open field test, including a schematic overview of the arena, the percentage of animals able to stand and included in the test, representative heatmaps of cumulative tracking in the arena, and correlation between neuromotor score and birth weight, see Extended Data Table 1-1.
CON IGF-1 p P5 P9 P5 P9 P5 P9 Number of animals 17
(F/M, 6/11)21
(F/M, 10/11)18
(F/M, 8/10)21
(F/M, 13/8)Total body weight (g) 1046.3 ± 58.75 1203.33 ± 65.89 994.17 ± 64.96 1285.81 ± 82.36 0.53 0.133 Total brain (g) 26.58 ± 0.40 30.04 ± 0.48 26.50 ± 0.44 30.23 ± 0.47 0.55 0.79 Total brain (%) 2.66 ± 0.14 2.63 ± 0.13 2.83 ± 0.16 2.52 ± 0.14 0.29 0.33 Cerebrum (g) 20.93 ± 0.30 24.44 ± 0.40 20.93 ± 0.35 24.64 ± 0.42 0.62 0.72 Cerebrum (%) 78.77 ± 0.53 81.36 ± 0.16 79.01 ± 0.36 81.46 ± 0.2 0.85 0.50 Cerebellum (g) 2.47 ± 0.07 2.72 ± 0.06 2.35 ± 0.05 2.75 ± 0.04 0.35 0.77 Cerebellum (%) 9.27 ± 0.21 9.04 ± 0.08 8.86 ± 0.07 9.1 ± 0.12 0.14 0.77 Hippocampus (g) 0.44 ± 0.02 0.50 ± 0.01 0.46 ± 0.01 0.51 ± 0.01 0.33 0.36 Hippocampus (%) 1.67 ± 0.06 1.65 ± 0.04 1.76 ± 0.05 1.69 ± 0.03 0.40 0.37 Brainstem (g) 2.622 ± 0.1 2.88 ± 0.05 2.58 ± 0.06a 2.85 ± 0.05 0.42 0.46 Brainstem (%) 9.85 ± 0.32 9.60 ± 0.15 9.79 ± 0.20a 9.44 ± 0.11 0.48 0.23 Striatum (g) 0.24 ± 0.01 0.31 ± 0.01 0.23 ± 0.01 0.31 ± 0.01 0.21 0.58 Striatum (%) 0.90 ± 0.04 1.03 ± 0.03 0.86 ± 0.05 1.04 ± 0.03 0.15 0.59 Water content (%) 84.86 ± 0.08 85.20 ± 0.09 85.02 ± 0.07 85.02 ± 0.08 0.20 0.19 Brain/liver ratio 0.918 ± 0.057 0.640 ± 0.031 1 ± 0.07 0.65 ± 0.04 0.16 0.98 Relative values (%) are the weight of a brain region relative to the total brain weight or total brain weight relative to body weight. Results are presented as the mean ± SEM and were analyzed using a linear model for each time point. F, Female; M, male.
↵a n = 17.
Figure 1-1
List of primary and secondary antibodies, dilutions, and supplier information. Download Figure 1-1, DOCX file.
Figure 1-2
Representative confocal microscopy images illustrating the expression of IGF1R. A, Images illustrate the localization of IGF1R (red) and DCX (green) labeling in the hippocampus at birth (P1). Bi–iv, At P9, the colocalization (yellow) of IGF1R (green) and DCX (red) was still observed in hippocampal CA3 (Bii) and neuronal progenitor cell clusters (Bi,iii), while faint colocalization was observed in cellular clusters located within PvWM (Biv). C, Representative confocal microscope images showing IGF1R (red) expression in the hippocampus (Hipp), PvWM, WM, and cortical regions. Cell nuclei were counterstained with DAPI (blue). Scale bar, 10 μm. Download Figure 1-2, TIF file.
Table 1-1
Open-field test at postnatal day 7. A, Location and annotation of virtual zones in the open field arena, LT, RT, RB, and LB. B, The number of animals able to stand at postnatal day 7 was not different between the CON (n = 16) and IGF-1 groups (n = 18). C, To illustrate the cumulative tracks of pigs in the arena over 4 min for the IGF-1 and control groups, two representative open field heatmaps are shown for each group. Blue to red indicates low to high occupancy. D, Correlation between birth weight and neuromotor score at postnatal day 7. Correlation data were analyzed by Pearson R correlation analysis, p < 0.05 is considered statistically significant. Download Table 1-1, TIF file.
Figure 4-1
A, Quantification of the number of Olig2+ cells in the IGWM (average of temporal, cingulate, and parietal subcortical tracts), PvWM, CA, and hilar region (both average of respective dorsal and ventral hippocampal quantifications) of the hippocampus at postnatal day 5. CON, n = 12; IGF-1, n = 11. B, C, Quantification of the area of Olig2+-IR (B) and the number of Olig2+ cells (C) on postnatal day 9 in the PvWM, IGWM (average of temporal, cingulate, and parietal subcortical tracts), dorsal and ventral CA, and hilus of the hippocampus (Hipp). All results are expressed as the mean ± SEM. All data were analyzed using a linear model for each time point; statistically significant effects of treatment are shown as *p < 0.05. Download Figure 4-1, TIF file.
Figure 6-1
List of primers for qPCR. F, Forward primer; R, reverse primer; ¤, primers for these genes were adopted from Pan et al. (2012). Download Figure 6-1, DOCX file.
Figure 6-2
DEGs between the control and IGF-1 groups at postnatal day 5 identified by RNA-seq analysis. Listed are all identified porcine genes with corresponding location, the (base 2) log of the fold change, the uncorrected p value and FDR-adjusted p value (padj). Download Figure 6-2, XLS file.
Figure 6-3
A, C, Relative expression (fold change compared with CON) of selected genes (A) and genes related to IGF-1 signaling in the hippocampus on P9 analyzed by qPCR (C). n = 7–8/treatment group. B, Relative expression (fold change compared to CON) of genes related to IGF-1 signaling in the hippocampus of P5 pigs analyzed by qPCR. n = 11–13/treatment group. D, Representative images of Iba1/hematoxylin-labeled dentate gyrus on P5 from pigs treated with vehicle (CON) or IGF-1. Scale bars: D, 100 μm; inset, 10 μm. E, F, Quantification of the area of Iba1-IR on P5 (E) and P9 (F) in the PvWM, cortex, dentate gyrus (dorsal + ventral), hilus (dorsal + ventral), and subiculum. All results are expressed as the mean ± SEM. All data were analyzed using a linear model for each time point. Download Figure 6-3, TIF file.
In this issue


