
Main menu

  • HOME
  • CONTENT
    • Early Release
    • Featured
    • Current Issue
    • Issue Archive
    • Blog
    • Collections
    • Podcast
  • TOPICS
    • Cognition and Behavior
    • Development
    • Disorders of the Nervous System
    • History, Teaching and Public Awareness
    • Integrative Systems
    • Neuronal Excitability
    • Novel Tools and Methods
    • Sensory and Motor Systems
  • ALERTS
  • FOR AUTHORS
  • ABOUT
    • Overview
    • Editorial Board
    • For the Media
    • Privacy Policy
    • Contact Us
    • Feedback
  • SUBMIT

User menu

Search

  • Advanced search
eNeuro
eNeuro

Advanced Search


  • HOME
  • CONTENT
    • Early Release
    • Featured
    • Current Issue
    • Issue Archive
    • Blog
    • Collections
    • Podcast
  • TOPICS
    • Cognition and Behavior
    • Development
    • Disorders of the Nervous System
    • History, Teaching and Public Awareness
    • Integrative Systems
    • Neuronal Excitability
    • Novel Tools and Methods
    • Sensory and Motor Systems
  • ALERTS
  • FOR AUTHORS
  • ABOUT
    • Overview
    • Editorial Board
    • For the Media
    • Privacy Policy
    • Contact Us
    • Feedback
  • SUBMIT
PreviousNext
Research ArticleResearch Article: New Research, Sensory and Motor Systems

Different Control Strategies Drive Interlimb Differences in Performance and Adaptation during Reaching Movements in Novel Dynamics

David Córdova Bulens, Tyler Cluff, Laurent Blondeau, Robert T. Moore, Philippe Lefèvre and Frédéric Crevecoeur
eNeuro 20 March 2023, 10 (4) ENEURO.0275-22.2023; https://doi.org/10.1523/ENEURO.0275-22.2023
David Córdova Bulens
1School of Electrical and Electronic Engineering, University College Dublin, Dublin, D04 V1W8, Republic of Ireland
  • Find this author on Google Scholar
  • Find this author on PubMed
  • Search for this author on this site
Tyler Cluff
2Faculty of Kinesiology, Hotchkiss Brain Institute, University of Calgary, Calgary, Alberta, T2N 1N4, Canada
  • Find this author on Google Scholar
  • Find this author on PubMed
  • Search for this author on this site
Laurent Blondeau
3Institute of Information and Communication Technologies, Electronics and Applied Mathematics (ICTEAM), Université Catholique de Louvain, Louvain-la-Neuve, 1348, Belgium
  • Find this author on Google Scholar
  • Find this author on PubMed
  • Search for this author on this site
Robert T. Moore
4Cumming School of Medicine, Hotchkiss Brain Institute, University of Calgary, Calgary, Alberta, T2N 1N4, Canada
  • Find this author on Google Scholar
  • Find this author on PubMed
  • Search for this author on this site
  • ORCID record for Robert T. Moore
Philippe Lefèvre
3Institute of Information and Communication Technologies, Electronics and Applied Mathematics (ICTEAM), Université Catholique de Louvain, Louvain-la-Neuve, 1348, Belgium
5Institute of Neuroscience (IoNS), Université Catholique de Louvain, Brussels, 1200, Belgium
  • Find this author on Google Scholar
  • Find this author on PubMed
  • Search for this author on this site
Frédéric Crevecoeur
3Institute of Information and Communication Technologies, Electronics and Applied Mathematics (ICTEAM), Université Catholique de Louvain, Louvain-la-Neuve, 1348, Belgium
5Institute of Neuroscience (IoNS), Université Catholique de Louvain, Brussels, 1200, Belgium
  • Find this author on Google Scholar
  • Find this author on PubMed
  • Search for this author on this site
  • ORCID record for Frédéric Crevecoeur
  • Article
  • Figures & Data
  • Info & Metrics
  • eLetters
  • PDF
Loading

Article Figures & Data

Figures

  • Figure 1.
    • Download figure
    • Open in new tab
    • Download powerpoint
    Figure 1.

    Illustration of the workspace, events during the task, and force field. A, 3D view of the experimental setup and participant’s position. B, Participants were instructed to perform forward reaching movements toward a visual target that was presented in front of either the left or the right arm, with each arm having its own home and goal target. C, The force field for experiment 1 had a clockwise direction for the right arm (orange line) and was mirrored for the left arm, hence directing the arm toward the exterior direction. D, Events happening during a trial for the left and the right arm. An open goal target was presented for a random period, uniformly distributed between 2 and 4 s, before it was filled in. The cue to reach the target was provided by filling the goal target in red. If the participant reached the target in a time comprised between 0.6 and 0.8 s, the goal target was filled in a green color to indicate a good trial and red if the target was reached too slowly.

  • Figure 2.
    • Download figure
    • Open in new tab
    • Download powerpoint
    Figure 2.

    First and last trajectories for the force field perturbed trials, the evolution of parameters across all trials, and histograms of the learning rate of path length and maximal deviation. A, First and last force field trials for the left arm (green line) and the right arm (orange line) of participants. B, Mean and Standard Error of the Mean (SEM) of Path length (PL), maximal deviation (MD), maximum speed (MS), and maximum force (MF) across perturbed trials of experiment 1 for the right arm (orange line) and the left arm (green line). C, Bootstrapping results of the learning rate (parameter b2 in Eq. 2) of the path length and maximal deviation for the left and right arm of all force field trials and all participants.

  • Figure 3.
    • Download figure
    • Open in new tab
    • Download powerpoint
    Figure 3.

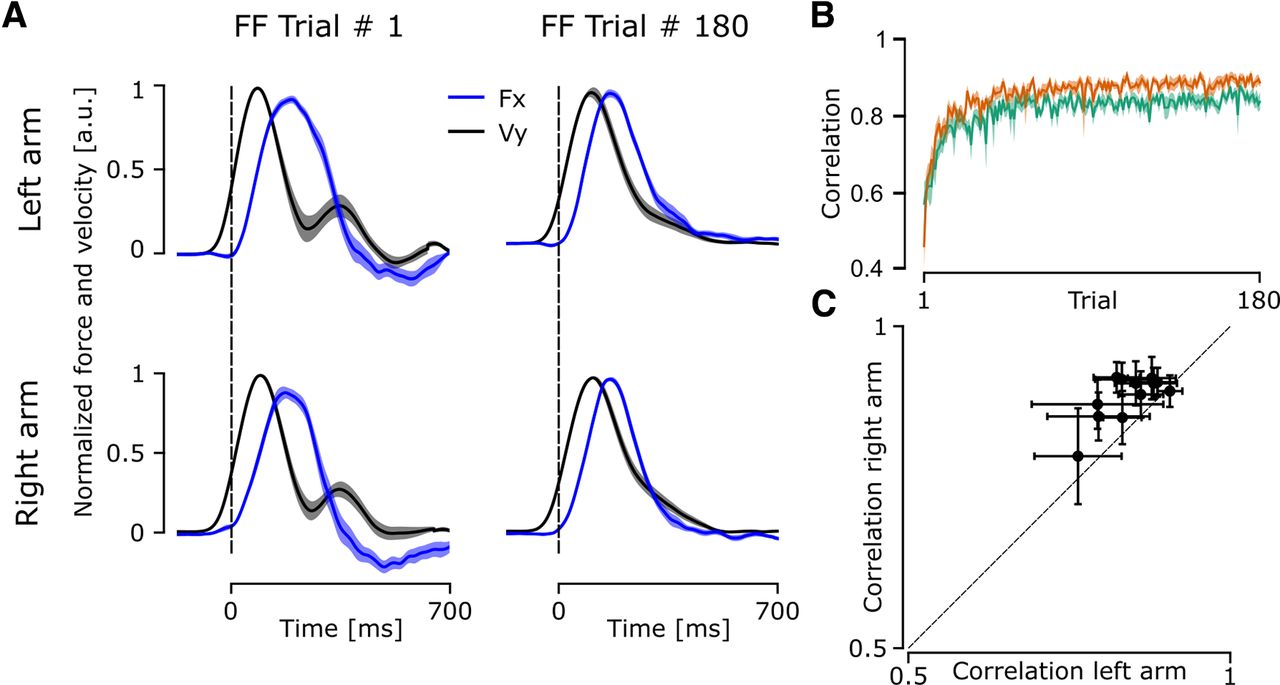
    Correlation between the force exerted by participants on the handle of the robotic arm and the force exerted by the robot on the participants’ arms. A, The mean and SEM of the normalized x force applied by the participant on the handle (blue line) and the normalized y velocity of the reaching movement (black line) for the first and last perturbed trials. The force and velocity were normalized to their peak value and averaged across all participants. B, Mean and SEM of the correlation between force and velocity across all perturbed trials for the left arm (green) and the right arm (orange). C, Correlation average for the final 20 trials for the left and the right arm of each participant (black dots), horizontal and vertical error bars represent the standard deviations of the correlation of the left arm and the right arm, respectively.

  • Figure 4.
    • Download figure
    • Open in new tab
    • Download powerpoint
    Figure 4.

    Trajectories of first and last catch trials of experiment 1 for all participants and mean maximal deviation, path length, and maximum speed of participants across all catch trials of experiment 1. The left arm is presented using a green color across all panels and the right arm is presented using orange color. In panels B–D, the global average for each arm is presented as a black dot. A, Trajectories of the first and last catch trials for all participants. B, Maximal deviation across all catch trials. C, Path length across all catch trials. D, Maximum speed across all catch trials.

  • Figure 5.
    • Download figure
    • Open in new tab
    • Download powerpoint
    Figure 5.

    Evolution of extracted parameters in the null field trials in experiment 2. A, Mean and SEM of the path length, maximal deviation, and maximal speed of the reaching trajectories for the left arm (green line) and the right arm (orange line) across all trials. The gray zone indicates baseline trials without force field trials. B, Mean MS and MD for baseline trials and trials following force field trials for each participant. The x-axis shows the index of the trials after a force field trial.

  • Figure 6.
    • Download figure
    • Open in new tab
    • Download powerpoint
    Figure 6.

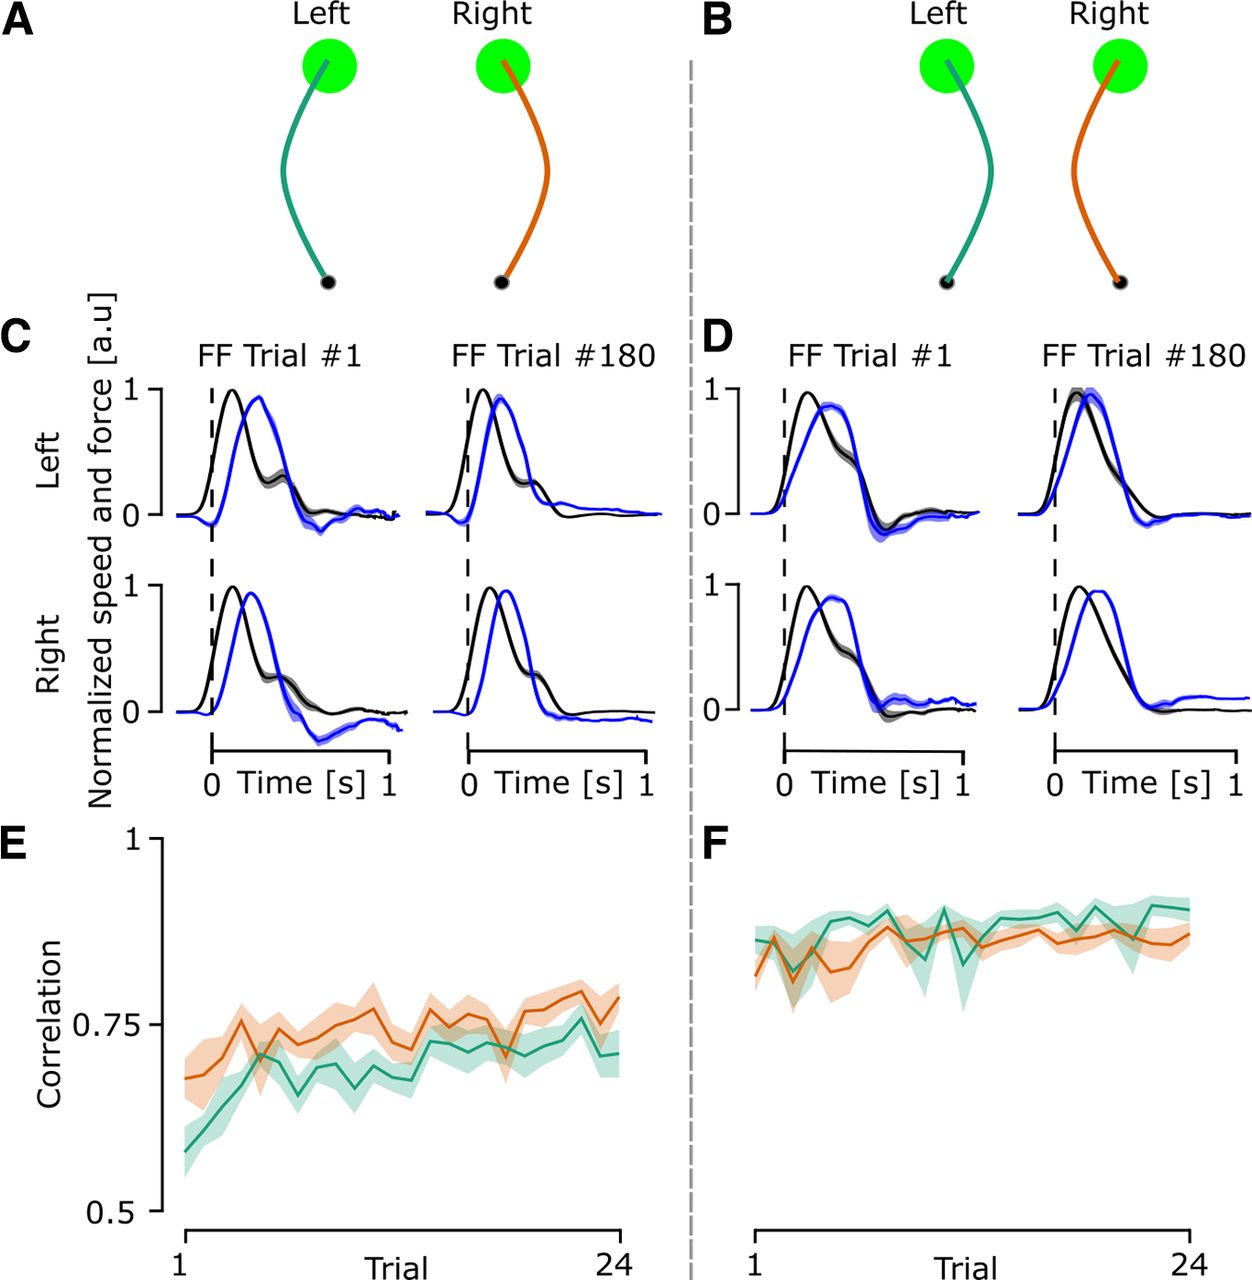
    Outputs of the force field trials of experiment 2. A, Representative traces for outward force field trials for the left arm (green line) and the right arm (orange line). The hand paths shown in the figure are for demonstration purposes and do not represent real data. B, Representative traces for inward force field trials for the left arm (green line) and the right arm (orange line). C, The mean and SEM of the normalized x force applied by the participant on the handle (blue line) and the normalized y velocity (black line) of the outward force field trials reaching movements for the first and last perturbed trials. The force and velocity were normalized to their peak value and averaged across all participants. D, The mean and SEM of the normalized x force applied by the participant on the handle (blue line) and the normalized y velocity (black line) of the inward force field trials reaching movements for the first and last perturbed trials. E, Mean and SEM of the correlation between force and velocity across all perturbed trials for the left arm (green) and the right arm (orange) for outward force field trials. F, Mean and SEM of the correlation between force and velocity across all perturbed trials for the left arm (green) and the right arm (orange) for inward force field trials.

  • Figure 7.
    • Download figure
    • Open in new tab
    • Download powerpoint
    Figure 7.

    Mean and SEM of normalized EMG of the posterior deltoid and the pectoralis major averaged across all participants for the right arm (orange line) and the left arm (green line). The mean EMG for both muscle groups was computed in a 100-ms window before movement onset (the gray region in the plot). A, Mean and SEM of the normalized EMG of the 10 first and 10 last force field trials in experiment 1. B, Mean and SEM of the normalized EMG of the 10 first baseline trials and 10 last null field trials after the introduction of force field trials in experiment 2.

Back to top

In this issue

eneuro: 10 (4)
eNeuro
Vol. 10, Issue 4
April 2023
  • Table of Contents
  • Index by author
  • Masthead (PDF)
Email

Thank you for sharing this eNeuro article.

NOTE: We request your email address only to inform the recipient that it was you who recommended this article, and that it is not junk mail. We do not retain these email addresses.

Enter multiple addresses on separate lines or separate them with commas.
Different Control Strategies Drive Interlimb Differences in Performance and Adaptation during Reaching Movements in Novel Dynamics
(Your Name) has forwarded a page to you from eNeuro
(Your Name) thought you would be interested in this article in eNeuro.
CAPTCHA
This question is for testing whether or not you are a human visitor and to prevent automated spam submissions.
Print
View Full Page PDF
Citation Tools
Different Control Strategies Drive Interlimb Differences in Performance and Adaptation during Reaching Movements in Novel Dynamics
David Córdova Bulens, Tyler Cluff, Laurent Blondeau, Robert T. Moore, Philippe Lefèvre, Frédéric Crevecoeur
eNeuro 20 March 2023, 10 (4) ENEURO.0275-22.2023; DOI: 10.1523/ENEURO.0275-22.2023

Citation Manager Formats

  • BibTeX
  • Bookends
  • EasyBib
  • EndNote (tagged)
  • EndNote 8 (xml)
  • Medlars
  • Mendeley
  • Papers
  • RefWorks Tagged
  • Ref Manager
  • RIS
  • Zotero
Respond to this article
Share
Different Control Strategies Drive Interlimb Differences in Performance and Adaptation during Reaching Movements in Novel Dynamics
David Córdova Bulens, Tyler Cluff, Laurent Blondeau, Robert T. Moore, Philippe Lefèvre, Frédéric Crevecoeur
eNeuro 20 March 2023, 10 (4) ENEURO.0275-22.2023; DOI: 10.1523/ENEURO.0275-22.2023
Twitter logo Facebook logo Mendeley logo
  • Tweet Widget
  • Facebook Like
  • Google Plus One

Jump to section

  • Article
    • Abstract
    • Significance Statement
    • Introduction
    • Materials and Methods
    • Results
    • Discussion
    • Acknowledgments
    • Footnotes
    • References
    • Synthesis
  • Figures & Data
  • Info & Metrics
  • eLetters
  • PDF

Keywords

  • adaptation
  • reaching
  • robust control

Responses to this article

Respond to this article

Jump to comment:

No eLetters have been published for this article.

Related Articles

Cited By...

More in this TOC Section

Research Article: New Research

  • Robust representation and nonlinear spectral integration of harmonic stacks in layer 4 of mouse primary auditory cortex
  • Changes in palatability processing across the estrous cycle are modulated by hypothalamic estradiol signaling
  • Transcranial Static Magnetic Stimulation Dissociates the Causal Roles of the Parietal Cortex in Spatial and Temporal Processing
Show more Research Article: New Research

Sensory and Motor Systems

  • Robust representation and nonlinear spectral integration of harmonic stacks in layer 4 of mouse primary auditory cortex
  • Changes in palatability processing across the estrous cycle are modulated by hypothalamic estradiol signaling
  • Automatic, but not autonomous: Implicit adaptation is modulated by goal-directed attentional demands
Show more Sensory and Motor Systems

Subjects

  • Sensory and Motor Systems
  • Home
  • Alerts
  • Follow SFN on BlueSky
  • Visit Society for Neuroscience on Facebook
  • Follow Society for Neuroscience on Twitter
  • Follow Society for Neuroscience on LinkedIn
  • Visit Society for Neuroscience on Youtube
  • Follow our RSS feeds

Content

  • Early Release
  • Current Issue
  • Latest Articles
  • Issue Archive
  • Blog
  • Browse by Topic

Information

  • For Authors
  • For the Media

About

  • About the Journal
  • Editorial Board
  • Privacy Notice
  • Contact
  • Feedback
(eNeuro logo)
(SfN logo)

Copyright © 2026 by the Society for Neuroscience.
eNeuro eISSN: 2373-2822

The ideas and opinions expressed in eNeuro do not necessarily reflect those of SfN or the eNeuro Editorial Board. Publication of an advertisement or other product mention in eNeuro should not be construed as an endorsement of the manufacturer’s claims. SfN does not assume any responsibility for any injury and/or damage to persons or property arising from or related to any use of any material contained in eNeuro.