

Article Figures & Data
Figures
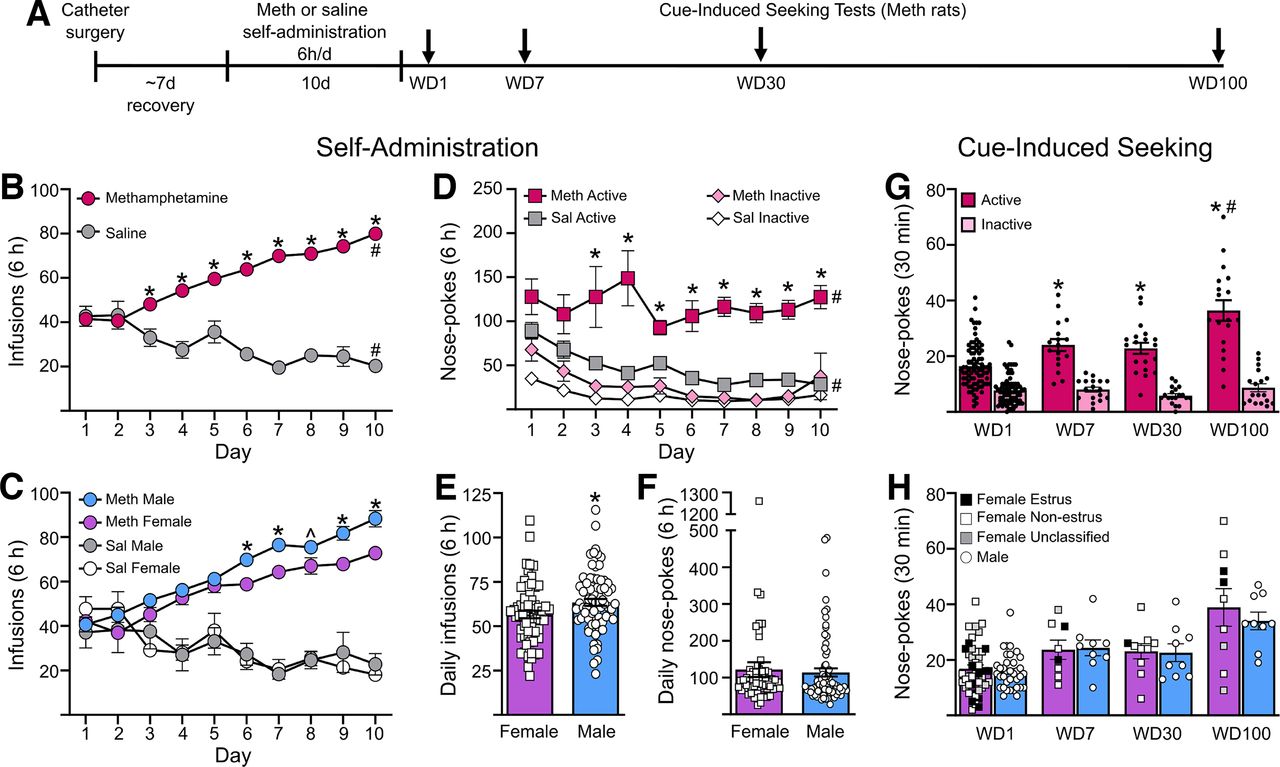
- Figure 1.
Methamphetamine self-administration and incubation of craving in male and female rats. A, Rats were trained to self-administer methamphetamine (Meth) or saline (Sal) for 6 h/d for 10 d. Each Meth rat underwent a single cue-induced seeking test on either withdrawal day (WD) 1, WD7, WD30, or WD100. At least a week after the test, many of the Meth rats, along with the saline rats, were used for electrophysiological recordings. B, Average infusions during self-administration training for methamphetamine (n = 136) and saline (n = 17) rats. *p < 0.05 compared with saline rats; #p < 0.05 day 10 compared with day 1. C, Number of infusions across all self-administration sessions for male and female rats. Male rats took a significantly higher number of infusions than female rats on days 6, 7, 9, and 10 of self-administration, and trended toward higher intake on day 8. *p < 0.05, ̂p = 0.051. D, Active and inactive nose pokes during self-administration for methamphetamine and saline rats. Methamphetamine rats performed a significantly higher number of nose-pokes in the active port than saline rats. *p < 0.05. Nose-pokes in the active port were significantly higher compared with inactive port nose pokes in both methamphetamine and saline rats on all days of self-administration. #p < 0.05. E, Average daily intake of methamphetamine was higher in male rats (n = 63) compared with female rats (n = 73). *p < 0.05. F, Average daily nose-pokes in the active port was similar in male and female rats self-administering methamphetamine. G, During seeking tests, methamphetamine rats had a significantly higher number of nose pokes in the previously active hole on WD7, WD30, and WD100 compared with WD1. Rats on WD100 had significantly higher nose pokes in the previously active hole compared with WD7 and WD30. *p < 0.05 compared with WD1, #p < 0.05 compared with WD7 and WD30. Group sizes: WD1 (n = 46 females, n = 36 males), WD7 (n = 8 females, n = 9 males), WD30 (n = 10 females, n = 9 males), WD100 (n = 9 females, n = 9 males). H, There were no differences in the number of nose pokes in the previously active hole between male and female rats. Estrous cycle stage was determined by vaginal swabbing following cue-induced seeking tests with the goal of comparing estrous and nonestrous females. However, there were not enough females in estrus to make a reliable assessment. In lieu of statistical analysis, females in estrus on the day of their seeking test are identified by filled black squares, females not in estrus are indicated by white squares, un-classified females are denoted by gray squares, and males are indicated by white circles. Data are presented as mean ± SEM, with individual data points on all bar graphs.
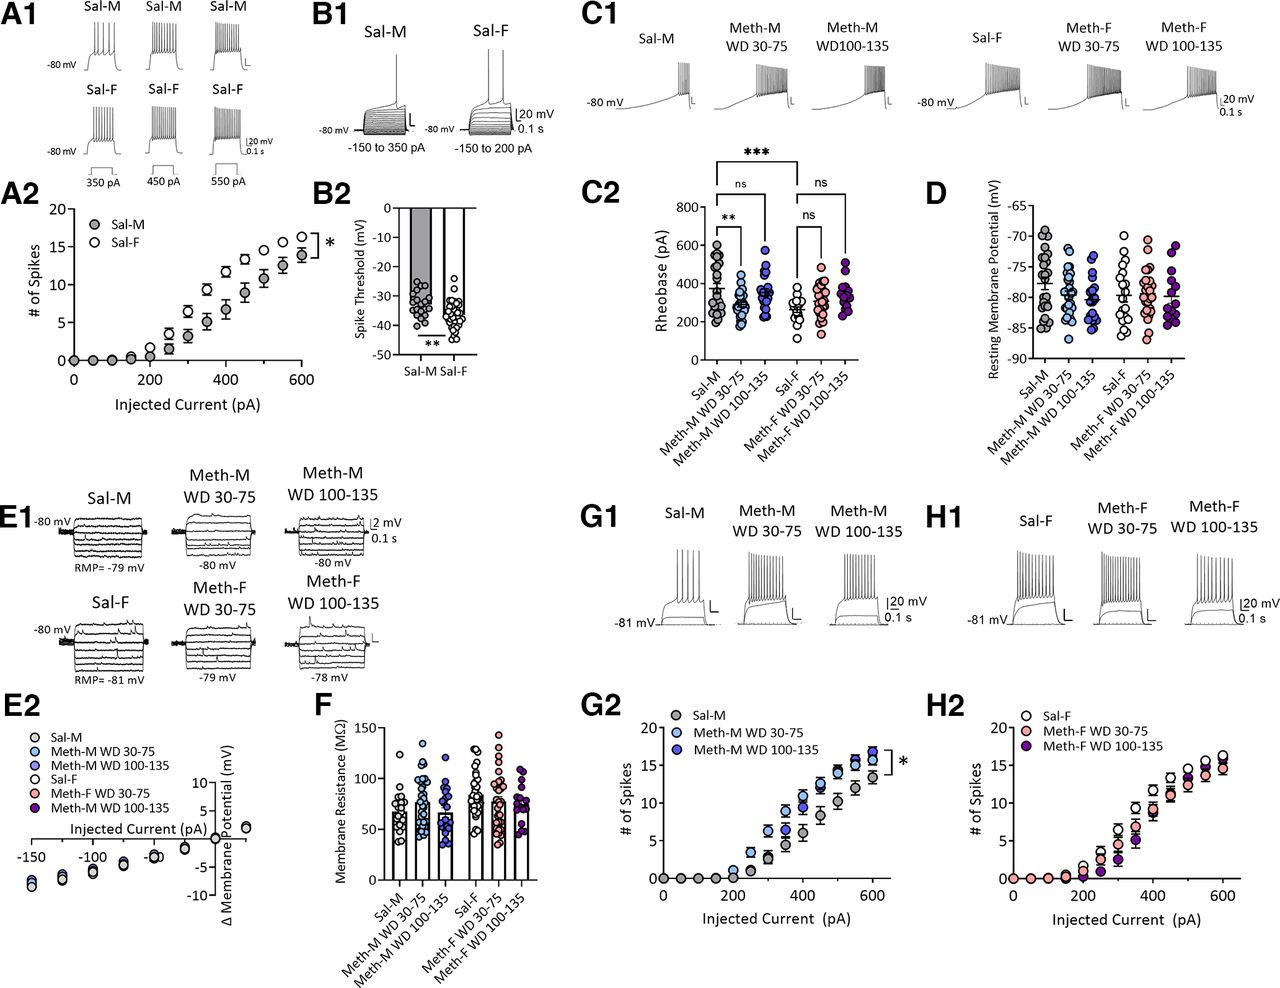
- Figure 2.
Sex-specific alteration of membrane excitability of NAc core MSNs after withdrawal from long-access methamphetamine self-administration. A1, Representative traces of action potentials in response to depolarizing step current injections (350, 450, and 550 pA) in MSNs from saline male (Sal-M; upper panel) or saline female (Sal-F; lower panel) rats. A2, Mean current–voltage (I–V) relationship of MSNs. Average number of action potentials triggered by incremental depolarizing step currents (0–600 pA, Δ50 pA, 500-ms duration) in Sal-M rats (23 cells, 6 rats) and Sal-F rats (34 cells, 8 rats). MSNs from females showed a significantly higher excitability at current injections from 300 to 550 pA than males. * indicates significant main effects of injected current (p < 0.0001) and sex (p < 0.01), and a significant injected current × sex interaction (p < 0.0001); post hoc Bonferroni’s multiple comparisons at 300 pA, p < 0.01; 350 pA, p < 0.001; 400–450 pA, p < 0.0001; 500 pA, p < 0.01; and 550 pA, p < 0.05. B1, Representative traces. B2, Spike threshold was higher in Sal-M rats (20 cells, 6 rats) compared with Sal-F rats (36 cells, 8 rats; two-tailed unpaired t test **p < 0.01). C1, Representative traces of ramp current injection (500 pA/2 s)-induced firing in MSNs. C2, The rheobase current measured by using a ramp current injection in saline rats and each methamphetamine group. A bigger average rheobase current in MSNs from Sal-M rats was observed compared with Sal-F rats. MSNs from the male methamphetamine (Meth-M) WD30–75 group showed lower rheobase currents compared with Sal-M rats with no differences between Sal-M and Meth-M WD100–135. The rheobase currents of MSNs from female methamphetamine rats (Meth-F) were similar in all Meth groups compared with saline controls (Tukey’s test, **p < 0.01, ***p < 0.001; Sal-M, 24 cells, 6 rats; Meth-M WD30–75, 29 cells, 8 rats; Meth-M WD100–135, 22 cells, 6 rats; Sal-F, 19 cells, 6 rats; Meth-F WD30–75, 28 cells, 7 rats; Meth-F WD100–135, 14 cells, 5 rats). D, Average resting membrane potential of MSNs was similar in each group (Tukey’s test, p > 0.05; Sal-M, 25 cells, 6 rats; Meth-M WD30–75, 29 cells, 8 rats; Meth-M WD100–135, 21 cells, 6 rats; Sal-F, 19 cells, 6 rats; Meth-F WD30–75, 28 cells, 7 rats; Meth-F WD100–135, 14 cells, 5 rats). E1, Representative membrane voltage traces in response to subthreshold current injections. E2, Mean I–V relationships following incremental subthreshold current injections (step current injections, –150 to 25 pA/Δ25 pA, 1 s). F, Average input membrane resistance (Rm) of MSNs recorded from saline, Meth WD30–75 and Meth WD100–135 groups in males and females was similar (Tukey’s test, p > 0.05; Sal-M, 21 cells, 6 rats; Meth-M WD30–75, 32 cells, 8 rats; Meth-M WD100–135, 22 cells, 6 rats; Sal-F, 34 cells, 8 rats; Meth-F WD30–75, 33 cells, 8 rats; Meth-F WD100–135, 16 cells, 6 rats). G1, Representative traces of action potentials evoked by 0-, 200-, 400-pA current steps. G2, Mean number of action potentials in response to depolarizing current injections (step, 0–600 pA/Δ50 pA, 0.5 s) in males. Meth-M WD30–75 rats showed increased action potentials at 300–500 pA, whereas Meth-M WD100–135 rats showed increased action potentials at 500 pA compared with Sal-M rats. * indicates significant main effects of injected current (p < 0.0001) and group (p < 0.01), and a significant injected current × group (p < 0.0001); post hoc Tukey’s multiple comparisons, Sal-M versus Meth-M WD30–75: at 300 pA, p < 0.05; 350 pA, p < 0.001; 400 pA, p < 0.0001; 450 pA, p < 0.001; and 500 pA, p < 0.05; Sal-M versus Meth-M WD100–135: at 500 pA, p < 0.05; Sal-M, 22 cells, 6 rats; Meth-M WD30–75, 31 cells, 8 rats; Meth-M WD100–135, 16 cells, 7 rats. H1, Representative traces of action potentials evoked by 0-, 200-, 400-pA current steps. H2, Mean number of action potentials in response to depolarizing currents injected (step, 0–600 pA/Δ50 pA, 0.5 s) in females. No difference was observed between saline and methamphetamine groups (post hoc Tukey’s multiple comparisons p > 0.05; Sal-F, 34 cells, 8 rats; Meth-F WD30–75, 28 cells, 7 rats; Meth-F WD100–135, 15 cells, 6 rats). Data are presented as mean ± SEM.
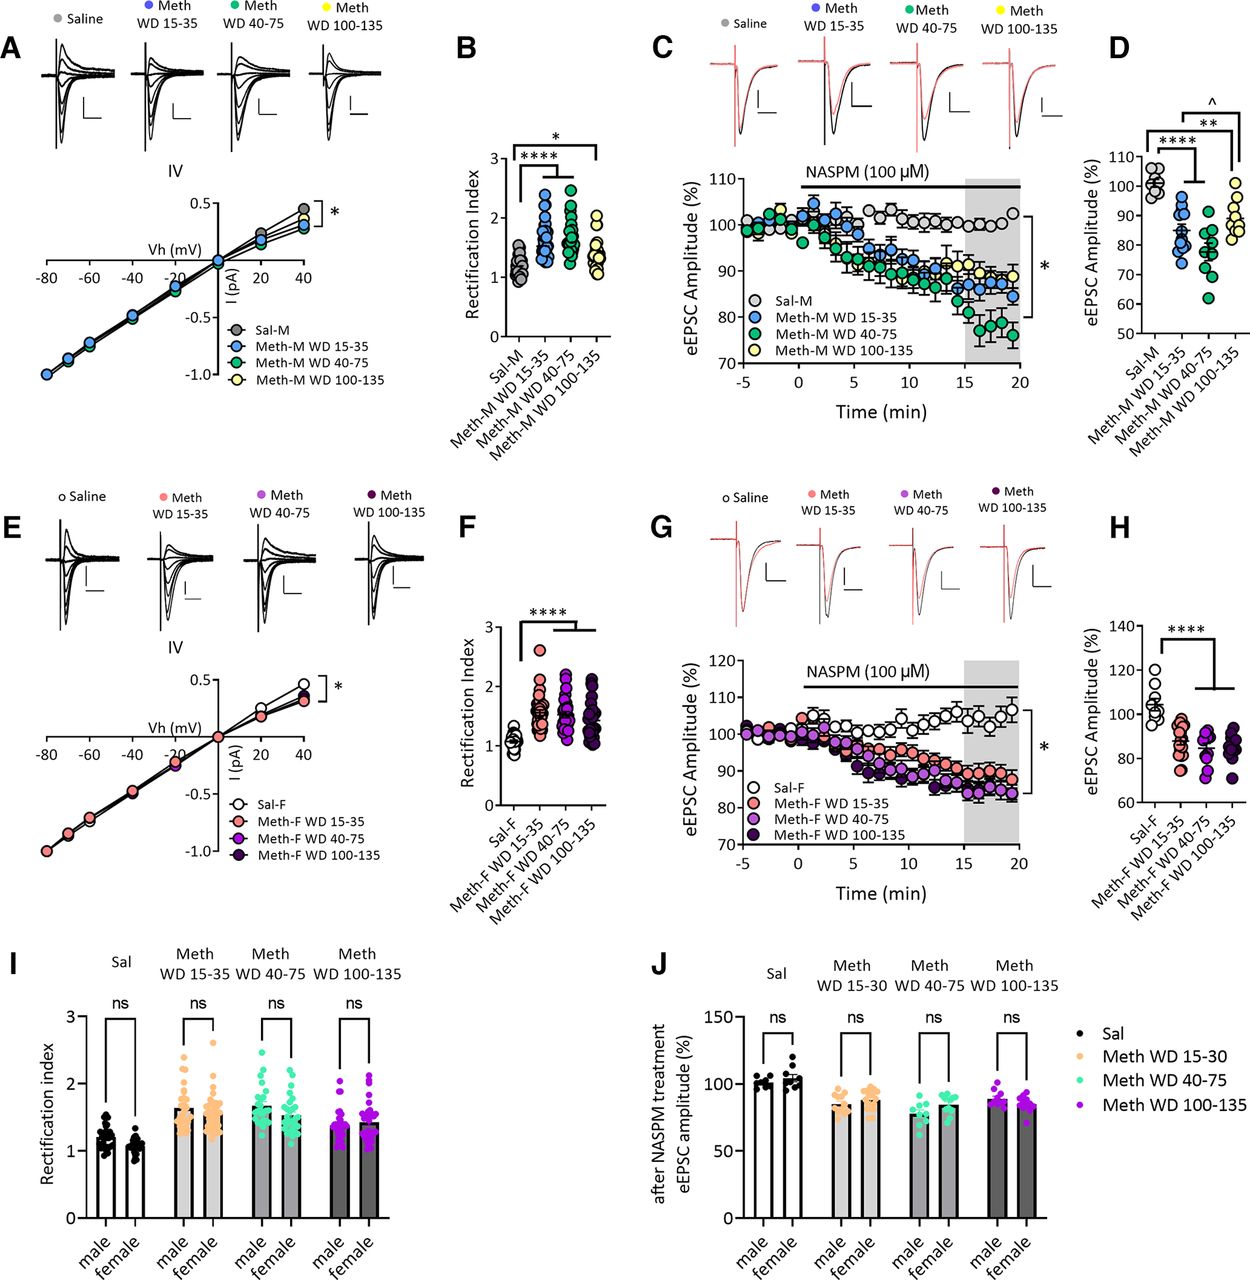
- Figure 3.
Increased GluA2-lacking AMPARs in NAc core MSNs after withdrawal from long-access methamphetamine self-administration in male and female rats. A, AMPAR-mediated eEPSCs (top) recorded at −80, −70, −60, −40, −20, 0, 20, and 40 mV from NAc core MSNs of male rats after withdrawal from saline or methamphetamine (Meth) self-administration. Scale bar: 200 pA/20 ms. Bottom, I–V plot of AMPAR-mediated synaptic responses of MSNs at different membrane holding potentials. The saline male (Sal-M) group showed a linear I–V relationship, but inward rectifying I–V relationships for methamphetamine male (Meth-M) rats were detected at all withdrawal times. * indicates significant main effects of group and Vh, as well as Vh × group interaction (all p < 0.0001). B, Quantification of rectification index or RI [eEPSC−70mV/(−70-Erev)]/[eEPSC+40mV/(+40-Erev)] showing a higher RI in NAc core MSNs from Meth-M rats compared with Sal-M rats (Tukey’s post hoc, Sal-M vs Meth-M WD15–35, ****p < 0.0001; Sal-M vs Meth-M WD40–75, ****p < 0.0001; Sal-M vs Meth-M WD100–135, *p < 0.05; Sal-M, 7 rats, 28 cells; Meth-M WD15–35, 9 rats, 27 cells; Meth-M WD40–75, 8 rats, 24 cells; Meth-M WD100–135, 7 rats, 30 cells). C, Representative eEPSC traces (top: black line, baseline; red line, 15–20 min after NASPM application) and their time courses (bottom) before and during 100 μm NASPM application in Sal-M or Meth-M rats. Scale bar: 200 pA/20 ms. * indicates significant main effects of group (p < 0.001) and time (p < 0.0001), and a significant time × group interaction (p < 0.0001). D, Mean eEPSC amplitudes measured 15–20 min after NASPM application. NASPM decreased eEPSC amplitudes in MSNs from all male Meth groups but not saline rats, indicating upregulation of CP-AMPARs after Meth withdrawal (post hoc Tukey’s multiple comparisons, **p < 0.01, ****p < 0.0001 vs Sal-M group; ̂p < 0.01 Meth-M WD15–35 vs WD100–135; Sal-M, 6 rats, 8 cells; Meth-M WD15–35, 6 rats, 12 cells; Meth-M WD40–75, 6 rats, 9 cells; Meth-M WD100–135, 6 rats, 10 cells). E, Top, AMPAR-mediated eEPSCs recorded from NAc MSNs of saline female (Sal-F) rats or methamphetamine female (Meth-F) rats. Bottom, Rectifying I–V relationships were observed in Meth-F rats at all withdrawal times. * indicates significant main effects of group and Vh and a significant Vh × group interaction (all p < 0.0001). Sal-F, n = 8 rats, 27 cells; Meth-F WD15–35, n = 8 rats, 36 cells; Meth-F WD40–75, n = 8 rats, 28 cells; Meth-F WD100–135, n = 7 rats, 32 cells. Scale bar: 200 pA/20 ms. F, Increased RI in Meth-F rats compared with Sal-F rats (post hoc Tukey’s multiple comparisons, ****p < 0.0001 all Meth groups vs Sal-F; Sal-F, 8 rats, 27 cells; Meth-F WD15–35, 8 rats, 36 cells; Meth-F WD 40–75, 8 rats, 28 cells; Meth-F WD100–135, 7 rats, 32 cells). G, Example eEPSCs (top: black line, baseline; red line, 15–20 min after NASPM application) recorded from NAc core MSNs of female rats and time courses (bottom) before and during NASPM application. Scale bar: 200 pA/20 ms. * indicates significant main effects of group and time, and a significant group × time interaction (all p < 0.0001). Sal-F, 5 rats, 9 cells; Meth-F WD15–35, 8 rats, 18 cells; Meth-F WD 40–75, 6 rats, 11 cells; Meth-F WD100–135, 6 rats, 12 cells. H, Mean eEPSC amplitudes measured 15–20 min after NASPM application showing that the sensitivity to NASPM was increased after withdrawal from Meth in female rats (post hoc Tukey’s multiple comparisons, ****p < 0.0001 all Meth-F groups vs Sal-F). Data are presented as mean ± SEM. I, Bar graphs showing no differences in RI values between males and females in the saline group and males and females in each of the methamphetamine groups (all p > 0.05). J, The effect of NASPM on eEPSC amplitudes after 15- to 20-min bath application was similar between males and females in the saline group and males and females in each of the methamphetamine groups (all p > 0.05). Data shown in panels I and J are replotted from B and D (male rats) and F and H (female rats) for ease of comparison.
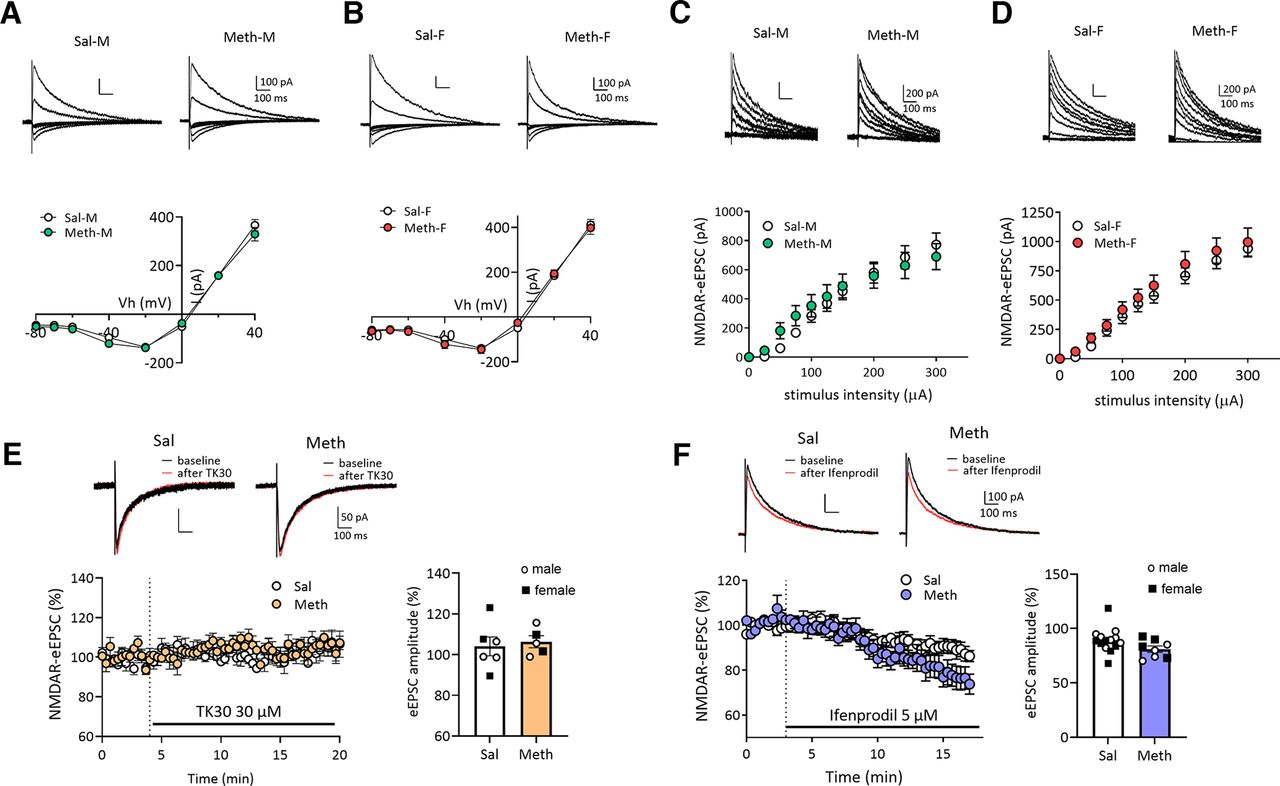
- Figure 4.
No alteration in NMDAR-mediated synaptic transmission in NAc core MSNs after withdrawal from long-access methamphetamine self-administration in male and female rats. A, B, Representative traces (top) of NMDAR-eEPSCs and I–V plot (bottom) of NMDAR-mediated eEPSCs at different membrane holding potentials (−80, −70, −60, −40, −20, 0, 20, 40 mV) in NAc core MSNs in male (M) or female (F) rats after saline (Sal) or methamphetamine (Meth) withdrawal. There were no significant differences in the voltage-dependent properties of NMDAR-mediated eEPSCs between saline and methamphetamine rats in males (A, Bonferroni test, p > 0.05; Meth-M, n = 8 rats, 19 cells; Sal-M, n = 5 rats, 20 cells) or in females (B, Bonferroni test, p > 0.05; Meth-F, n = 7 rats, 11 cells; Sal-F, n = 5 rats, 15 cells). Scale bar: 100 pA/100 ms. C, D, Representative NMDAR-mediated eEPSCs (top) in NAc core MSNs and mean input-output relationship (bottom) of NMDAR-mediated eEPSCs in response to incremental electrical stimulations showing the similar strength of NMDAR-mediated synaptic responses between saline and methamphetamine groups in males (C, Bonferroni test, p > 0.05: Meth-M, n = 8 rats, 17 cells; male saline, n = 5 rats, 19 cells) and females (D, Bonferroni test, p > 0.05; Meth-F, n = 7 rats, 10 cells; Sal-F, n = 5 rats, 15 cells). Scale bar: 200 pA/100 ms. E, Representative traces (top) and time course (bottom left) of NMDAR-eEPSCs at −40 mV before and during application of TK30 (30 μm), a GluN3 NMDAR antagonist. Quantification (right) of average NMDAR-eEPSC amplitudes before and after TK30 treatment showing no effect of TK30 on NMDAR-eEPSCs and no difference between methamphetamine and saline rats (Sal, n = 3 rats, n = 6 cells; Meth, n = 3 rats, n = 5 cells; two-tailed unpaired t test, p = 0.7042). Scale bar: 50 pA/100 ms. F, Representative traces (top) and time course (left) of NMDAR-eEPSCs at +40 mV before and during application of Ifenprodil (5 μm), a GluN2B NMDAR antagonist. Ifenprodil reduced NMDAR-mediated eEPSCs to a similar relative degree in MSNs from saline and methamphetamine rats. Summary graph (right) showing similar ifenprodil sensitivity between saline and methamphetamine rats (Sal, n = 6 rats, 14 cells; Meth, n = 6 rats, 8 cells; two-tailed unpaired t test, p = 0.0903). Scale bar: 100 pA/100 ms. Data are presented as mean ± SEM.
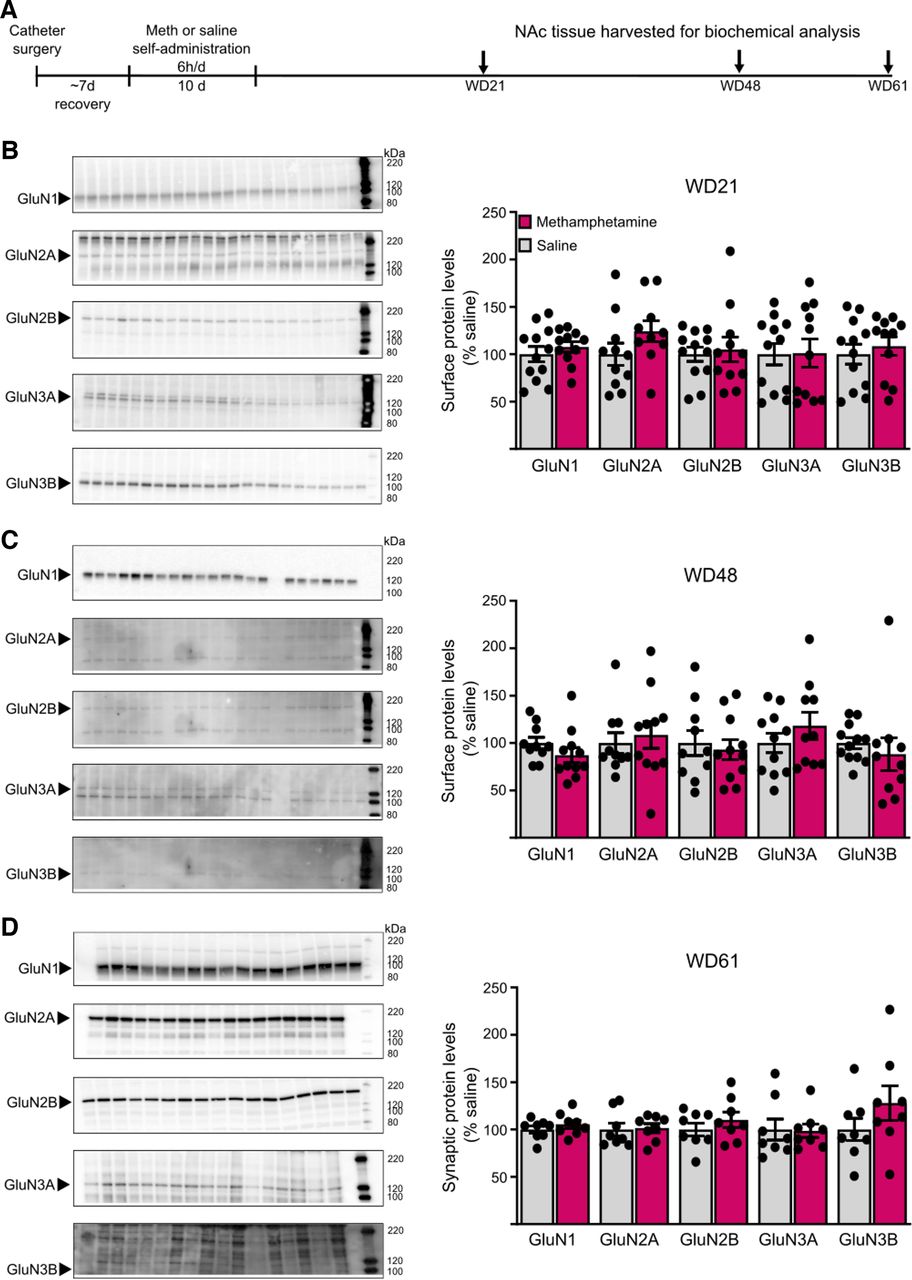
- Figure 5.
NMDAR subunit protein levels in cell surface and postsynaptic density (PSD) fractions are unchanged after withdrawal from long-access methamphetamine self-administration. A, Male rats received jugular catheters, and underwent methamphetamine or saline self-administration for 10 d. NAc tissue was dissected for analysis of cell surface proteins (B, C) or PSD proteins (D). B, C, NAc core tissue from methamphetamine and saline rats was biotinylated to label cell surface proteins and immunoblotted as described in Materials and Methods (WD21: saline, n = 12; methamphetamine, n = 11; WD48: saline, n = 11; methamphetamine, n = 10). Left, Representative immunoblots of biotinylated tissue at each withdrawal time point for each subunit. Right, Summary data of surface expression of each subunit. No significant change in surface expression of any subunit was detected in methamphetamine rats compared with saline rats on either WD21 (B) or WD48 (C; t tests, p > 0.05). There were also no significant changes in total NMDAR subunit levels in homogenates (data summarized in Results). D, Triton-insoluble PSD fractions were prepared from NAc tissue on WD61 as described in Materials and Methods (saline, n = 8; methamphetamine, n = 8). Left, Representative immunoblots for each subunit. Right, Summary data of PSD levels of each subunit. No significant difference was found for any subunit between methamphetamine and saline rats (t tests, p > 0.05). For representative immunoblots in B–D, arrows on the left indicate the band analyzed (GluN1 ∼120 kDa, GluN2A ∼180 kDa, GluN2B ∼200 kDa, GluN3A ∼125 kDa, GluN3B ∼100 kDa) and numbers on the right indicate molecular weights (kDa) on the protein ladder. Summary data are presented as percent of average levels in saline animals (mean ± SEM), with dots indicating individual data points. The number of lanes presented on the blots may differ from the number of data points included in the analysis because imperfections in a particular lane prevented analysis. GluN3B bands appear faint in the images but could be selected and analyzed using our gel documentation software. A Shapiro–Wilk test was used to assess normality of data. Parametric data were analyzed using a Student’s t test (WD21 surface GluN1, GluN2A, GluN2B, GluN3A; WD48 surface GluN2B, GluN3A; WD61 PSD GluN1, GluN2B, GluN3B, p > 0.05), and nonparametric data were analyzed using a Mann–Whitney U test (WD21 surface GluN3B; WD48 surface GluN1, GluN2A, GluN3B; WD61 PSD GluN2A, GluN3A, p > 0.05).


In this issue


