

Article Figures & Data
Figures
- Figure 1.
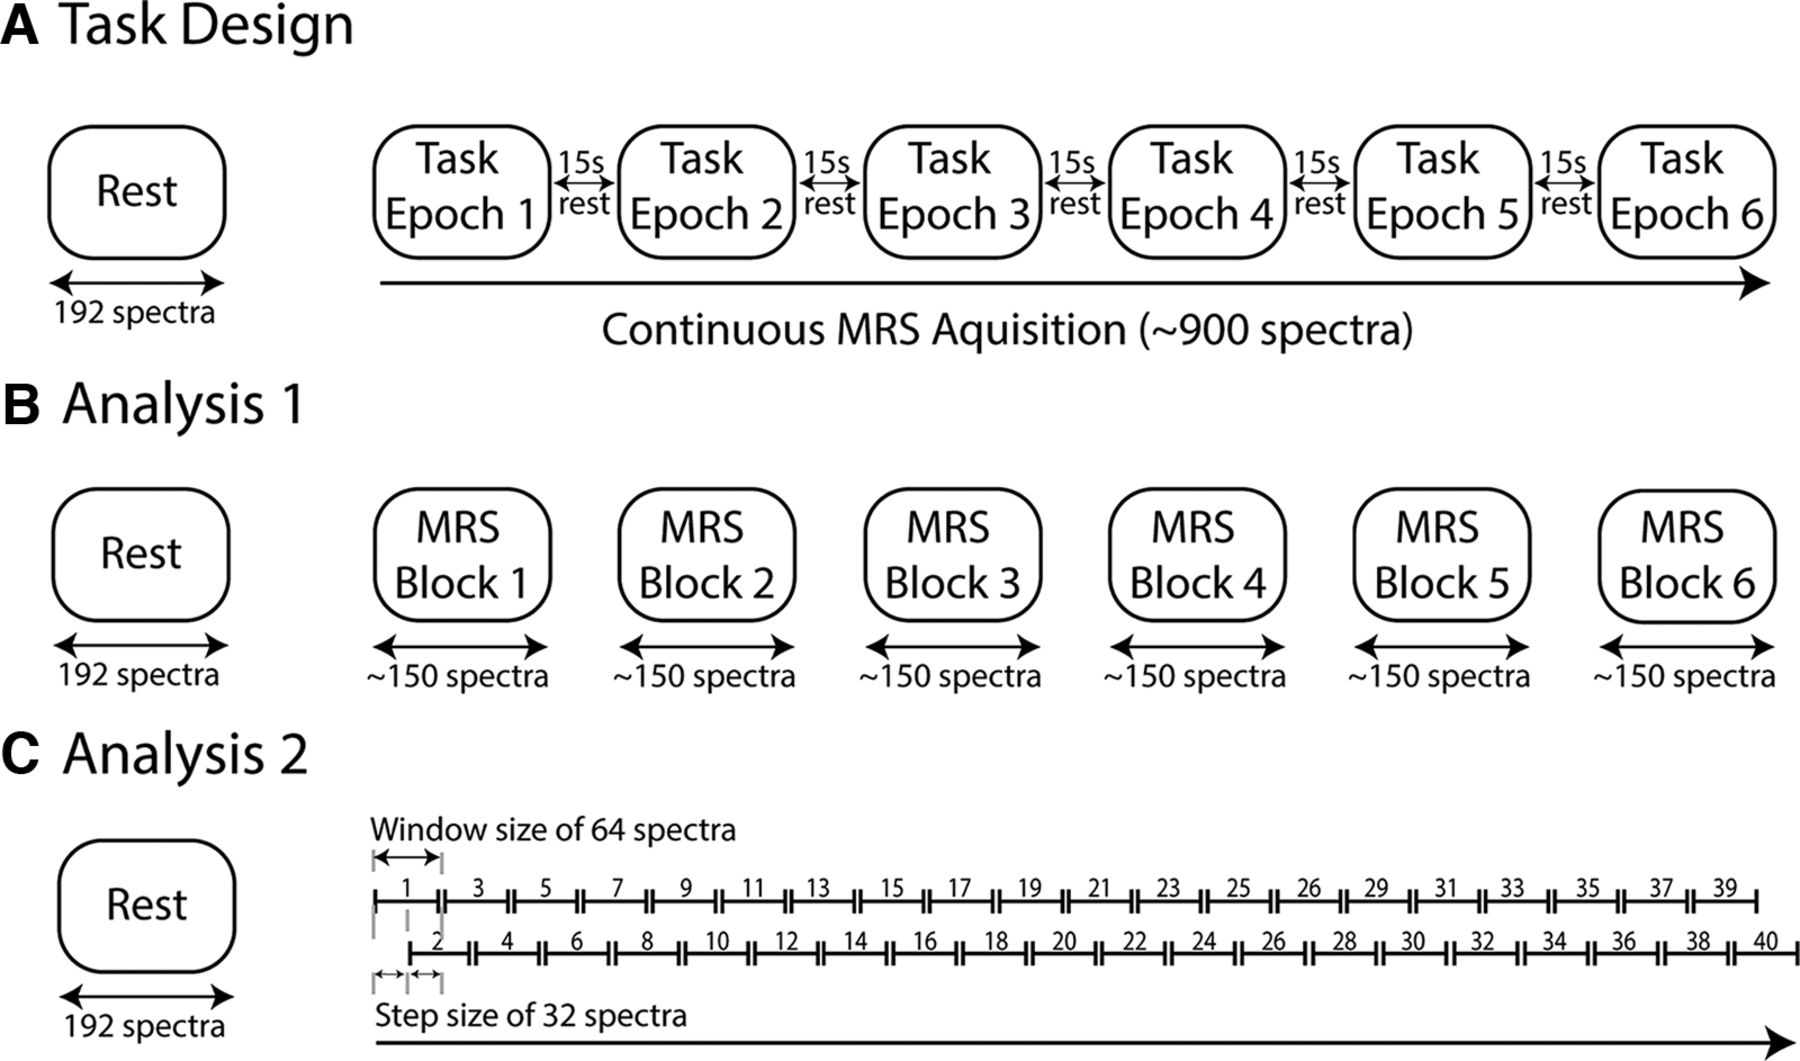
A, Task design. The task consists of 6 epochs, each lasting ∼5 min, with a 15 s rest period in between. Each epoch consists of 48 trials in which participants are asked to press a button as quickly as possible in response to a cue. MRS data were continuously acquired during the task using a MEGA-PRESS sequence. B, Analysis 1. Spectra was averaged into blocks corresponding to the length of each task epoch, creating 6 averages of ∼150 spectra. ANOVAs were used to compare metabolite levels across blocks. C, Analysis 2. Spectra were analyzed using a sliding-window approach with a window size of 64 and a step size of 32, providing ∼40 timepoints.
- Figure 2.
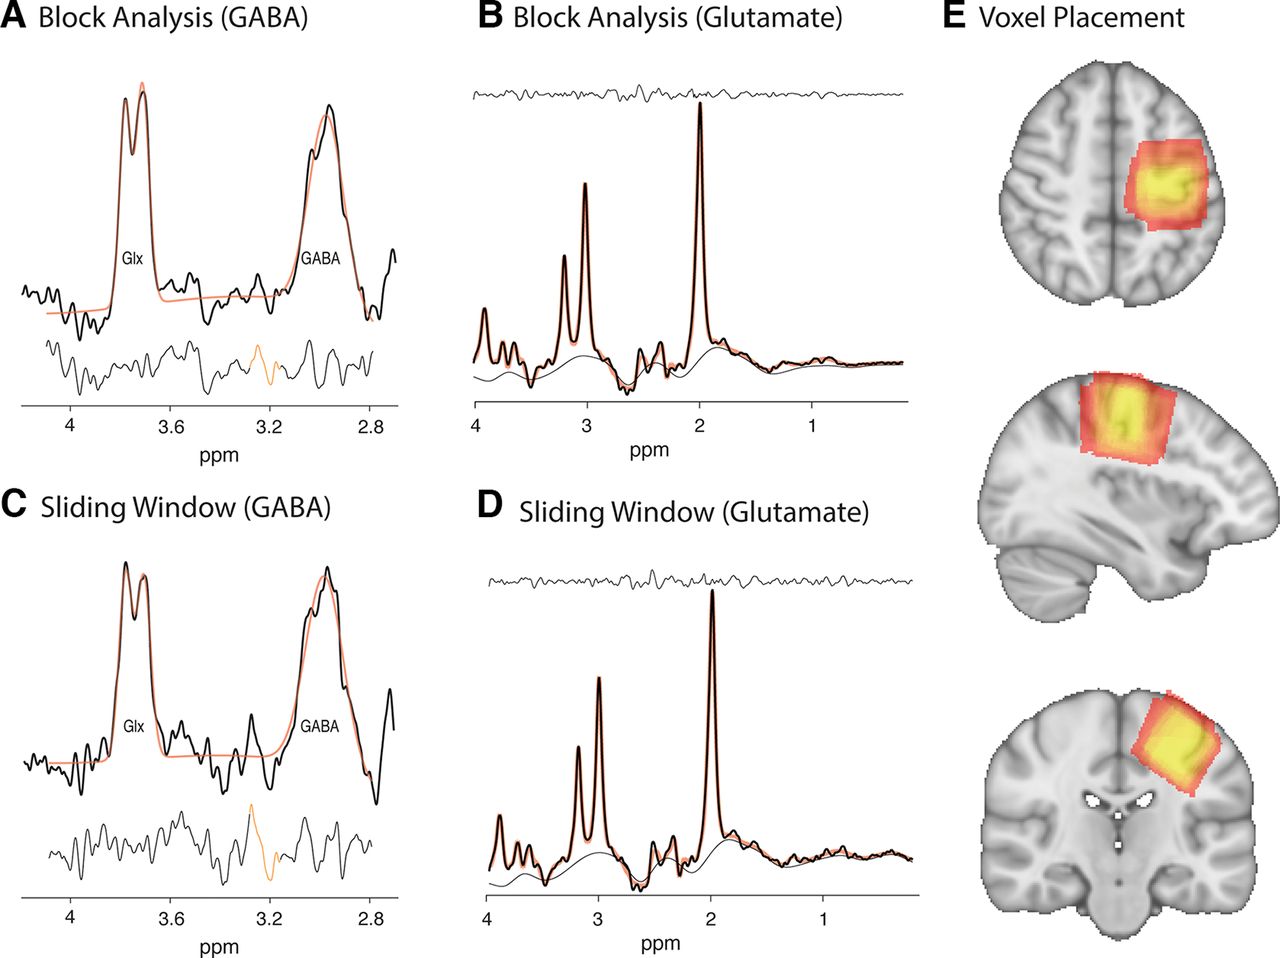
A, Example of GABA+ data from the block analysis [number of signal averages (NSA) = 184]. B, Example of glutamate data obtained from the OFF sub-spectra from the block analysis (NSA = 184). C, Example of GABA+ data from the sliding-window analysis (NSA = 64). D, Example of glutamate data obtained from the OFF sub-spectra from the sliding-window analysis (NSA = 64). E, Heatmap of voxel placement, yellow shows areas of high overlap.
- Figure 3.
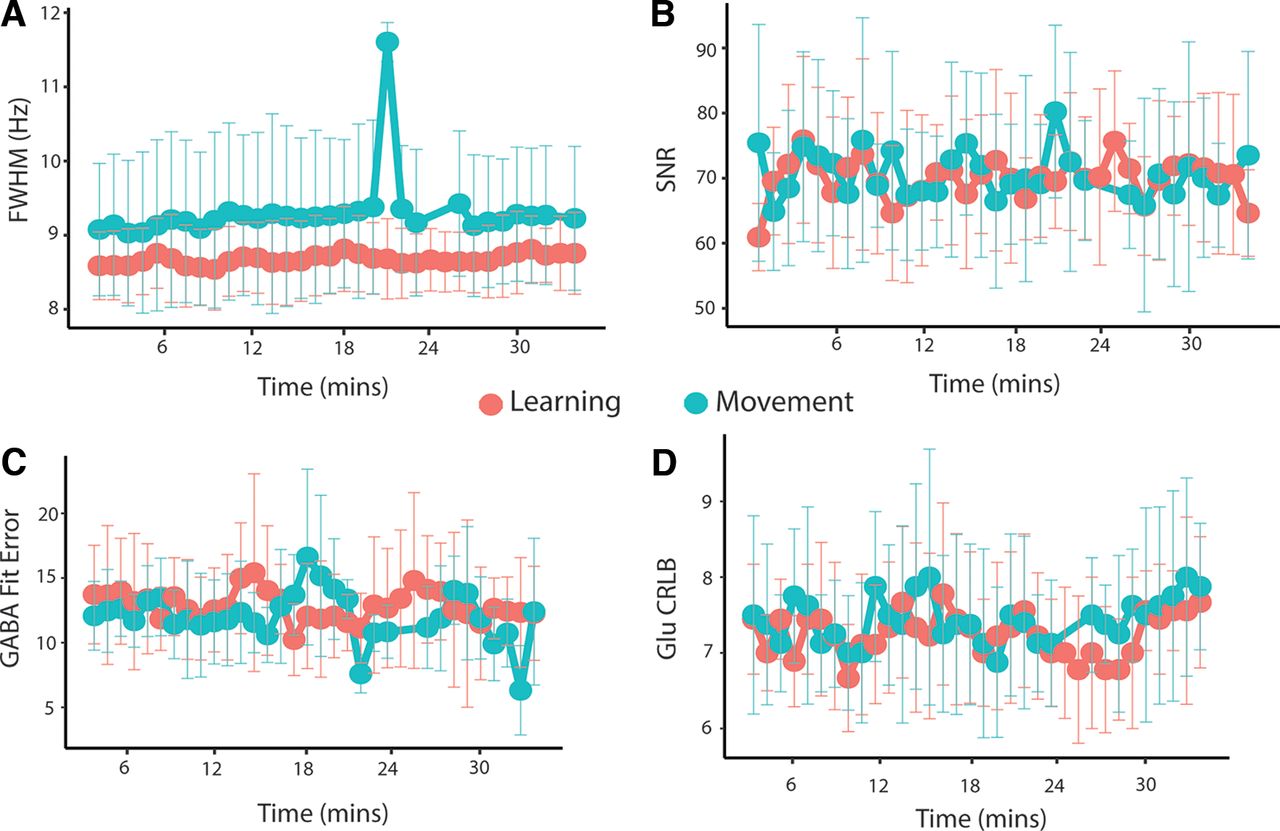
Quality metrics for sliding-window analysis. A, Mean NAA FWHM in hertz. B, Mean NAA SNR. Error bars represent the SD. C, Mean GABA+ fit error (%) calculated in Gannet. D, Mean glutamate CRLB calculated in LCModel.
- Figure 4.
Example of frequency drift across the full data acquisition of each task from a single subject. A, Frequency drift during the motor learning task. B, Frequency drift during the control task.
- Figure 5.
Reaction time for each task block for each individual participant. Note: subject (Sub) 05 was removed because their button presses often preceded the queue.
- Figure 6.
Mean reaction time for each block throughout the task. Error bars represent the SD. Comparisons made to block 1: *p < 0.05, **p < 0.01, ***p < 0.001. All p-values are Bonferroni adjusted.
- Figure 7.
GABA+/tCr levels for each individual participant throughout the task. A, GABA+/tCr levels analyzed using the block analysis. B, GABA+/tCr levels analyzed using the sliding-window analysis. Note: subject (Sub) 08 was removed because of poor data quality. Data from the control task of subject (Sub) 09 was removed because of errors during data acquisition.
- Figure 8.
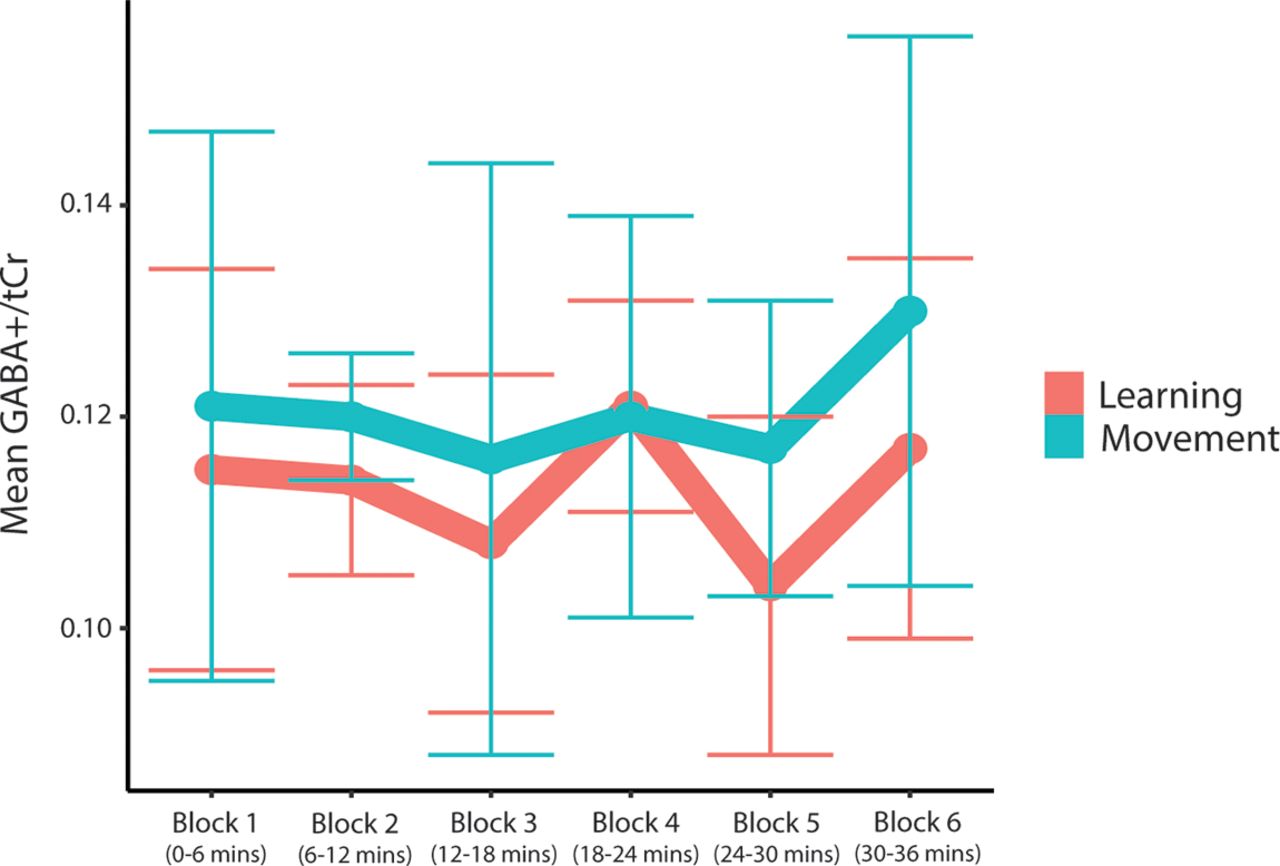
Mean GABA+/tCr levels for each block throughout the task. Error bars represent the SD.
- Figure 9.
Mean GABA+/tCr levels for each window throughout the task. Dot and thin lines represent the mean of all participants, thick lines represent an estimated linear regression line. Shaded areas represent SE of the estimated regression. MRS data from all subjects for windows 24 (spectra 737–800; ∼22 min) and 25 (spectra 769–832; ∼23 min), and MRS data from three subjects from window 21 (spectra, 641–704; ∼19 min) were removed from the control task because of a NAA linewidth of >13 Hz.
- Figure 10.
Glx/tCr levels for each individual participant throughout the task. A, Glx/tCr levels analyzed using the block analysis. B, Glx/tCr levels analyzed using the sliding-window analysis. Note: data from the control task of subject (Sub) 09 was removed because of errors during data acquisition.
- Figure 11.
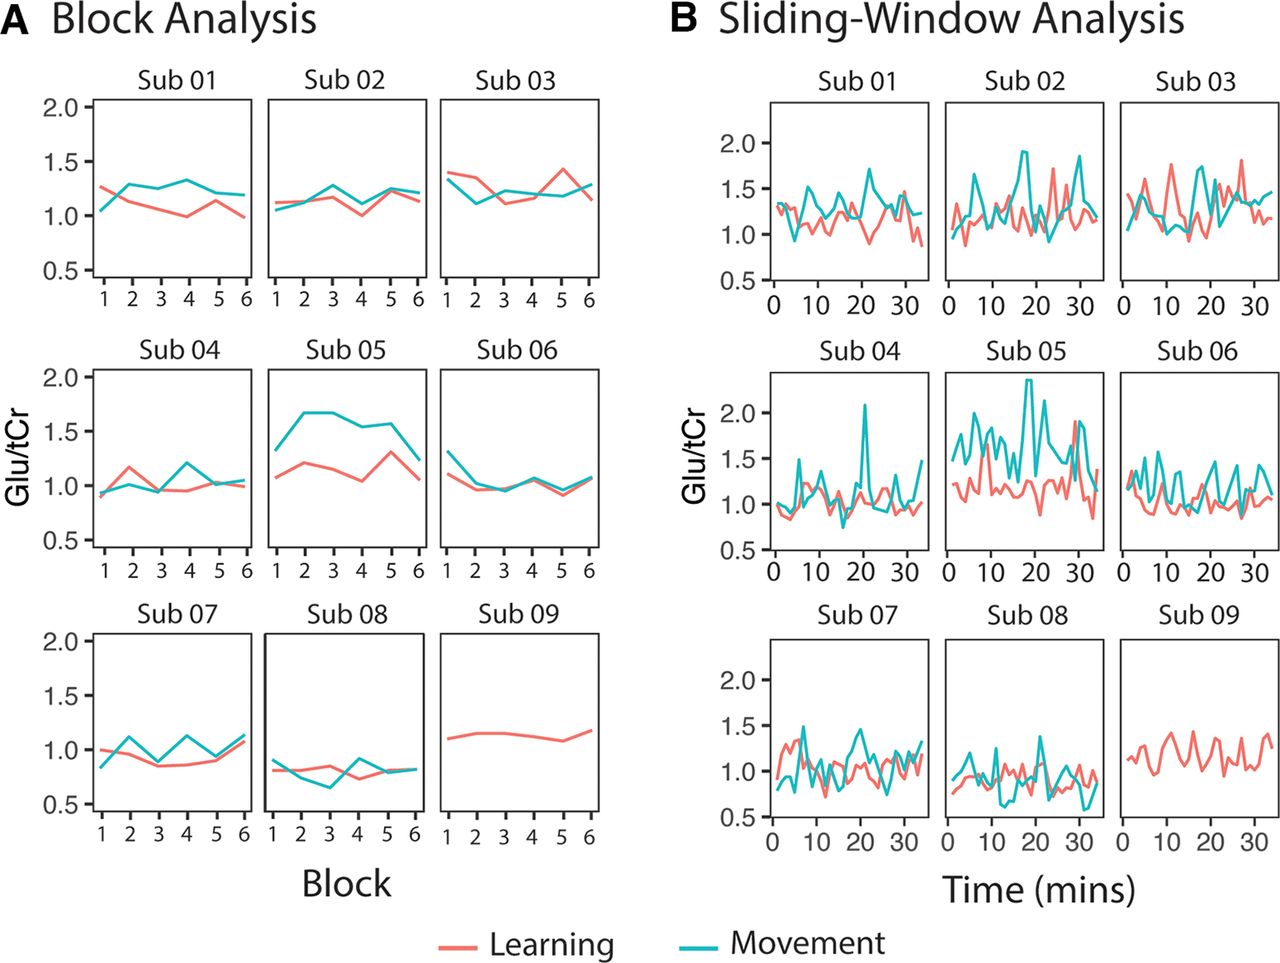
Glu/tCr levels for each individual participant throughout the task. A, Glu/tCr levels analyzed using the block analysis. B, Glu/tCr levels analyzed using the sliding-window analysis. Note: Data from the control task of subject (Sub) 09 was removed because of errors during data acquisition.
- Figure 12.
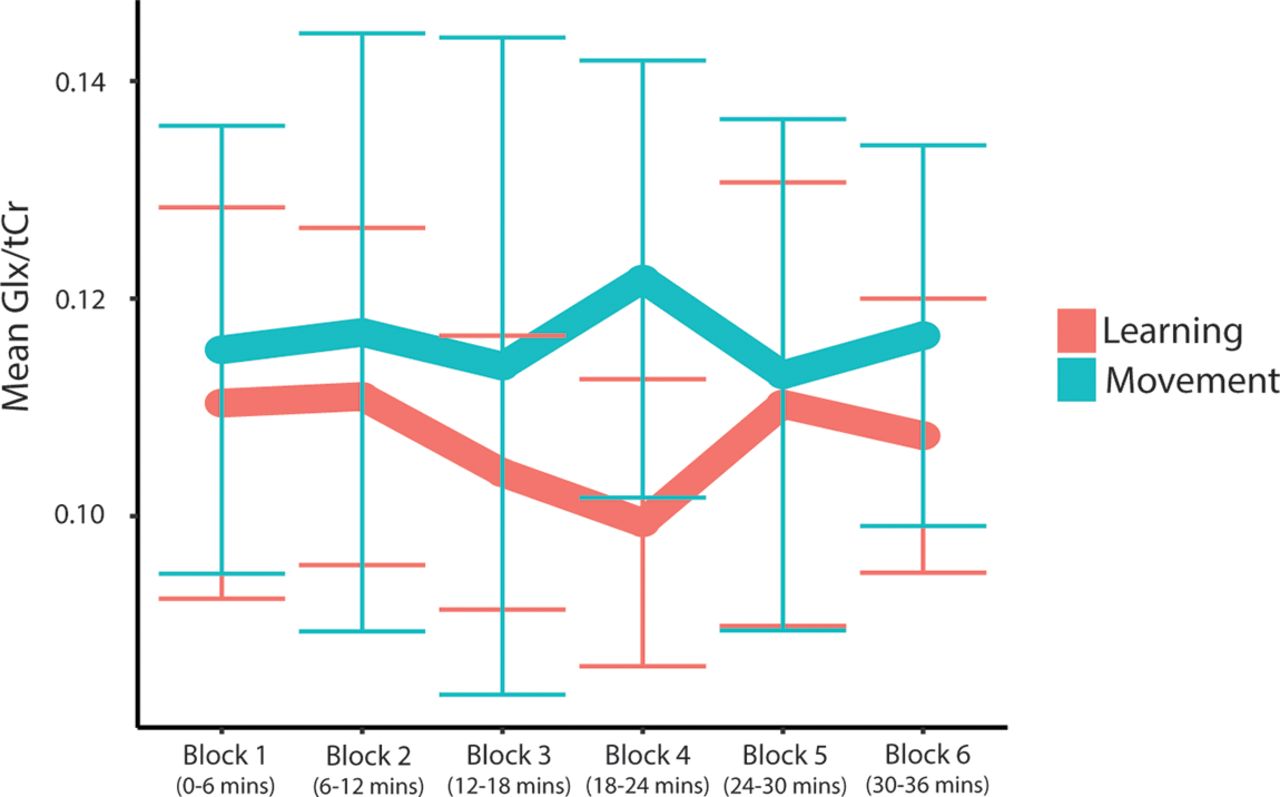
Mean Glx/tCr levels for each block throughout the task. Error bars represent the SD.
- Figure 13.
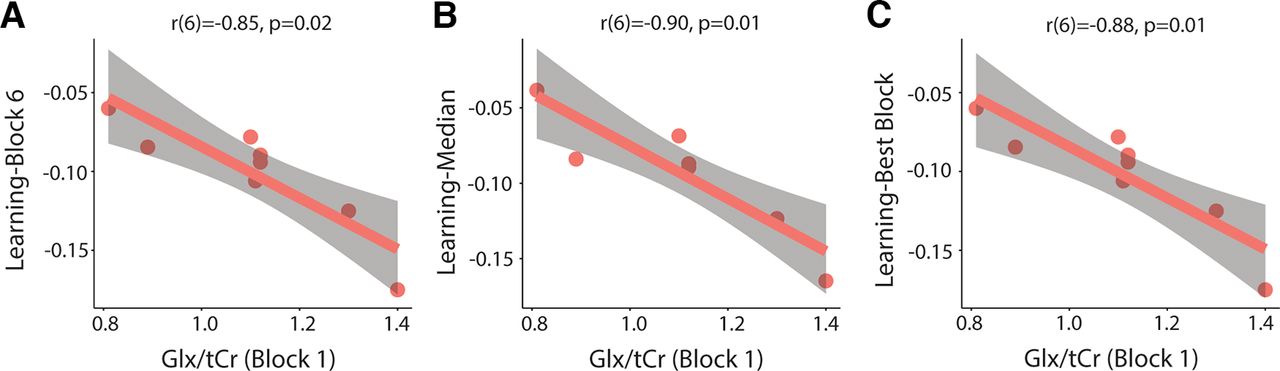
Relationship between levels of Glx/tCr in block 1 and motor learning. A, Significant correlation between block 1 Glx/tCr levels and learning-block 6. B, Significant correlation between block 1 Glx/tCr levels and learning-median. C, Significant correlation between block 1 Glx/tCr levels and learning-best block. All p-values are Bonferroni adjusted. Shaded areas represent 95% confidence intervals.
- Figure 14.
Relationship between levels of Glx/tCr at rest and motor learning. A, Correlation between resting Glx/tCr levels and learning-block 6. B, Significant correlation between resting Glx/tCr levels and learning-median. C, Significant correlation between resting Glx/tCr levels and learning-best block. All p-values are Bonferroni adjusted. Shaded areas represent 95% confidence intervals.
- Figure 15.
Mean Glu/tCr levels for each block throughout the task. Error bars represent the SD.
- Figure 16.
Relationship between levels of Glu/tCr in block 1 and motor learning. A, Significant correlation between block 1 Glu/tCr levels and learning-block 6. B, Significant correlation between block 1 Glu/tCr levels and learning-median. C, Significant correlation between block 1 Glu/tCr levels and learning-best block. All p-values are Bonferroni adjusted. Shaded areas represent 95% confidence intervals.
- Figure 17.
Relationship between levels of Glu/tCr at rest and motor learning. A, Correlation between resting Glu/tCr levels and learning-block 6. B, Significant correlation between resting Glu/tCr levels and learning-median. C, Correlation between resting Glu/tCr levels and learning-best block. All p-values are Bonferroni adjusted. Shaded areas represent 95% confidence intervals.
- Figure 18.
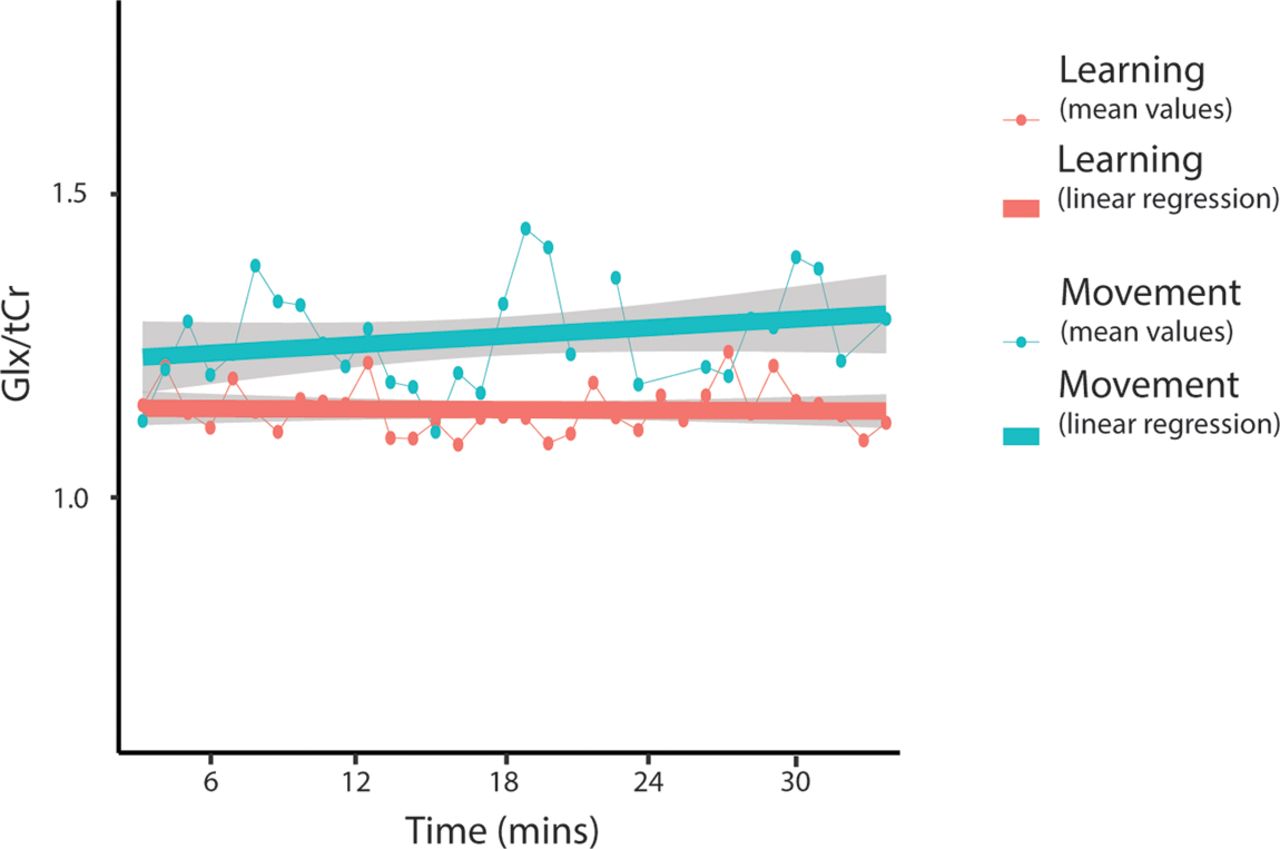
Mean Glx/tCr levels for each window throughout the task. Dot and thin lines represent the mean of all participants, thick lines represent an estimated linear regression line. Shaded areas represent the SE of the estimated regression. MRS data from all subjects for windows 24 (spectra 737–800; ∼22 min) and 25 (spectra 769–832; ∼23 min), and MRS data from three subjects from window 21 (spectra 641–704; ∼19 min) were removed from the control task because of a NAA linewidth of >13 Hz.
- Figure 19.
Mean Glu/tCr levels for each window throughout the task. Dot and thin lines represent the mean of all participants, thick lines represent an estimated linear regression line. Shaded areas represent SE of the estimated regression. MRS data from all subjects for windows 24 (spectra 737–800; ∼22 min) and 25 (spectra 769–832; ∼23 min), and MRS data from three subjects from window 21 (spectra 641–704; ∼19 min) were removed from the control task because of a NAA linewidth of >13 Hz.


Tables
NAA FWHM (Hz) NAA SNR Motor learning Control task Motor learning Control task Block 1 8.49 (0.46) 8.92 (1.00) 115.11 (17.64) 117.90 (21.92) Block 2 8.45 (0.51) 9.03 (1.11) 108.42 (14.05) 117.29 (18.80) Block 3 8.52 (0.54) 9.08 (1.17) 110.47 (17.37) 112.44 (15.44) Block 4 8.53 (0.48) 9.09 (1.02) 112.48 (17.03) 113.39 (22.91) Block 5 8.52 (0.45) 9.05 (0.98) 113.39 (12.41) 107.16 (21.97) Block 6 8.55 (0.47) 9.05 (0.95) 106.73 (15.37) 109.03 (23.36) Values are mean (SD).
GABA fit error Glutamate CRLB Motor
learningControl
taskMotor
learningControl
taskBlock 1 8.94 (2.61) 8.71 (1.29) 6.44 (1.01) 6.50 (0.53) Block 2 8.79 (1.76) 7.66 (2.23) 6.22 (0.83) 6.00 (0.76) Block 3 9.06 (2.21) 9.03 (1.41) 6.78 (0.44) 6.63 (0.74) Block 4 7.66 (1.39) 7.60 (0.90) 6.67 (0.71) 6.63 (0.74) Block 5 9.38 (2.64) 8.62 (1.48) 6.44 (0.53) 6.75 (0.46) Block 6 8.26 (1.80) 8.29 (3.46) 6.44 (0.88) 7.00 (0.53) Values are mean (SD).
- Table 3
Summary of linear mixed effects model parameters from the sliding-window analysis of GABA+/tCr
Parameter Fixed effects Random
effectsEstimate SE 95% CI t p Variance SD Intercept 0.12 0.004 0.11, 0.13 27.73 p < 0.001 0.00003 0.006 Condition −0.003 0.008 −0.02, 0.01 −0.46 0.656 0.0003 0.02 Time −0.0002 0.0002 −0.0006, 0.0001 −1.19 0.235 Condition by time 0.0003 0.0003 −0.0003, 0.0009 1.07 0.287 95% CIs were approximated using the Wald method.
- Table 4
Summary of linear mixed effects model parameters from the sliding window analysis of Glx/tCr
Parameter Fixed effects Random
effectsEstimate SE 95% CI t p Variance SD Intercept 1.15 0.04 1.05, 1.24 25.90 p < 0.01 0.01 0.11 Condition 0.09 0.06 −0.03, 0.22 1.63 0.13 0.02 0.13 Time −0.0002 0.001 −0.003, 0.002 −0.13 0.90 Condition by time 0.003 0.002 −0.0004, 0.0067 1.74 0.08 95% CIs were approximated using the Wald method.
- Table 5
Summary of linear mixed effects model parameters from the sliding window analysis of Glu/tCr
Parameter Fixed effects Random
effectsEstimate SE 95% CI t p Variance SD Intercept 1.12 0.04 1.05, 1.24 26.10 p < 0.01 0.01 0.11 Condition 0.07 0.06 −0.03, 0.22 1.35 0.20 0.02 0.13 Time −0.0006 0.001 −0.003, 0.002 −0.53 0.60 Condition by time 0.003 0.002 −0.0004, 0.0067 1.75 0.08 95% CIs were approximated using the Wald method.
In this issue


