

Abstract

Krook-Magnuson et al. report a bidirectional functional connectivity between the hippocampus and the cerebellum in a mouse model of temporal lobe epilepsy, and demonstrate that cerebellar directed on-demand optogenetic intervention can stop seizures recorded from the hippocampus.
Temporal lobe epilepsy is often medically refractory and new targets for intervention are needed. We used a mouse model of temporal lobe epilepsy, on-line seizure detection, and responsive optogenetic intervention to investigate the potential for cerebellar control of spontaneous temporal lobe seizures. Cerebellar targeted intervention inhibited spontaneous temporal lobe seizures during the chronic phase of the disorder. We further report that the direction of modulation as well as the location of intervention within the cerebellum can affect the outcome of intervention. Specifically, on-demand optogenetic excitation or inhibition of parvalbumin-expressing neurons, including Purkinje cells, in the lateral or midline cerebellum results in a decrease in seizure duration. In contrast, a consistent reduction in spontaneous seizure frequency occurs uniquely with on-demand optogenetic excitation of the midline cerebellum, and was not seen with intervention directly targeting the hippocampal formation. These findings demonstrate that the cerebellum is a powerful modulator of temporal lobe epilepsy, and that intervention targeting the cerebellum as a potential therapy for epilepsy should be revisited.
Significance Statement
Epilepsy is a condition of spontaneous recurrent seizures. Current treatment options for epilepsy can have major negative side effects and for many patients fail to control seizures. We detected seizures on-line and tested a new selective intervention using a mouse model of temporal lobe epilepsy. In this form of epilepsy, seizures typically arise in the hippocampus. We report that targeting intervention to a distinct brain region, the cerebellum, significantly inhibits hippocampal seizures. This identifies the cerebellum as a potential future therapeutic target for temporal lobe epilepsy.
Introduction
Temporal lobe epilepsy (TLE) is the most common form of epilepsy in adults. Many TLE patients that are unresponsive to anti-epileptic drugs are also not good candidates for surgical resection, leaving a large population of patients with a great and currently unaddressed need for seizure control. On-demand optogenetics (Armstrong et al., 2013) provides a powerful tool to study the potential influence of networks outside the hippocampus on temporal lobe seizures and thereby identify new targets for intervention and improve understanding of network interactions in epilepsy. The cerebellum has been considered as a potential intervention target (Miller, 1992; Fountas et al., 2010), and a recent study indicated that the cerebellum may exert surprisingly potent effects on normal hippocampal information processing (Rochefort et al., 2011). Given the need for new intervention strategies and the specificity achievable with on-demand optogenetics, we asked if on-demand optogenetic intervention targeting the cerebellum could provide seizure control.
Using the unilateral intrahippocampal kainate mouse model of temporal lobe epilepsy and on-line seizure detection (Armstrong et al., 2013), we found that cerebellar targeted intervention can inhibit spontaneous temporal lobe seizures during the chronic phase of the disorder, and that the direction of modulation as well as the location of intervention within the cerebellum can affect the outcome of intervention. While on-demand optogenetic excitation or inhibition of cerebellar parvalbumin (PV)-expressing neurons, including Purkinje cells, results in a decrease in seizure duration, a consistent reduction in spontaneous seizure frequency occurs uniquely with on-demand optogenetic excitation of the midline cerebellum. This inhibition of seizure initiation outlasts the duration of intervention and was not seen with intervention directly targeting the hippocampal formation.
Materials and Methods
Animals
All animal procedures were performed according to the regulation of the Animal Care Committee at the institution where the research was performed. Mice with restricted opsin expression were generated by crossing mice expressing Cre selectively in parvalbumin-expressing neurons (PV-Cre; B6;129P2-Pvalbtm1(Cre)Arbr/J; stock 008069 from The Jackson Laboratory; Hippenmeyer et al., 2005) with either floxed-STOP channelrhodopsin (ChR2) mice [Ai32; Rosa-CAG-LSLChR2H134R-EYFP-deltaNeo generated by Hongkui Zeng, obtained from the Allen Institute and maintained by crossing with C57BL/6J mice (The Jackson Laboratory stock number 000664); Ai32D is available from The Jackson Laboratory, stock 012569 (Madisen et al., 2012)] or floxed-STOP halorhodopsin (HR) mice (Ai39; B6;129S-Gt(ROSA)26Sortm39(CAGHOP/EYFP)Hze/J; generated by Hongkui Zeng, available from The Jackson Laboratory, stock 014539 (Madisen et al., 2012), maintained by crossing with C57BL/6J mice). These crosses generated mice expressing ChR2 or HR in PV-containing cells, including cerebellar Purkinje neurons, and are referred to as PV-ChR2 or PV-HR, respectively, in the text. Obtaining mice with opsin expression restricted to Purkinje neurons was attempted by crossing B6.129-Tg(Pcp2-cre)2Mpin/J [The Jackson Laboratory stock number 004146, a mouse line with Cre inserted into the Pcp2 (Purkinje cell protein 2) gene] with the above Cre-dependent opsin lines. However, as discussed in the Results section, we found this line to have considerable nonspecific expression. The goal of mice with truly restricted expression was instead achieved by crossing a second line (B6.Cg-Tg(Pcp2-cre)3555Jdhu/J, The Jackson Laboratory stock number 010536, referred to in the text simply as “Pcp-Cre”) with the above Cre-dependent opsin lines.
Male and female offspring were used for experiments. Opsin-negative littermates were used as nonexpressing epileptic controls. For visualization of Cre expression, PV-Cre and Pcp-Cre mice were crossed with a tdTomato reporter strain (B6;129S6-Gt(ROSA)26Sortm9(CAG-tdTomato)Hze/J; stock 007905 from The Jackson Laboratory). For some slices, a DAPI (4′,6-diamidino-2-phenylindole) mounting media (Vectashield) was used.
Epilepsy induction and monitoring
To obtain chronically epileptic mice, which reproduce key features of human unilateral hippocampal sclerosis (Cavalheiro et al., 1982; Bragin et al., 1999; Staba et al., 2012), we used the intrahippocampal kainate mouse model of temporal lobe epilepsy, in which kainate is focally injected unilaterally into the hippocampus of adult mice. In this model, after a period of weeks, spontaneous recurrent seizures emerge, which typically originate near the sclerotic region in the hippocampal formation (Bragin et al., 1999; Haussler et al., 2012). On or after postnatal day 46, kainic acid (KA; 50-100 nL, 20 mM in saline, Tocris Bioscience) was stereotaxically injected into the left dorsal hippocampus (2.0 mm posterior, 1.25 mm left, and 1.6 mm ventral to bregma) under isoflurane anesthesia. At least 2 weeks later, animals were stereotaxically implanted with bipolar, twisted wire, depth electrodes (PlasticsOne) and optical fibers (0.37 NA, 200 or 400 µm diameter, ThorLabs) terminated in 1.25 mm ceramic ferrules (Kientec Systems). Hippocampal optrodes (electrode + optical fiber) were implanted ipsilateral to kainate injection (posterior 2.6 mm, left 1.75 mm, ventral 1.4 mm with respect to bregma). The hippocampal electroencephalogram (EEG) signal was derived from this single twisted wire electrode (i.e., local hippocampus reference). Cerebellar optical fibers were targeted to the cerebellar surface 5.7 mm posterior to bregma, at the midline (0 mm lateral), 2.3 mm left, and 2.3 mm right, or to the medial deep cerebellar nuclei (DCN) at posterior 6.5 mm, lateral 0.6 mm, and ventral 2 mm. A subset of animals additionally had a cerebellar bipolar electrode to record simultaneously the cerebellar EEG signal. As with hippocampal EEG recordings, the cerebellar EEG signal was derived from this single twisted wire electrode (i.e., local cerebellar reference). Implants were fixed to the skull using screws (McMaster-Carr) and dental cement (Teets Cold Curing), and the animals were allowed to recover for several days before beginning 24 h video and EEG (vEEG) monitoring for seizures and subsequent closed-loop seizure detection and light delivery (described in Closed-loop seizure detection and light delivery, below). On average, animals were implanted 18.6 ± 1.8 weeks after KA injection (range: 2 to 66 weeks) and the effect of light on seizures was examined starting 23 ± 2.6 weeks after KA injection. There was no correlation between seizure duration reduction and time since kainate (p = 0.99, Spearman test).
Closed-loop seizure detection and light delivery
For vEEG monitoring and on-demand optogenetic intervention, animals were connected via optical patch cords [Thorlabs, Doric Lenses; terminated in a 1.25 mm ferrule that was connected to the implanted optical fiber with a ceramic split sleeve (Precision Fiber Products)] connected through an optical commutator (Doric lenses) to a fiber-coupled diode laser (Shanghai Laser & Optics Century) of an appropriate wavelength to activate the opsin expressed (ChR2: blue = 473 nm; HR: amber = 589 nm), and through an electrical commutator (PlasticsOne) to an analog Brownlee 410 amplifier (Armstrong et al., 2013; Krook-Magnuson et al., 2013). EEG signals were digitized by an NI USB-6221-BNC digitizer (National Instruments) sampled at 500-1000 Hz, and analyzed in real-time by a PC running custom MATLAB seizure detection software.
On-line seizure detection was achieved with this custom MATLAB software, a version of which is available for download (Armstrong et al., 2013). Briefly, an experimenter identifies features of the early ictal electrographic signal to be used in triggering the real-time closed-loop seizure detection software and tunes the detector to achieve appropriate seizure detection. The experimenter selects from a number of different inclusion or exclusion criteria and adjusts thresholds to optimally detect the seizures with maximum sensitivity and specificity. The following features can be used alone or in combination to tune the seizure detection algorithm: (1) signal power properties (magnitude, rate of change), (2) spike features (amplitude, width, rate, regularity), (3) signal coastline, and (4) frequency properties (changes in energy within specific frequency bands). Note that a simple spike detection algorithm would be insufficient in this model of epilepsy. As previously described, this real-time seizure detection method, once properly tuned, is able to achieve low false positive and false negative rates (Armstrong et al., 2013; Krook-Magnuson et al., 2013).
Once tuned, the custom closed-loop MATLAB software detects seizures in real-time and triggers the delivery of laser light for 50% of events in a random fashion, allowing each animal to serve as its own internal control (in addition to opsin-negative littermate controls). Intervention consisted of 3 s of pulsed light delivery. Both short light pulses (50 ms on, 100 ms off) and longer pulses (1000 s on, 50 ms off) were investigated.
Juxtacellular recordings
In preparation for recordings, mice were implanted with a head bar, and for experiments examining the effect of light on the firing rate of Purkinje neurons, an optical fiber, while under isoflurane anesthesia. Craniotomies (∼1 mm in diameter) were later placed above the left hippocampus (ipsilateral to previous kainate injection; posterior 2.6 mm, lateral 1.75 mm), the left cerebellum (posterior 5.7-6 mm, lateral 2.3 mm), and/or the vermis (posterior 5.7-6 mm, midline), also under isoflurane anesthesia. Mice were then transferred to an 8-inch Styrofoam ball levitated by pressurized air and used as a spherical treadmill (Varga et al., 2012). Mice were allowed to recover for a minimum of 1 h before electrophysiological recordings began. During recordings, mice were freely running or resting on the treadmill. During periods of rest, the mice adjusted their posture, had their eyes open, and occasionally groomed.
Borosilicate glass long-tapered electrodes (Sutter Instruments) were pulled using a micropipette puller (Sutter P1000). An electrode (filled with 0.5 M Na-acetate, 12-20 MΩ) was lowered into either the lateral cerebellum or vermis and was used to record juxtacellularly from cerebellar Purkinje neurons (identified by the presence of complex spikes; example complex spikes are indicated in Figs. 1 and 2). For experiments with dual hippocampal and cerebellar recordings, an additional electrode was filled with 0.5 M NaCl and lowered into the hippocampus (1100-1400 µm below the dura) to record the hippocampal field potential (referred to in the text as the hippocampal EEG). Recordings were performed using an ELC-03XS universal amplifier (NPI Electronics). Recorded channels were low-pass filtered at 5 kHz and digitized at 20 kHz using NIDAQ data acquisition cards (National Instruments) and the data was recorded using custom-made recording software written in MATLAB (Varga et al., 2012). The animal’s movement was continuously video recorded, and video recordings were synchronized with electrophysiological recordings.

Lateral cerebellar intervention in PV-ChR2 mice. a, In PV-Cre animals, Cre is expressed in cerebellar neurons, including Purkinje neurons. Layers indicated: M, molecular; P, Purkinje; G, granular. b, Blue light produces action potentials in Purkinje neurons in PV-ChR2 animals (top) but not in opsin negative animals (bottom trace). c, In vivo juxtacellular recording of a Purkinje cell (black trace), illustrating an increase in firing rate (50 ms sliding window; red trace) with light delivery (blue bar). Portion of trace expanded in d is indicated by a thick black bar. d, Detected spikes illustrated by green trace. Asterisk indicates a complex spike. e, On-line detection of spontaneous temporal lobe seizures allows on-demand light delivery during the chronic phase of the disorder. f, The EEG is recorded from the hippocampus ipsilateral to previous kainate injection (KA), and light is delivered to the cerebellum. g, Example detected seizures not receiving light (top trace) and receiving cerebellar directed light-intervention (bottom). Gray bars denote seizure detection. Blue box denotes 3 s of pulsed light delivery. In opsin-expressing PV-ChR2 animals, light delivered to the ipsilateral (h) or contralateral (i) cerebellum produces a significant reduction in seizure duration, but there is no effect of light in an opsin-negative animal (j). k, Three seconds of pulsed light delivery produces a significant reduction in seizure duration in opsin-expressing animals with both short pulses (50 ms on, 100 ms off) and long pulses (1000 ms on, 50 ms off). *p < 0.05. Scale bars: a, 200 µm; b, 50 ms, 20m V; c, 1 s; 1 mV or 100 Hz change in firing rate; d, 50 ms; 1 mV or 100 Hz change in firing rate; g, 5 s, 0.05 mV.
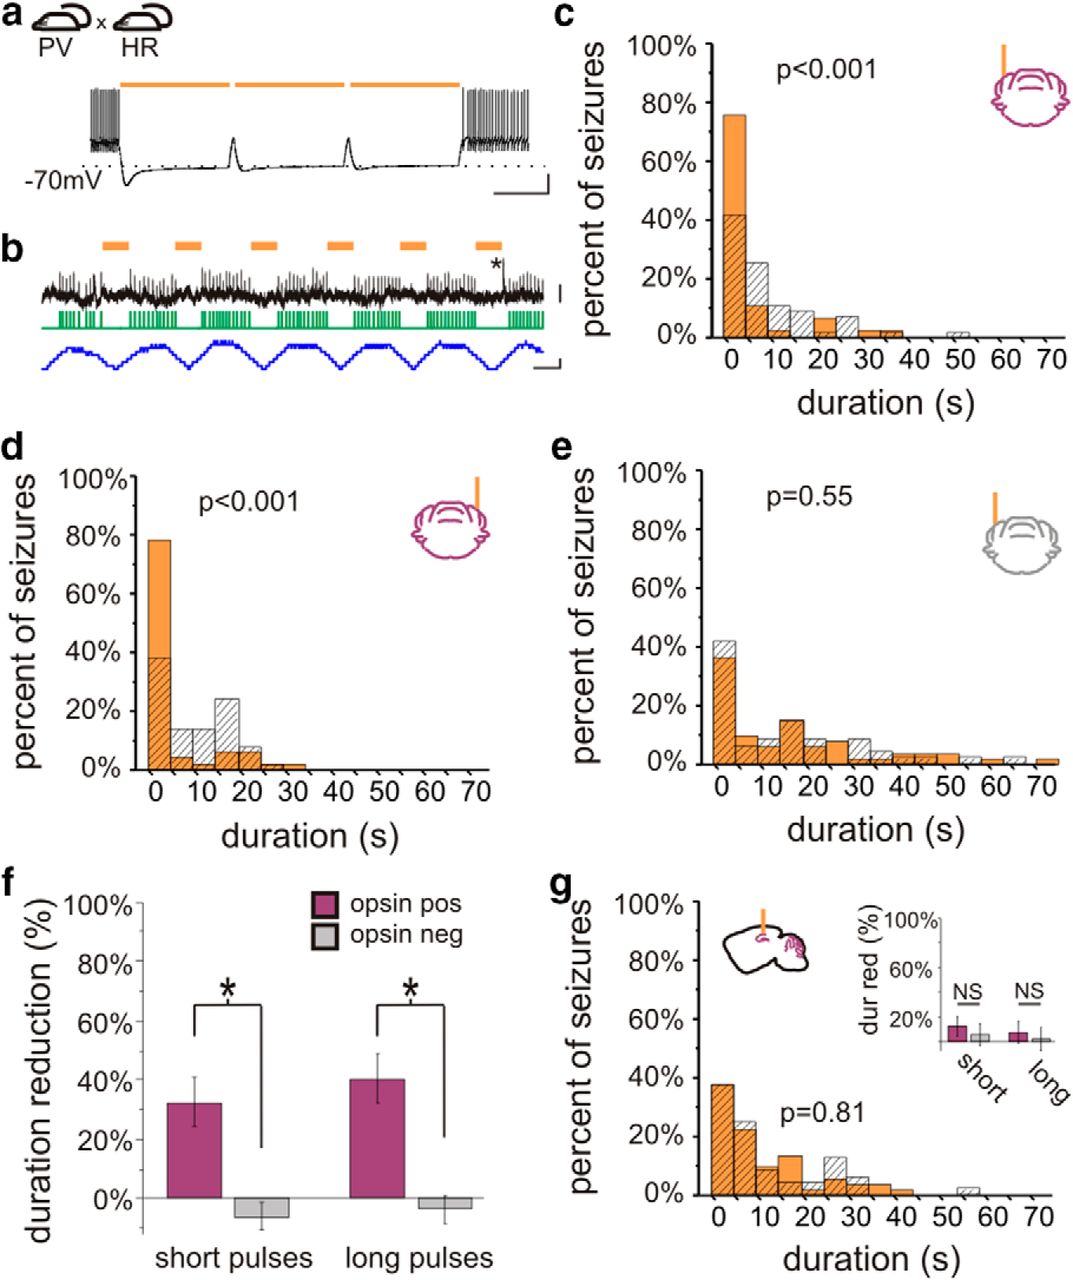
On-demand optogenetic intervention in PV-HR animals. a, Crossing PV-Cre mice with mice expressing in a Cre-dependent manner the inhibitory opsin halorhodopsin (HR) produces mice expressing HR in PV-expressing neurons, including cerebellar Purkinje cells. Light delivery to cerebellar slices from PV-HR mice produces strong inhibition, capable of inhibiting Purkinje cell firing induced by direct current injected. b, Light delivery inhibits spontaneous firing of a Purkinje cell recorded juxtacellularly in vivo. Orange bars denote light delivery. Green trace indicates detected spikes. Blue trace illustrates the change in firing frequency (50 ms sliding window). The asterisk marks a complex spike. In vivo on-demand intervention in PV-HR animals directed to the cerebellar cortex ipsilateral (c) or contralateral (d) to previous hippocampal kainate injection reduced postdetection seizure duration in opsin-expressing, but not opsin-negative (e) animals. f, Both short and long light pulses were effective at stopping seizures. g, In contrast, light delivery to the hippocampus in PV-HR animals did not affect seizure duration. dur red, Duration reduction. Scale bars: a, 500 ms, 20 mV; b, 50 ms; top, 4 mV; bottom, 100 Hz change in firing rate.
For experiments examining the effect of light on Purkinje cells, animals were connected via optical patch cords [Thorlabs, Doric Lenses; terminated in a 1.25 mm ferrule that was connected to the implanted optical fiber with a ceramic split sleeve (Precision Fiber Products)] connected through an optical commutator (Doric Lenses) to a fiber-coupled diode laser (Shanghai Laser & Optics Century) of an appropriate wavelength to activate the opsin expressed (ChR2: blue = 473 nm; HR: amber = 589 nm). Pulsed light delivery was controlled by a function generator. The effect of both short pulses of light (6.67 Hz, 33.3% duty cycle) and long pulses of light (1 Hz, 80% duty cycle) were examined.
Slice electrophysiology
Whole-cell patch-clamp recordings were made from 300-µm-thick cerebellar slices prepared in ice-cold sucrose solution containing the following (in mM): 85 NaCl, 75 sucrose, 2.5 KCl, 25 glucose, 1.25 NaH2PO4, 4 MgCl2, 0.5 CaCl2, and 24 NaHCO3. Recordings were done at 36 °C using artificial cerebrospinal fluid containing (in mM): 2.5 KCl, 10 glucose, 126 NaCl, 1.25 NaH2PO4, 2 MgCl2, 2 CaCl, 26 NaHCO3; with intracellular solution containing (in mM): 126 potassium gluconate, 4 KCl, 10 HEPES, 4 Mg-ATP, 0.3 Na2-GTP, 10 phosphocreatine, 8 biocytin; pH 7.2; 270–290 mOsm; pipette resistance: 3–4.5 MΩ. Slices were visualized with an upright microscope (Eclipse FN-1; Nikon) with infrared (750 nm) Nomarski differential interference contrast optics (Nikon 40× NIR (near infrared) Apo N2 NA0.8W WD3.5 objective with 1.5× magnification lens). Light was delivered through the epifluorscence port of the Nikon Eclipse FN-1, using a Lambda DG-4 with smart shutter and LAMDA SC controller (Shutter Instruments), and TTL input from a Digidata 1322A (Axon Instruments). After the recordings, slices were fixed in 0.1 M phosphate buffer containing 4% paraformaldehyde and 0.1% picric acid at 4 °C. Streptavidin conjugated to Alexa-594 was used to detect biocytin and visualize recorded cells. Large cells in the Purkinje cell layer were targeted for recordings, and all cells included in the analysis were recovered for post hoc analysis and showed Purkinje cell morphology.
Statistical analysis
Seizure duration after the time of the trigger and time to next seizure were analyzed off-line by reviewers blinded to the light condition and genotype of the animal. On average, 100 ± 1 events were analyzed per animal per condition. Comparisons between light and no light conditions for post-detection seizure duration and time to next seizure were compared in each animal using two-sample Kolmogorov−Smirnov and two-tailed Mann−Whitney tests. Effects on post-detection seizure duration and time to next seizure (light vs no light) were examined at the group level using Wilcoxon signed ranks test. Comparison between opsin-expressing animals and opsin-negative littermates for percent post-detection seizure duration reduction with light, and for percent increase in median time to next seizure with light, was done with a two-tailed Mann−Whitney test. Comparison of percent duration reduction and comparisons of increases in time to next seizure between conditions (Factor A: light location; Factor B: opsin expression) was made using a two-way ANOVA. Data recorded from head-fixed animals was analyzed using custom-written routines in MATLAB using the Signal Processing Toolbox. The juxtacellular recorded signal was high-pass filtered at 400 Hz, and single-unit spikes were detected after crossing a threshold manually set by the experimenter (typically between 200 and 400 μV). Superimposing all detected spikes revealed single units in all cases. The firing rate was determined in 10-100-ms-long windows throughout the recording, and firing rates during ictal and interictal periods, or between no light and light conditions, were compared using Mann−Whitney tests. The calculated average firing rates during intervention included the brief periods of no light between light pulses, and therefore reflect the net change during intervention. One cell recorded from a PV-HR animal was too deep and was excluded from analysis.
Values presented are mean ± SEM. A p value < 0.05 was considered significant. Statistical analysis was done using Microsoft Excel 2007, OriginPro 8 and 9, MATLAB, and Google documents. To estimate the power (Table 1) of the Mann−Whitney and the Kolmogorov−Smirnov tests for effects on seizure duration at the individual animal level, we used a sample size of 100 events (50% receiving intervention, similar to our actual data sets), a desired detectable difference of a 20% reduction in mean post-detection seizure duration, and assumed gamma distributions for the underlying data. Estimates of the parameters for the gamma distributions for seizure durations of events receiving light and not receiving light were based on a data set showing approximately a 20% reduction in duration with intervention. Shape (k) was estimated as the mean squared divided by the variance, and spread (θ) was estimated as variance divided by the mean. The power was then estimated by simulation, using 10,000 randomly generated data sets with the desired sample size and distribution. The power for Mann−Whitney and Kolmogorov−Smirnov tests for time to next seizure at the individual animal level, as well as changes in firing for juxtacellular recordings, was estimated in a similar manner. Power values for two-way ANOVAs are post hoc values, using the actual data sets tested, and should be interpreted as such. For those with a low power (e.g., due to little or no underlying difference), the power based on a sample size of 200 animals is also included in the Table 1 for reference. Power for group level statistics for Mann−Whitney and Wilcoxon tests were estimated via simulation, using 10,000 randomly generated data sets using Gaussian distributions, a desired detectable difference of 30%, our typical group sample size of nine, and a typical standard deviation for these data sets (20%).
Statistical table
Results
Lateral cerebellar intervention in PV-ChR2 animals
In order to gain optogenetic control over cerebellar neurons, animals expressing Cre in parvalbumin-expressing neurons (PV-Cre), including cerebellar Purkinje cells (Fig. 1a), were crossed with mice expressing the excitatory opsin channelrhodopsin (ChR2) (Boyden et al., 2005; Madisen et al., 2012) in a Cre-dependent fashion (Madisen et al., 2012), as detailed in Materials and Methods, above. Whole-cell patch-clamp recordings from cerebellar slices from PV-ChR2 mice revealed strong light-induced excitatory currents (1580 ± 140 pA, n = 14 Purkinje cells), which were capable of driving Purkinje cells to fire action potentials (Fig. 1b). No currents or depolarization were induced in cells recorded from opsin-negative animals (Fig. 1b). To examine the effect of light delivery on Purkinje cells in vivo, we additionally performed juxtacellular recordings of Purkinje cells in awake animals. The firing rate of Purkinje cells significantly increased during light delivery [p < 0.01 in 9 of 9 recorded cells with short light pulses; p < 0.01 in 5 of 6 cells with longer pulses of light; Mann−Whitneym (superscript refers to line in the Table 1) 81 ± 21% and 119 ± 48% increase in firing rate, respectively; Fig. 1c,d].
To examine the effect of cerebellar-directed on-demand optogenetic intervention on temporal lobe seizures, the unilateral intrahippocampal kainate mouse model of temporal lobe epilepsy was used. During the chronic phase of the disorder, spontaneous seizures were recorded from the hippocampus and custom-designed software provided on-line seizure detection and closed-loop optogenetic intervention (Armstrong et al., 2013; Krook-Magnuson et al., 2013) (Fig. 1e−g).
Delivery of 3 s of short pulses of light (473 nm; 50 ms on, 100 ms off) to the lateral cerebellar cortex (lobulus simplex) ipsilateral or contralateral to the site of prior intrahippocampal kainate injection produced a significant reduction in seizure duration (ipsilateral: 33 ± 9% seizure duration reduction, n = 12 animals; Fig. 1g,h; contralateral: 30 ± 15% reduction; n = 6 animals; Fig. 1i; ipsilateral vs contralateral: p = 0.12; opsin-expressing vs opsin-negative littermate controls: p < 0.05; interaction: p = 0.21; two-way ANOVAa; Fig. 1k). There was no significant change in time to next seizure with light application for either light location (ipsilateral: 18 ± 10% increase in median time to next seizure; contralateral: 24 ± 13% increase; opsin expressing vs opsin negative: p = 0.36; ipsilateral vs contralateral: p = 0.21; interaction: p = 0.45; two-way ANOVAb), indicating the absence of a rebound effect, or a long-lasting inhibitory effect on seizures with lateral cerebellar light delivery.
We next examined whether the frequency of light delivery had an effect on seizure control by using 3 s of pulsed light with longer pulses of light (long: 1000 ms on, 50 ms off, rather than the short pulse generally used: 50 ms on, 100 ms off). This intervention also inhibited seizures (ipsilateral: 32 ± 10% duration reduction; contralateral: 35 ± 10% duration reduction; ipsilateral vs contralateral: p = 0.14; opsin-expressing vs opsin-negative littermate controls: p < 0.05; interaction: p = 0.27; two-way ANOVAc; Fig. 1k). Indeed, long pulses were as efficacious at inhibiting seizure duration as short pulses (32 ± 10% vs 33 ± 9% and 35 ± 10% vs 30 ± 15%, as discussed above; location: p = 0.98; pulse length: p = 0.87; interaction: p = 0.78; two-way ANOVAd), indicating that the frequency of light pulses is not a critical factor for inhibiting seizure duration.
Taken together, these data indicate that inhibition of seizure duration is achievable by activating PV-expressing neurons, including Purkinje cells, of either lateral cerebellar hemisphere.
Hippocampal intervention in PV-ChR2 animals
It has been reported that on-demand activation of hippocampal PV-expressing interneurons can inhibit seizure duration (Krook-Magnuson et al., 2013). We therefore also examined hippocampal-directed intervention in order to directly compare cerebellar to hippocampal intervention. Similar levels of reduction of seizure duration were achieved with these two intervention strategies [3 s of short pulses, hippocampal intervention: 35 ± 5% duration reduction, p < 0.001, Wilcoxon testi, n = 14 animals; vs opsin-negative controls p < 0.001, Mann−Whitneyj; hippocampal (35 ± 5%) vs lateral cerebellar (32 ± 7%) intervention: p = 0.75, Mann−Whitneyj]. Intervention targeting the hippocampus with 3 s of long light pulses also reduced seizure duration (50 ± 9% duration reduction, p < 0.05 Wilcoxon testi). Hippocampal-directed intervention did not affect time to next seizure (short pulses: p = 0.19, Wilcoxoni; long pulses: p = 0.19, Wilcoxon testi), matching previous reports (Krook-Magnuson et al., 2013).
Lateral cerebellar intervention in PV-HR animals
We next asked if on-demand cerebellar intervention required activation of Purkinje cells per se. That is, can disruption of cerebellar activity in either direction inhibit temporal lobe seizures, or is excitation required? Could inhibition of Purkinje cells actually worsen seizures? To address this, we crossed PV-Cre animals with mice expressing the inhibitory opsin halorhodopsin (HR) (Gradinaru et al., 2010; Madisen et al., 2012) in a Cre-dependent manner (Madisen et al., 2012). Light application to cerebellar slices from PV-HR animals produced robust inhibitory currents in recorded Purkinje cells (1090 ± 100 pA, n = 8 Purkinje cells). This inhibition was sufficient to inhibit action potential firing induced by depolarizing current injection (Fig. 2a). No current or change in membrane potential was induced by light delivery to slices from opsin-negative animals (n = 9 Purkinje cells). To examine the effect of light delivery on Purkinje cells in vivo, we additionally performed juxtacellular recordings of Purkinje cells in PV-HR animals, and found that light delivery could significantly reduce Purkinje cell firing rate (p < 0.01 in 5 of 5 recorded Purkinje cells with short pulses; p < 0.01 in 5 of 5 recorded Purkinje cells with long pulses; Mann−Whitneym; 21 ± 5% and 24 ± 8% decrease in firing rate, respectively; Fig. 2b).
We then tested the effect of on-demand light delivery in vivo on spontaneous seizures, as previously done with PV-ChR2 animals. Surprisingly, 3 s of on-demand cerebellar light (589 nm) delivery in PV-HR animals also reduced seizure duration. This was true for both short light pulses (ipsilateral cerebellum: 32 ± 13% duration reduction; contralateral cerebellum: 33 ± 11% duration reduction; opsin expressing vs opsin negative: p < 0.05; location: p = 0.90; interaction: p = 0.87, two-way ANOVAk) and long light pulses (ipsilateral cerebellum: 37 ± 12% duration reduction; contralateral cerebellum: 44 ± 12% duration reduction; opsin expressing vs opsin negative: p < 0.01; location: p = 0.45; interaction: p = 0.77, two-way ANOVAl; Fig. 2c−f). We next asked if there was an effect on time to next seizure with lateral cerebellar targeted intervention in PV-HR animals. Similar to intervention in PV-ChR2 animals, short pulses of light targeting the lateral cerebellum had no effect on time to next seizure (ipsilateral: p = 1, Wilcoxoni; contralateral: p = 0.64, Wilcoxoni). These data indicate that inhibition of seizure duration is achievable with long or short pulses targeting either lateral cerebellar hemisphere in PV-HR animals. Therefore, for cerebellar directed intervention, the direction of modulation is not a critical factor for inhibition of seizure duration.
Hippocampal intervention in PV-HR animals
Given these findings with lateral cerebellar intervention, we next asked if the same would hold for hippocampal directed intervention. While PV-expressing neurons in the cerebellum include the large projection neurons of the cerebellar cortex (i.e., Purkinje cells), in the hippocampus, PV is not expressed in principal cells. Therefore, inhibition of PV-expressing neurons in the two locations has different effects on the respective networks, and may have different effects on seizure duration. Indeed, we found that on-demand optogenetic inhibition of PV neurons in the hippocampus did not affect seizure duration, regardless of pulse duration (opsin-expressing vs opsin negative, short pulses: p = 0.73, Mann−Whitneyj; long pulses: p = 0.70, Mann−Whitneyj; Fig. 2g). There was also no effect on time to next seizure (light vs no light, short pulses: p = 0.50, Wilcoxoni; light vs no light, long pulses: p = 1; Wilcoxoni). Note that intervention was of limited duration (3 s of pulsed light). This indicates that whether the direction of modulation (i.e., excitation or inhibition) is a critical factor in inhibiting seizure duration depends on the underlying circuitry (e.g., alteration of local inhibitory neurons vs altering activity of inhibitory output neurons at a distant site), with inhibition of seizure duration in PV-HR animals occurring with cerebellar-, but not hippocampal-, directed intervention.
Intervention directed to the midline cerebellum
While interventions in which light was delivered to the hippocampus or lateral cerebellum did not consistently affect the frequency of seizures, when light (3 s, short pulses) was instead delivered to the midline cerebellum (targeting the vermis) in PV-ChR2 animals, in addition to a reduction in seizure duration (39 ± 14% duration reduction p < 0.05, Wilcoxoni; n = 7 animals; Fig. 3a), there was a significant and consistent prolongation of the interseizure interval (175 ± 64% increase in time to next seizure; p < 0.05, Wilcoxoni; at the individual animal level, significant in 6 of 7 animals, p < 0.05, Mann−Whitneye), a therapeutically desirable outcome. This inhibition of seizure generation outlasted the duration of the applied light (Fig. 3b) and, for short pulses, was unique to vermal intervention (Fig. 3c). Vermal-directed intervention with long pulses also increased time to next seizure (363 ± 92% increase; p < 0.05 Wilcoxoni; at the individual animal level, significant in 6 of 7 animals, p < 0.05, Mann-Whitneye).

Optogenetic intervention targeting the midline cerebellum. On-demand optogenetic intervention with 3 s of pulsed light delivered to the midline cerebellum (vermis) in a PV-ChR2 mouse reduces seizure duration (a) and increases time to next seizure (b). Blue bars and traces indicate events receiving light. Gray indicates events not receiving light. Inset, Box and whisker plot indicating median, 25th and 75th percentiles, and 25th and 75th percentile ± 1.5 times the interquartile range. c, With 3 s of short light pulses (50 ms on, 100 ms off), there is an increase in time to next seizure with vermal directed intervention in PV-ChR2 animals. CB, Cerebellum; hipp, hippocampus; ipsilat or ipsi, ipsilateral to KA; contrlat, contralateral.
We next asked whether the effect on seizure frequency required excitation of PV cells per se, or whether disruption of vermal cerebellar activity alone could alter seizure frequency, similar to effects on seizure duration. We therefore examined the effect of midline cerebellar light delivery in PV-HR animals. Light delivery (589 nm) produced no significant effect on time to next seizure, regardless of pulse duration (percent change time to next seizure, short pulses: −10 ± 7%, p = 0.15, Wilcoxoni, n = 8 animals; Fig. 3c; long pulses: −2 ± 15%; p = 0.64, Wilcoxoni). These findings indicate that a disruption of cerebellar activity alone is not sufficient to cause a decrease in seizure frequency. Rather, the direction of modulation (excitation), as well as the location of light delivery (vermis), are critical to achieve a consistent reduction in seizure frequency (Fig. 3c).
Purkinje neurons project to the deep cerebellar nuclei (DCN). In separate experiments, we therefore targeted light delivery (3 s, short pulses) to the axon terminals of Purkinje neurons in the medial DCN (fastigial nucleus, which receives input from the medial cerebellar cortex). Targeting light delivery to the DCN in PV-ChR2 animals decreased seizure duration (27 ± 16.1% reduction) and, importantly, also increased time to next seizure (361 ± 110% increase; p < 0.01 in 5 of 5 animals; Mann−Whitneye; vs midline cerebellar cortex: p = 0.19, Mann−Whitneyj).
Selective excitation of Purkinje cells
Purkinje cells not only express PV (and thus the opsins in PV-ChR2 and PV-HR animals) but also are the sole output of the cerebellar cortex. Therefore, any intervention targeting the cerebellar cortex will ultimately have its effect through an alteration of Purkinje cell firing. Still, other neurons in the cerebellum express PV, and we therefore sought to replicate our key findings in a mouse line expressing opsins selectively in Purkinje cells. Therefore, we tested the effect of cerebellar intervention using B6.129-Tg(Pcp2-cre)2Mpin/J –ChR2 animals. While we replicated an effect on seizure duration (percent duration reduction ipsilateral: 91%, p < 0.0000001, n = 1 animal, Kolmogorov−Smirnovh and Mann−Whitneyg; contralateral: 82%, p < 0.0000001, n = 1 animal, Kolmogorov−Smirnovh and Mann−Whitneyg) and time to next seizure with vermal intervention (percent increase time to next vermis: 66%, p < 0.001, n = 1 animal, Mann−Whitneye; ipsilateral: p = 0.37, Mann−Whitneye; contralateral: p = 0.34, Mann−Whitneye), we found that expression was not selective. Crossing B6.129-Tg(Pcp2-cre)2Mpin/J with a tdTomato reporter strain revealed Cre expression in Purkinje cells, as well as in cerebellar molecular layer interneurons, deep cerebellar neurons, scattered cerebral cortex neurons, and even some hippocampal granule cells (data not shown).
We therefore obtained a second line (B6.Cg-Tg(Pcp2-cre)3555Jdhu/J; referred to here as “Pcp-Cre”), which we found to be highly specific (Fig. 4a). We performed whole-cell patch-clamp recordings from Purkinje neurons from cerebellar slices from Pcp-ChR2 animals. Light delivery produced strong excitatory currents (2040 ± 140 pA, n = 6 Purkinje cells), capable of inducing Purkinje cell firing (Fig. 4b). We then tested in vivo on-demand optogenetic intervention in Pcp-ChR2 animals. As in PV-ChR2 animals, cerebellar light delivery significantly reduced seizure duration (percent duration reduction ipsilateral: 46 ± 15%, n = 4 animals, p < 0.05 in 4 of 4, Kolmogorov−Smirnovh and 3 of 4 Mann−Whitneyg; contralateral: 49 ± 9%, n = 4 animals, p < 0.05 in 4 of 4, Kolmogorov−Smirnovh and Mann−Whitneyg; vermis: 42 ± 9%, n = 6 animals; p < 0.05 in 6 of 6, Kolmogorov−Smirnovh and Mann−Whitneyg; Fig. 4c,e). As opsins are not expressed in the hippocampus in Pcp-ChR2 animals, we predicted no change in seizure duration with hippocampal light delivery. Indeed, in Pcp-ChR2 animals, hippocampal light delivery produced no significant change in seizure duration (p = 0.15, Wilcoxoni; Fig. 4d; cerebellar vs hippocampal intervention, p < 0.05, Mann−Whitneyj). These data indicate that direct optogenetic modulation of cerebellar Purkinje cells alone is sufficient to reduce spontaneous temporal lobe seizure duration.
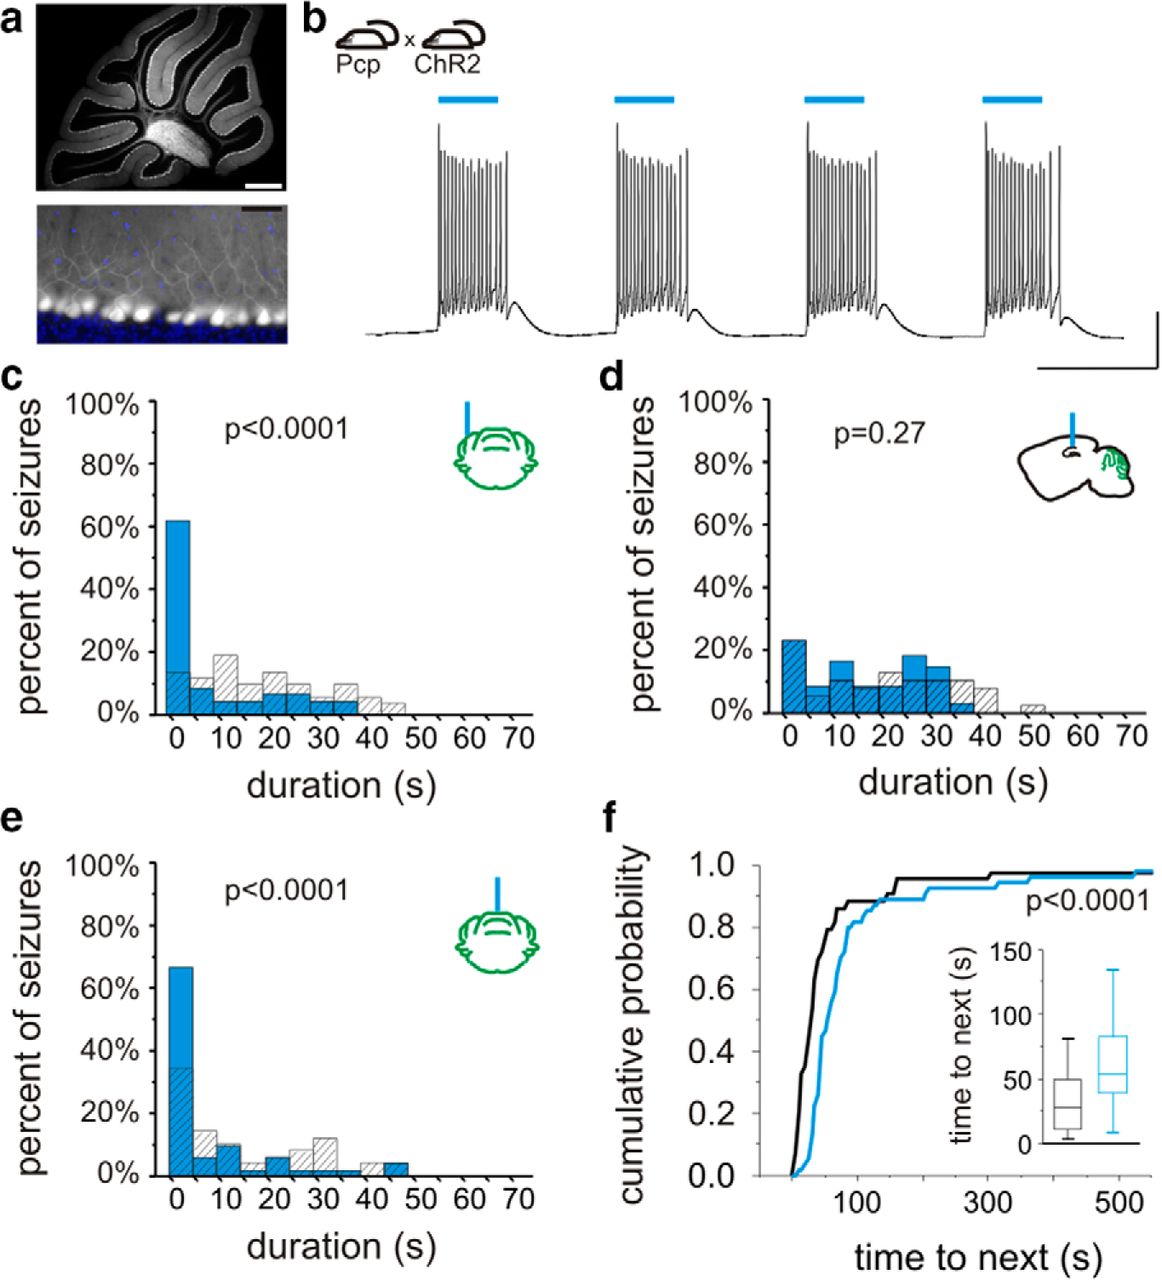
On-demand optogenetic intervention with Purkinje cell specific expression. a, In Pcp-Cre mice, cerebellar Cre is selectively expressed in Purkinje neurons. Cre expression (white) was visualized by crossing with a reporter strain. Bottom, blue, DAPI fluorescent stain. b, Crossing Pcp-Cre mice with mice expressing ChR2 in a Cre-dependent manner produces mice with ChR2 expressed selectively in Purkinje neurons. Light delivery to cerebellar slices from Pcp-ChR2 animals induces firing in Purkinje neurons. c, In vivo on-demand optogenetic intervention targeting the lateral cerebellum produces an inhibition of seizure duration. d, Light delivery to the hippocampus (which does not express opsin in Pcp-ChR2 animals) does not inhibit seizures. Light delivery to the midline cerebellum is capable of reducing seizure duration (e) and increasing time to next seizure (f). Scale bars: a, top, 500 µm; bottom, 50 µm; b, 100 ms, 20 mV.
We next examined the effect on seizure frequency of midline cerebellar light delivery in animals with Purkinje-cell-selective ChR2 expression. Intervention targeting the vermis in Pcp-ChR2 animals was able to significantly increase the time to next seizure (long pulses: p < 0.05 in 4 of 5 animals, Kolmogorov−Smirnovf and Mann-Whitneye; Fig. 4f; short pulses: p < 0.05 in 2 of 6 animals, Kolmogorov−Smirnovf and Mann−Whitneye). These data therefore support that selective optogenetic excitation of cerebellar Purkinje neurons is capable of not only reducing seizure duration, but also of inhibiting seizure induction (i.e., increasing time to next seizure).
Bidirectional functional connectivity
The above data demonstrate that cerebellar activity can modulate hippocampal activity, in that cerebellar-directed intervention can inhibit hippocampally recorded temporal lobe seizures. We additionally find that temporal lobe seizures can modulate cerebellar activity: in 17 of 24 animals, temporal lobe seizures produced a change in cerebellar EEG (Fig. 5a,b). In a subset of these animals, we recorded from Purkinje neurons (identified by the presence of complex spikes) using the juxtacellular method from awake, head-fixed animals (Varga et al., 2012). Temporal lobe seizures significantly modulated (p < 0.01, Mann−Whitneym) the firing of seven of 21 recorded Purkinje cells (Fig. 5c,d). These findings indicate that not only can the cerebellum affect temporal lobe seizures, but that temporal lobe seizures can also affect cerebellar activity; that is, there is a bidirectional functional connectivity.

Temporal lobe seizures modulate cerebellar activity. An example temporal lobe seizure recorded in the hippocampus (a), which produced changes in the cerebellar EEG (b) and in the firing rate of a juxtacellularly recorded Purkinje cell over the course of the seizure (c) as well as on a shorter time scale (d). Green trace denotes detected Purkinje cell spikes. Scale bars: a, 1 mV; b, 0.5 mV; a−c, 10 s; d, 0.5 mV or 0.1 kHz change in firing rate, 0.1 s.
Discussion
We demonstrate that cerebellar-directed intervention can inhibit temporal lobe seizures, that temporal lobe seizures can modulate cerebellar activity, and that excitation of midline cerebellar Purkinje neurons produces a decrease in seizure frequency (increase in time to next seizure). As this inhibition of seizure frequency was seen with only certain interventions, it reveals a fundamentally novel dissociation of an inhibition of on-going seizure events and an inhibition of seizure generation. Additionally, our findings are critically important from a clinical perspective, as they demonstrate that interventions targeting the cerebellum as a potential therapy for medically intractable epilepsies should be revisited.
While the cerebellum is not typically considered in temporal lobe epilepsy, there is certainly precedent for consideration of the cerebellum in epilepsies, including as a potential intervention target. For example, while relatively uncommon, seizures can arise from the cerebellum (for example, with cerebellar tumors) (Harvey et al., 1996; Mesiwala et al., 2002; Norden and Blumenfeld, 2002). Additionally, there are reports of changes in cerebellar blood flow, EEG, and unit activity during seizures (Niedermeyer and Uematsu, 1974; Gartside, 1979; Miller, 1992; Kandel and Buzsaki, 1993; Kottamasu, 1997; Blumenfeld et al., 2009). Importantly, previously there was also considerable interest in the cerebellum as a potential target to curtail seizures. However, animal studies, largely completed in the 1970s, produced mixed results, with various studies showing no effect, inhibition of, or a worsening of epileptiform activity (Cooke and Snider, 1955; Iwata and Snider, 1959; Dow et al., 1962; Mutani, 1967; Reimer et al., 1967; Mutani et al., 1969; Grimm et al., 1970; Hutton et al., 1972; Babb et al., 1974; Wada, 1974; Hablitz et al., 1975; Maiti and Snider, 1975; Snider and Maiti, 1975a,b; Hablitz, 1976; Hemmy et al., 1977; Bantli et al., 1978; Strain et al., 1978, 1979; Lockard et al., 1979; Snider, 1979; Ebner et al., 1980; Godlevskii et al., 2004). This variability may be due in part to the lack of specificity inherent with electrical stimulation or hyperthermia, and may have contributed to the decrease in interest in the cerebellum by epilepsy researchers. Importantly, on-demand optogenetics provides improved specificity of intervention. Our results demonstrate not only that the cerebellum can be an effective target for inhibition of temporal lobe seizures, but also that both the location of intervention and the direction of modulation (i.e., excitation or inhibition) can affect seizure control.
Electrical stimulation of the cerebellum has also been examined in a number of relatively small human trials (Cooper et al., 1973; Sramka et al., 1976; Van Buren et al., 1978; Levy and Auchterlonie, 1979; Wright et al., 1984; Davis and Emmonds, 1992; Chkhenkeli et al., 2004; Velasco et al., 2005). Again, however, results have been mixed. This may be due to variability in patient populations, small sample sizes (making statistical significance more difficult to achieve), and variability in stimulation parameters (for a review, including some of the complicating factors, see Fountas et al., 2010). A recent Cochrane review of three trials of cerebellar stimulation (Van Buren et al., 1978; Wright et al., 1984; Velasco et al., 2005) found that there was simply insufficient evidence to make conclusive statements on the efficacy of cerebellar stimulation (Sprengers et al., 2014). The mixed results in human studies has also contributed to the weakened enthusiasm for the potential of cerebellar-directed intervention, and despite the continued listing of the cerebellum as a potential target in reviews of electrical stimulation for epilepsy (Theodore and Fisher, 2004; Morrell, 2006; Boon et al., 2007; Karceski, 2007; Krauss and Koubeissi, 2007; Ellis and Stevens, 2008; Hamani et al., 2009; Lockman and Fisher, 2009; Saillet et al., 2009; Wyckhuys et al., 2009; Kahane and Depaulis, 2010; Lega et al., 2010; Rahman et al., 2010; Zhong et al., 2011; Tykocki et al., 2012; Fisher, 2013; Ge et al., 2013; Fisher and Velasco, 2014; Laxpati et al., 2014), relatively little recent experimental work has actually examined this topic. While our results clearly support renewed interest in the cerebellum as a potential intervention target, future translational success will require identifying the appropriate population for this intervention (e.g., perhaps patients with temporal lobe epilepsy), the appropriate location for intervention (e.g., the midline), the appropriate stimulation parameters (e.g., to activate, rather than inhibit, the midline), an appropriate sample same size, improvements in surgical procedures including device implantation (to avoid electrode migration), and possibly the implementation of an on-demand, responsive system to control the timing of intervention (Fountas et al., 2010; Rahman et al., 2010; Armstrong et al., 2013; Heck et al., 2014; Sprengers et al., 2014).
Given the specificity achievable with optogenetics, there is currently considerable interest in the use of optogenetics to study seizures and epilepsy (Tonnesen et al., 2009; Wykes et al., 2012; Armstrong et al., 2013; Krook-Magnuson et al., 2013, 2014; Osawa et al., 2013; Paz et al., 2013; Sukhotinsky et al., 2013; Berglind et al., 2014; Chiang et al., 2014). While the findings reported here could not be predicted from earlier optogenetic studies, they are certainly in line with studies indicating that the cerebellum has powerful effects on upper brain centers beyond classical motor control in both health and disease (Ivry and Baldo, 1992; Strick et al., 2009; Grimaldi and Manto, 2012; Buckner, 2013) (note, however, that this concept of a role for the cerebellum beyond motor control is also not without controversy; for example, see Glickstein, 2007). Recent work has demonstrated a cerebellar role in hippocampal spatial navigation (Rochefort et al., 2011) and disturbances in cognitive functions related to autism (Tsai et al., 2012). As in these recent studies, the precise circuits mediating the cerebellar effects on temporal lobe seizures are not yet understood. The cerebellum has many downstream targets, and plausible pathways for the robust, cerebellar−hippocampal seizure regulatory effects described here may involve the ventral lateral, central lateral, or mediodorsal thalamic nuclei (Haroian et al., 1981; Angaut et al., 1985; Bertram et al., 2008; Rochefort et al., 2013; Sinjab et al., 2013; Cavdar et al., 2014), the reticular formation (Anand et al., 1959; Elisevich et al., 1985; Verveer et al., 1997), the hypothalamus (Anand et al., 1959; Zhu et al., 2006; Soussi et al., 2014), the superior colliculus (Gale et al., 1993; Katoh and Benedek, 2003), and (directly or indirectly) the septum, amygdala, or hippocampus itself (Anand et al., 1959; Harper and Heath, 1973; Paul et al., 1973; Heath and Harper, 1974; Maiti and Snider, 1975; Snider and Maiti, 1976; Heath et al., 1978, 1980; Newman and Reza, 1979). For example, electrical stimulation of cerebellar cortex or deep cerebellar nuclei can produce evoked potentials in the hippocampus, which has been interpreted as a direct connection (Heath and Harper, 1974) or an indirect connection (e.g., via the reticular formation; Anand et al., 1959). Heath and Harper (1974) also report anatomical evidence for a direct connection, in the form of degenerating fibers in the hippocampus following lesion of the fastigial cerebellar nucleus, but this has yet to be demonstrated using more modern neuroanatomical methods (Strick et al., 2009; Rochefort et al., 2013). Similarly, there may be connections from the hippocampus to the cerebellum (Maiti and Snider, 1975; Klemm et al., 1979; Liu et al., 2012). While considerable progress clearly needs to be made in fully understanding the pathways involved in cerebellar−hippocampal interactions, our findings illustrate that this bidirectional functional connectivity can have significant consequences.
Given the prevalence of TLE, the major negative side effects of current treatment options, and the high percentage of patients with uncontrolled seizures, the need for new therapeutic approaches is clear, and our data provide strong support for reevaluation of cerebellar targeted intervention to control temporal lobe seizures.
Acknowledgments
This work was supported by NIH Grant K99NS087110 (to E.K.-M.), the Epilepsy Foundation (to C.A.), the George E. Hewitt Foundation for Medical Research (to G.G.S.), the University of California Irvine Center for Autism Research and Treatment (to I.S.), and NIH Grant NS074432 (to I.S.). We thank Cecilia Lozoya, Judit Vargane, Rose Zhu, Chris Krook-Magnuson, Sean Lew, and Dhrumil Vyas for technical support.
Footnotes
↵2 The authors declare no competing financial interests.
This is an open-access article distributed under the terms of the Creative Commons Attribution License Attribution-Noncommercial 4.0 International which permits noncommercial reuse provided that the original work is properly attributed.
References
In this issue


