

Abstract
The frontal mechanisms of motor intention were studied in dorsal premotor and motor cortex of monkeys making direct reaches to visual targets and online corrections of hand trajectory, whenever a change of the target's location occurred. This study and our previous one of parietal cortex (Archambault et al., 2009) provide a picture on the evolution of motor intention and online control of movement in the parietofrontal system. In frontal cortex, significant relationships were found between neural activity and hand kinematics (position, speed, and movement direction). When a change of motor intention occurred, the activity typical of the movement to the first target smoothly evolved into that associated with the movement toward the second one, as observed during direct reaches. Under these conditions, parietal cells remained a more accurate predictor of hand trajectory than frontal ones. The time lags of neural activity with hand kinematics showed that motor, premotor, and parietal cortex were activated sequentially. After the first target's presentation and its change of location, the population activity signaled the change of motor plan before the hand moved to the initial target's position. This signaling occurred earlier in premotor than in motor and parietal cortex. Thus, premotor cortex encodes a higher-order command for the correction of motor intention, while parietal cortex seems responsible for estimating the kinematics of the motor periphery, an essential step to allow motor cortex to modify the hand trajectory. This indicates that the parietofrontal system can update an original and not-yet-accomplished motor plan during its execution.
Introduction
The ability to make fast corrections of hand movement trajectories after changes of target location is a key feature of primates' motor behavior (Carlton, 1981; Georgopoulos et al., 1981, 1983; Soechting and Lacquaniti, 1983). Furthermore, this skillful capacity is an excellent model to study both the evolution in time of motor intention and the eventual coexistence of old and new motor plans in the brain.
Hand movements can be updated without awareness of the target's shift, such as during ocular saccades (Blouin et al., 1995), and in the absence of visual control (Pélisson et al., 1986) or limb proprioception (Bard et al., 1999; Sarlegna et al., 2006). Online corrections might rely on a nonsensory feedback mechanism based on motor outflow (Desmurget and Grafton, 2000), as well as on sensory information (Blouin et al., 1995; Desmurget et al., 1999).
In the literature, only two cell recording studies have addressed the question of online control of hand movement trajectory, the first related to motor cortex (M1) (Georgopoulos et al., 1983) and the second to posterior parietal cortex (PPC/area 5) (Archambault et al., 2009). Nothing is known about the role of the dorsal premotor (PMd) cortex, which is an anatomical interface between PPC and M1 (Johnson et al., 1996; Matelli et al., 1998; Marconi et al., 2001), for online movement control. Therefore, crucial information is missing not only on the functional role of this cortical region, but also on the timing and sequence of cortical activation (Kalaska and Crammond, 1992; Johnson et al., 1996; Westendorff et al., 2010) in the parietofrontal systems (Averbeck et al., 2009) when a change of an original movement intention occurs. Similarly, it is unknown whether and to what extent old and new motor plans can coexist in the parietofrontal system or if they are encoded sequentially.
Transient inactivation of the premotor cortex with transcranial magnetic stimulation results in a reduction of visually dependent online corrections of reaching during sensorimotor adaptation (Lee and van Donkelaar, 2006), while interfering with parietal activity compromises the trajectory adjustments necessary to move in a novel dynamic force field (Della-Maggiore et al., 2004). Furthermore, parietal lesion can result in delayed and impaired trajectory corrections when a sudden shift of target location occurs (Pisella et al., 2000; Gréa et al., 2002; Battaglia-Mayer et al., 2006). Given the corticocortical relationships within the parietofrontal networks (see Averbeck et al., 2009), it is reasonable to assume that the information used by motor cortical cells to update hand movement trajectory, at least in part, comes from PMd. The objective of the present study concerns the role of PMd and M1 in the change of motor plan, here studied through the online correction of hand movement trajectory, in comparison with that of PPC.
Materials and Methods
Animals and tasks
Two male rhesus monkeys (Macaca mulatta; body weights 5.2 and 6.0 kg) were used in the study, in accordance with the guidelines of the European (Directive 86/609) and Italian law (D.L. 116/92). The animals sat in a primate chair with their head fixed. All tasks were performed in total darkness. Monkeys performed the following tasks.
Reaching tasks
Reaches were made to visual targets in 3D space with the arm contralateral to the hemisphere of recording, under two different intermingled conditions.
Direct reaching.
Arm movements were made from a central position to one of eight peripheral visual targets, arranged at the vertices of an imaginary cube of 8.5 cm radius (Fig. 1A). The central button was mounted on a retractable rod, 17.5 cm from the animal's midline and at shoulder level, while the peripheral targets were presented by two robot arms. First, the central button turned green and the animal pressed and fixated this button for a variable control time (800–1500 ms; CT). Then, the central button was extinguished and simultaneously, one of the peripheral targets turned green. The monkeys were required to immediately reach and press the peripheral target for a variable target holding time, until a reward was delivered (500–1000 ms; THT).
Corrected reaching.
In 50% of the reaching trials, a second target was switched on either during reaction time (RT; 160 ms after the presentation of the first target) or at the onset of hand movement, while the first target was switched off. The second target was presented either to the opposite vertex of the cube (at 180°), or to one adjacent (at 90°) and immediately to the left (for right targets), and vice versa for left targets. Thus, we had (1) 2 possible times of target switch; (2) 2 possible locations where the second target could have been presented relative to the first one, which was instead presented at 8 different spatial locations. Therefore, the monkey's behavior was tested in 32 (2 × 2 × 8) types of corrected reaches, in addition to the 8 direct ones.
The different direct and corrected trials were presented randomly and repeated only after the completion of the entire set of 40 trials. For each of the corrected trials, we had 5–7 repetitions, while the direct reaches were repeated 20–28 times, to maintain an equal proportion (50%) of direct and corrected reaches.
In both reaching conditions, the monkeys were free to move their eyes in a natural fashion, therefore to look at the peripheral targets when they appeared.
Saccade tasks
After the reaching tasks, the monkey performed two eye movement tasks similar to those described above. These tasks were used as controls, with the goal of identifying the influence of eye-related signals on neural activity recorded in the reaching tasks. During these trials, the monkey was required to constantly press and hold the central button.
Behavioral control
The switching of lights, the movement of the robots, and the time of button press and release were controlled through custom-made software. Eye position was recorded by using an implanted scleral search coil (1° resolution) and was sampled at 200 Hz (Remmel Labs). Fixation accuracy was controlled through circular windows (5° diameter) around the targets. Arm position was recorded in three dimensions using an opto-electronic system (Optotrak, Northern Digital) with a sampling frequency of 100 Hz. A tight-fitting sleeve endowed with markers was placed on the monkey's forearm. The recorded data were used for offline reconstruction of hand movement trajectories.
Neural recording
The activity of single neurons was recorded with extracellular electrodes (glass-coated tungsten-platinum fibers; 1–2 MΩ impedance at 1 kHz), using a 7-channel array (Thomas Recording). By using seven dual time-amplitude window discriminators (Bak Electronics), it was possible to record up to 14 cells simultaneously. Usually, collection of neural and behavioral data was started when the action potentials of at least five cells were isolated.
Reconstruction of hand trajectories
Hand trajectories were reconstructed for each recording day. The relationship between hand position and the markers placed on the monkey's forearm was calculated using a known reference point, i.e., the static hand position on a fixed peripheral target at the end of movement. This operation was then applied to all other data points. The location and orientation of a rigid body in space is determined by three sets of coordinates. In our setup, we had six markers. To calculate with high accuracy the position of the forearm (and therefore of the hand), we used an algorithm based on singular value decomposition, which makes use of the redundant information, in the least-square sense (Söderkvist and Wedin, 1993). This method allows the optimal calculation of the position and orientation of the forearm (6 degrees of freedom) from 6 sets of coordinates (18 degrees of freedom). The resultant hand trajectories were then smoothed using a 5-point triangular filter.
Behavioral epochs
The interval during which the monkey held the central button and the time elapsing from the presentation of the peripheral target to the onset of hand movement were defined as the central holding time (CHT) and RT, respectively. The onset and end of arm movement time (MT) were determined as the times when the monkey released the central button and pressed the peripheral one, respectively. The time of change in the direction of hand movement (hand switch) during corrected trials was determined by first calculating the mean and confidence interval of the hand trajectory to each of the eight targets in the x, y, z coordinates, over all direct reaching trials. The 95% confidence interval was obtained using the bootstrap statistics. Then we compared each corrected trajectory with the mean direct reach trajectory to the same target, and the time of trajectory change was defined as the first of a series of three points exiting its confidence interval in any of the x, y, or z coordinates.
For the eye, the angular velocity was first derived from the position signals. The onset or offset of the saccade was taken as the first of a sequence of three points exceeding or falling below a threshold of 50°/s, respectively.
Cell classification
To classify cells as hand- or eye-related, we compared the modulation of neural activity across tasks (reaching and saccade tasks) and movement conditions (direct and corrected). The classification was based on the use of modulation indices obtained across different tasks and epochs, as well as on bootstrapping procedures (Archambault et al., 2009). See supplemental material (available at www.jneurosci.org) for details.
Spike density function and onset of cell activity
A spike density function (SDF), or the time-varying cell activity, was computed for each cell and each movement condition, by first aligning the timing of spikes to the onset of hand movement time in the respective trial. Spikes were then replaced by a Gaussian function with total area of 1 and width (SD) of 30 ms. This resulted in a continuous signal, which was then normalized by the number of trials, to generate the SDF, with a sampling time of 10 ms, for each cell and movement condition.
The SDF was used to determine the onset of cell activity following the presentation of the first peripheral target. The mean SDF activity during the last 300 ms of the central holding time epoch was used as reference activity. A significant increase or decrease in the SDF with respect to its reference value was identified using a cumulative sum change-point analysis (Armitage, 1975). The SDF starting from the reaction-time epoch was integrated (cumulative sum), and the point at which the sum exited a positive or negative boundary, determined using α = 0.01 (Armitage, 1975), was taken as the onset of activity. This analysis was performed separately for each cell and movement condition.
Modeling of neural data
Neural activity of hand-related cells was modeled in different ways, as follows.
Linear regression of cell activity
We performed a linear regression of each cell's activity recorded during MT of the reaching task with the corresponding hand kinematics [for details, see Moran and Schwartz (1999) and Archambault et al. (2009)]. The following linear regression model was used:
 where SDF represents the spike density function, X→(t) is the hand position vector, V(t) is the speed (magnitude of velocity vector), D→(t) is the instantaneous hand direction vector, and Δt is the time lag. The regression was applied to kinematics and neural data from each 10 ms bin and over all movement conditions simultaneously (for a total of ∼3400 points = ∼85 points/condition × 40 conditions). The overall time interval used the MT epoch, plus a fixed 300 ms before its onset, as well as 300 ms after its offset The regression analysis was repeated by introducing a time lag in the cell activity, from −250 to +250 ms, in increments of 10 ms. For each time shift, the linear regression coefficients and statistics were calculated, and the shift yielding the highest value of R2 was selected as the delay for that cell. This procedure was performed using all 40 hand task conditions. As a further analysis, this regression model was repeated separately using trials corresponding to either only direct or only corrected reaches. A two-way ANOVA was used to assess significant differences of the goodness of fit (R2) across areas (factor 1) and across the three different models (factor 2) that were obtained using the different types of reach trials (direct reaches only, corrected reaches only, and both direct and corrected reaches). The statistics had the purpose of testing whether the strength of the relation between neural activity and kinematics and the timing depended on the cortical area considered, as well as evaluating whether the correction of hand trajectory (therefore a change of motor plan) influenced the goodness of fit.
Computation of the “neural trajectory”
For the computation of the neural trajectory, we used the indirect optimal linear estimator (OLE) method described by Wang et al. (2007). Applied to our data, this analysis assumes a linear relationship between cell activity and hand position, speed, and movement direction. Briefly, using the OLE method, we computed a decoding matrix based on the inverse of the linear regression parameters. The activity of each cell (spike density function) was shifted in time according to the delays computed in the regression analysis. The neural activity as well as the hand kinematics were then time-normalized to a fixed number of bins (32 for direct reaches and 44 for corrected reaches conditions, corresponding to the respective mean movement time). A matrix of neural activity was made for each movement condition and multiplied by the decoding matrix to obtain the estimated kinematics parameters. Of these, the estimated hand velocity and direction were used to construct a neural trajectory. Thus, the decoding algorithm allowed us to map the activity of all cells in one brain area to a trajectory in 3D space. Applying this decoding matrix to activity recorded for each target location and movement condition yielded a single neural trajectory for that case. A Pearson correlation analysis was then performed between “neural” and real trajectories to evaluate how well the former predicted the latter. Although recordings were made on different days, hand movement trajectories were very stable, with low variability. Thus, for comparison with the neural trajectory, the real trajectory was taken as the average of all recorded hand movements in a particular condition. A two-way ANOVA (factor 1: cortical area, factor 2: task condition) was used to assess significant differences of the Pearson correlation coefficients (r), across different brain areas and between direct and corrected reaches.
Reconstruction of neural activity patterns of corrected reaches from direct ones
Previous studies on motor (Georgopoulos et al., 1983) and parietal (Archambault et al., 2009) cortex based on a double-step task similar to the one presented here have shown that cells in these areas change their activity pattern in such a way that neural modulation after the target jump and during hand movement to the second target is qualitatively similar to that observed when the hand makes a single movement from the center to the second target. This observation was used in our study as a starting point to perform additional quantitative analyses.
A regression analysis was used to reconstruct the neural activity in the corrected reaches from that observed during the direct reaching conditions. We first matched the double-peak hand speed profile in the corrected reaches with the two single-peak speed profiles taken from the corresponding direct reaches. For example, if the monkey had to correct a reach from target 1 to target 8, we used the direct reaching trials to 1 and 8. Taking only the kinematics relative to hand movement time, we placed the two direct reach trials tip-to-tail and varied the delay between them. The delay yielding the maximum correlation between the two combined velocity profiles and the velocity profile in the corrected reach was calculated. The reverse procedure was then applied to the spike density functions: the spike density functions for the direct reaches were placed tip-to-tail with a delay calculated from the hand velocity profiles. The correlation between the resulting curve and the actual spike density function in the corresponding corrected reach was then calculated. This analysis was performed separately for each target in the reaching task.
In a further analysis, we compared neural activity related to each corrected movement with a randomly selected pair of direct reaches. For example, a corrected movement from target 2 to target 7 could be matched with direct movements to targets 1 and 8, etc. We then compared the regression coefficients obtained by matching the spike activity with either the correct or the random pairs of direct reaches (paired t test). As an additional test, because the initial part of movement in direct and corrected reaches to the same (first) target is identical, we repeated the analysis by matching the second part of the corrected reach with a randomly selected direct reach, maintaining the initial part correctly matched.
Finally, a two-way ANOVA was performed to evaluate the degree of similarity of cell activity associated with the two submovements (m1 and m2) in the corrected reaches with that associated with the similar direct reaching movement. Submovement m1 was defined as the first part of movement directed toward the first target, i.e., that observed from MT onset to hand switch, while m2 was the one from hand switch to the end of MT (directed to the second target after the correction of hand trajectory). Therefore, for each cell, the mean firing frequency of m1 and m2 was compared to the one calculated during MT of direct reaches, pairing similar directions. In this analysis, direction of hand movement and task condition were considered as factors. Cells were judged as displaying no difference of neural activity in the two task conditions compared if the task term was not significant (p > 0.05).
Change of cell activity following the change of movement plan
We were interested in measuring at the cell population level the time of change of neural activity following the change of motor plan, signaled by the appearance of the second target in the corrected reaches. Therefore, the divergence in the population spike density function (pop-SDF) between the direct and corrected reaching tasks was computed. The pop-SDF was calculated from hand-related cells by replacing each spike with a unit Gaussian with SD of 10 ms, sampled at 100 Hz. The signals were then averaged over all trials for all cells of each monkey. To account for the variations in the activity of individual neurons with respect to the direction of hand movement, first the preferred target direction was defined as the one eliciting the maximal cell's mean firing frequency during reaction time and movement time of direct reaches, then we realigned each cell's data to its preferred target direction before computing the pop-SDF.
To determine the time of divergence in the population activity between the direct and corrected reaches, the 95% confidence interval of the pop-SDF for the direct reaches trials was first calculated. The time of divergence was defined as the first of a series of three points in the spike density function of the corrected trials that exited this confidence zone. To assess that the results thus obtained were statistically significant across areas, a bootstrap resampling was done in the following fashion: (1) a random sampling of 120 hand-related cells was performed in each area; (2) for each sample of cells, the population activity in the preferred and anti-preferred directions were computed for direct and corrected trials in each condition (target jump at RT, MT, 90°, 180°); (3) the time of divergence of neural activity associated with direct and corrected reaches was computed in each of the four conditions, then the average value was derived; and (4) this procedure was repeated 1000 times to generate a distribution of times of divergence. The three distributions were compared using a nonparametric test (Kolmogorov–Smirnov, p < 0.01).
Results
Behavioral data
In a typical trial, monkeys made direct reaches in 3D space to visual targets presented by two robot arms at the vertices of an imaginary cube (Fig. 1A). In 50% of the trials, during the reaction time or at the onset of the hand movement, the original target was extinguished and a second target was presented at an adjacent (90°) or opposite (180°) location (Fig. 1B).

Experimental apparatus, behavioral data, and region of neural recording. Monkeys performed direct reaches (A) or made hand movement corrections of 90° or 180° (B), starting from a central position to peripheral targets arranged at the vertices of a virtual cube. Lit targets were positioned by two robot arms in total darkness. C, The same apparatus was used for the eye tasks. In this example, the target “jumps” from position 7 to the opposite position 3, and the monkey first fixates the central light, then makes a saccade to target 7 and finally to target 3. D, Examples of hand movement trajectories in different direction of direct reach trials. E, Examples of corrected reaches when a change of intention occurs, from target 8 to target 1. The hand path originally directed to the first target reverses toward the second one after its presentation during RT (green) or at the onset of MT (blue). F, The eye movement trace refers to saccade when the target change (from 1 to 5) occurred during the reaction time. The monkeys always complete the saccade toward the first target before moving the eyes to the second one. G, Velocity profiles. Hand (thick curves) and eye (thin curves) speed profiles. The data refer to velocity profiles during direct reaches (red) and when the second target was presented during reaction time (green) or at the onset of movement time (blue). Triangles refer to the times of target presentations in different reaching conditions: direct reaches with a single target (red) and corrected reaches with presentation of two consecutive targets with target jump occurring during reaction time (green) or at the onset of movement time (blue). H, Microelectrode penetrations in the dorsal premotor, motor, and parietal cortex superimposed on a common brain figurine. AS, CS, IPS, and LS indicate arcuate, central, intraparietal, and lunate sulci, respectively.
During direct reaches, the hand trajectory was slightly curved in all movement directions (Fig. 1D). During online corrections, the hand moved to the first target and then smoothly curved toward the second one (Fig. 1E). The hand path to the second target was shorter when this was presented during the reaction time than when it was presented at the onset of hand movement (Fig. 1E). In a control task used to assess the relationship between eye saccades and cell activity (Fig. 1C), contrary to what was observed for the hand, the saccade to the first target was completed before the eye could move to the second target (Fig. 1F).
The hand described a typical bell-shaped velocity profile (Fig. 1G) characterized by a single peak during direct reaches, and by two peaks during online corrections, with intervening accelerating and decelerating phases. The velocity profile of hand movement to the first target was similar during direct reaches and online corrections, while the corrected movement toward the second target (second peak of the blue and green curves in Fig. 1G) was normally much faster then the one observed during direct reaches.
During direct reaches, hand RT to target presentation was 305 ms (±28, SD) for data collected from PMd, and 346 ms (±24, SD) when recording from M1. Behavioral data relative to PMd collections were similar to those obtained during PPC recording, for which an RT = 300 ± 24 ms was obtained. During online corrections, the RT to the first target was similar to that observed during direct reach, while the RT to the second target (defined as the time elapsing from the target jump to the moment of change of hand trajectory) was shorter by about 40–70 ms than that observed toward the first target. In particular, we obtained 261 ± 30 ms (SD) for the PMd dataset, 282 ± 36 ms for the M1 dataset, and 280 ± 34 ms for the PPC dataset. In the reaching task, the RT of the saccade to the first target was significantly shorter (mean: 208 ± 24 ms across areas; ANOVA, p < 0.001) than that of the hand and did not change across task conditions.
When the hand movement trajectory was updated, the duration of the movement toward the first target depended on the interval between the time of presentation of the first and second targets, and was shorter (ANOVA, p < 0.001) when the second target was presented during reaction time (PMd set, 121 ± 37 ms; M1 set, 171 ± 44 ms; PPC set, 146 ± 45 ms) than at the onset of hand movement (PMd set, 235 ± 21 ms; M1 set, 273 ± 22 ms; PPC set, 249 ± 35 ms), both at 90° or at 180°.
Neural data
We performed extracellular recordings from 119 neurons located in the dorsal premotor cortex (PMd; area 6 or F2) and 155 neurons in the motor cortex (M1, area 4) of two left hemispheres of two monkeys while these performed the task described above. The frontal and parietal areas where the microelectrode penetrations were made are superimposed on a single representation of the brain in Figure 1H. The parietal data (Archambault et al., 2009) were obtained from 250 cells studied in the superior parietal lobule (area 5, PE/PEc) (Fig. 1H).
Hand-related cells were identified by comparing the neural activity during the hand reaching tasks with that during a similar task involving eye movements only (Archambault et al., 2009). Eighty-six of one hundred nineteen cells (72%) in PMd cortex and 128/155 (83%) in M1 were classified as hand-related cells, since they exhibited a greater modulation of activity during the reaching task than during the eye-only task. This proportion was 70% for cells studied in the parietal cortex (Archambault et al., 2009).
Patterns of neural activity in frontal cortex
Figure 2 shows the neural activity of a premotor (A) and of a motor (B) cortical cell in the form of SDFs (thick curves) during direct (blue and green) and corrected (light blue and light green) reaches, in all tested directions of movement. In this case, the target jumped at the beginning of MT in the opposite direction (180° shift) relative to the first target (in each cube, a schematic representation of the corresponding hand trajectory is reported). Under each SDF plot, the corresponding speed profiles (thin curves) detected during the neural data collection are shown. The neural activity was modulated in an orderly fashion by speed and direction (R2 = 0.55 PMd; R2 = 0.56 M1) of hand movement, and in both examples led the changes of hand kinematics (100 ms PMd; 160 ms M1). In the corrected reaches, the activity associated with the initial movement toward the first target was virtually identical to that observed in the directed reaches to the same target, as can be noticed by comparing the light and dark blue SDFs and the light and dark green SDFs, before the target jump (white triangle, 0 ms). Initially, these pairs of activities in fact do correspond to the preparation of movement toward the same targets. An increase in the gain of neural activity was often observed during the second submovement of the corrected reaches relative to that recorded during direct reach in the same direction. This is evident when contrasting the light green and light blue SDFs after the target jump with the SDFs associated with the direct reaches toward the same target, i.e., blue and green, respectively. This phenomenon can be explained on the basis of the observed modulation of cell activity by hand speed. In fact, the movement segment occurring after change of direction was normally much faster then the one observed during direct reaches in the same direction, as shown by the velocity profiles.

Neural activity of a premotor (A) and of a motor (B) cortical cell studied during direct reaches and online corrections after target jump at MT onset. Neural activity is shown as SDF (thick curve) for all types of tested movement directions (blue and green direct reaches in opposite directions, light blue and light green corrected reaches, in the directions shown schematically in the corresponding cube). Below each SDF, the relative hand speed profiles (thin curves) recorded during the collection of these cells are shown, with the same temporal alignment. On the x-axis, the triangles indicate the mean time of first (black) and second (white) target presentation, the vertical line at 0 ms indicates onset of hand movement, and the other broken line indicates the mean time of change of hand movement direction.
Relationship between cell activity and hand kinematics
The relationship between neural activity of hand-related cells and kinematics variables, such as hand position, speed, and movement direction, was studied through a multiple linear regression analysis. For each cell, a single regression model accounted for activity in all the directed and corrected reaching movements. The analysis was performed at different time lags between cell activity and hand kinematics. In both PMd and M1, all cells displayed a significant (p < 10−3) relationship between kinematics and neural activity. The number of data points in the regression analysis was so large (n ≈ 3500) that an R2 = 0.1 was statistically significant at p < 0.01 level. We observed a continuum from low to high regression values, with a mean R2 of 0.35 in PMd, and of 0.38 in M1, in both cases similar to what was previously reported (0.31) for PPC. Figure 3 displays the distribution of the temporal lags yielding the highest regression coefficient. In the frontal lobe, the modulation of activity of most cells (M1: 80% PMd: 59%) led the variations in hand kinematics, while for a smaller proportion the changes in cell activity followed the changes of kinematics (mean lag: −70 ms for M1; 0 ms for PMd). Instead, in parietal area PE, the activity of the majority (65%) of cells followed the onset of movement (mean lag: +57 ms). When the three areas were compared, the modulation of cell activity in M1 occurred significantly earlier than in PMd and PPC (Kolmogorov–Smirnov test, p < 10−3).

Cumulative frequency distributions of the temporal lags corresponding to the best correlation between neural activity of hand-related cells in motor (green), premotor (red), and parietal (blue) cortex and kinematics variables included in the multiple linear regression analysis.
Furthermore, we compared the goodness of fit of the regression model, derived from all trial conditions, when this model was applied separately to direct and corrected reaches. The model was significantly better at explaining cell activity associated with direct (mean R2: 0.48 for PMd; 0.38 for M1) than corrected reaches (mean R2: 0.38 for PMd; 0.32 for M1). For both frontal areas, a paired t test confirmed that the R2 values were generally higher during direct reaches, when the hand movement ended at its originally intended destination, as previously observed in the parietal cortex (Archambault et al., 2009).
We have repeated the multiple linear regression analysis to derive two additional models, each using hand-related cell activity recorded either during direct or during corrected reaches only. The regression results (R2 and time lag between cell activity and hand kinematics) were then compared (Fig. 4). A two-way ANOVA showed a significant effect (p < 0.01) of the type of trials used in the regression on the R2 values (Fig. 4A). A post hoc comparison (Tukey, p < 0.01) indicated a higher mean correlation when using direct reaches only (R2 ≈ 0.60), rather than either corrected reaches only or all trials (R2 ≈ 0.35). Moreover, no differences in R2 values were observed across cortical areas (p > 0.05). The optimal lags (Fig. 4B) between cell activity and kinematics were also slightly, but significantly, affected by the type of trials used in the regression (two-way ANOVA, p < 0.01), with mean lag ∼25 ms shorter when considering corrected reaches than the one obtained for direct reaches (Tukey post hoc, p < 0.01). However, the ordering of cortical areas, as assessed by mean lag value, remained the same, regardless of which type of trials was used in the regression analysis (i.e., M1 < PMd < PPC).

Goodness of fit of multiple linear regression across areas and types of reaching trials. Mean R2 values (A) and mean time lags (B) obtained for different areas (PMd, red; M1, green; PPC blue) and for different trials included in the regression (direct, corrected, direct+corrected). Error bars indicate SD.
Neural trajectories
The validity of the kinematics regression model was also assessed by computing the predicted hand trajectory, based on the recorded neural activity of hand-related cells and the regression model described in the previous section. In other words, we used a linear and unweighted combination of each cell's activity to compute a “neural trajectory” from the regression parameters (Fig. 5A). The neural and real hand trajectories were compared using a correlation analysis (Pearson correlation coefficient, r). A quantitative analysis (Fig. 5B) shows that in the frontal and parietal areas, the correlation between “neural” and real trajectories was high during direct reaches (mean r of 0.83 for M1, 0.71 for PMd, and 0.82 for PPC). When the original motor plan was changed, and therefore the hand reach was corrected, a drop of the correlation between predicted and real trajectories was observed in both frontal and parietal cortex (mean r of 0.40 for M1, 0.22 for PMd, and 0.54 for PPC). Correlation was significantly higher in PPC. This was assessed through a two-way ANOVA (factor 1: cortical area; factor 2: task condition) on the correlation between real and neural trajectories. The statistical test showed a significant effect (p < 0.01) of factors 1 (area) and 2 (task condition) and of their interaction. Post hoc comparisons (Tukey) were performed between corrected and direct reaches, for each brain area. This analysis indicated that r was higher for direct than for corrected reaches in both frontal areas (M1 and PMd, p < 0.05). There was, however, no such difference in PPC (p > 0.2), suggesting a special role of the former in online adjustments of hand movement. The decrease in correlation from one movement condition to another could be a consequence of, and therefore evidence for, the interference occurring when new information coexists with an original motor intention and calls for its change.

“Neural” trajectories. A, Comparisons of “neural” and real hand trajectories in premotor (PMd), motor (M1), and parietal (PPC) cortex for particular types of corrected reaches. For PMd and PPC, the trajectories correspond to corrections from target 4 to target 5 (with target jump occurring during reaction time), while for M1, the hand path corresponds to movement directed first to target 7 then to target 2 (with target jump at the onset of movement time). B, Distribution of the Pearson correlation coefficients (r) between real and neural trajectories, during direct (left) and corrected (right) reaches, for different areas.
Cell activity during trajectory corrections can be reconstructed from that of direct reaches
In both monkeys, we had noticed that fitting the hand speed profiles of corrected reaches with those of corresponding direct reaches, after placing them tip-to-tail and matching the same directions of movements, yielded a high correlation (mean r = 0.74, Pearson). Therefore, for hand-related cells, we tested whether cell activity during the change of movement direction necessary to update hand trajectory, let's say from target 1 to target 8, could be reconstructed from the activity observed during direct reaches from the initial hand position to target 1 and from the initial hand position to target 8. Figure 6 shows examples of cell activity in PMd and M1 during trajectory correction, obtained by splicing together the spike density functions associated with corresponding directions of movement of the direct reaches, with a delay calculated by matching the speed profiles. For the cells on the left, the examples refer to the target jump (second target) during the reaction time, on the right to second target at the movement onset. The mean correlation between the reconstructed and actual SDFs averaged over all trajectory corrections was high in both M1 (mean r = 0.66) and PMd (mean r = 0.67). A similar value had been obtained in PPC (mean r = 0.60). Thus, the online correction of hand movement trajectory was implemented through an evolution of neural activity from the pattern associated with the first movement direction to that associated with the second one, as observed during direct reaches originating from the center of the workspace. The mean of the distribution of the correlation values between reconstructed and real neural activity from all cells was 0.66 in M1, 0.67 in PMd, and 0.63 in PPC.

Predicting cell activity during trajectory correction from the activity associated with the direct reaches. Shown is the overlap of single-cell activity observed during hand movement correction (black SDF), after change of final target (for example, from 4 to 5), with that obtained by combining, tip-to-tail, the two spike density functions (gray SDF) associated with direct reach trials toward the same targets (for example, 4 and 5). The figure illustrates activity of the premotor and motor cell shown in Figure 2, in two task conditions, i.e., target change during RT (left) or at onset of movement time (right), aligned to the presentation of the first target. The numbers indicate the target sequence. The vertical dashed line represents the time of truncation of cell activity for the first direct reaching movement. Behavioral events are indicated as follows: 1st tg, time of first target presentation; 2nd tg, time of second target presentation; MTon, movement-time onset; HS, time of switch of hand movement direction.
These results were validated by comparing each condition of trajectory correction with a randomly selected pair of direct reaches. For example, a movement trajectory to targets 2 and then 7 could be matched with direct reaches to targets 1 and 8, etc. The regression coefficients obtained in such a way were significantly lower than those obtained when using the appropriate pairs of movements (paired t test, p < 10−6), with mean value of 0.58 in M1, 0.54 in PMd, and 0.46 in PPC.
As an additional verification, because the initial part of movement in direct and corrected reaches to the same (first) target is identical, we repeated the analysis by randomly matching only the second part of the corrected reach with any direct reach. The initial part was correctly matched. Again, as in the previous analysis, the regression coefficients were significantly lower (paired t test, p < 10−6) than those resulting after appropriate match of the second movement.
Finally, a two-way ANOVA was also performed to test directly how similar the responses in the two submovements were relative to those performed in the direct reaches. In frontal cortex, almost 50% of the cells that were selected for analysis displayed no significant (p > 0.05) difference of neural activity across reaching types (46% in PMd and 47% in M1). The same analysis showed that in 77% of the studied PPC cells, the activity during corrected reaches could be reconstructed from that associated with the two direct reaches involved.
Signaling the time of target onset and change of movement trajectory
The computation of onset times of neural activity of hand-related cells in the parietofrontal system (Fig. 7A) shows that in both frontal and parietal cortex, the earliest activity can be detected at ∼60 ms after target presentation. Similar results were obtained when only eye-related cells were analyzed. However, the cumulative representation indicates that the distributions of the onset times are significantly different (Kolmogorov–Smirnov test, p < 10−4) across areas, indicating variations in the time of recruitment of different populations. In fact, 50% of the PMd cells were recruited within ∼120 ms after target presentation, while the same was true at 180 ms in M1 and at 200 ms in PPC. It is also evident that when half of the motor and parietal cells began discharging (at ∼180 ms), almost all premotor cells (77%) were already recruited. No significant differences in the onset times values emerged when comparing the distributions obtained with hand- versus eye-related cells separately (Kolmogorov–Smirnov test, p < 0.05). This temporal lead of PMd cells was also evident when considering the distributions of the time of divergence of cell activity obtained by comparing activity during direct versus corrected reaches (Fig. 7B,C). It can be seen that when the second target was presented during the preparation (reaction time) of the reach to the first one (Fig. 7B), the divergence in activity occurred at ∼140 ms for 50% of the PMd cells, thus signaling the future change of movement trajectory. This is 50 ms earlier than M1 (190 ms) and 70 ms before PPC (210 ms), for the same proportion of cells. Virtually identical results were obtained when the second target was presented at the onset of the hand movement (Fig. 7C).
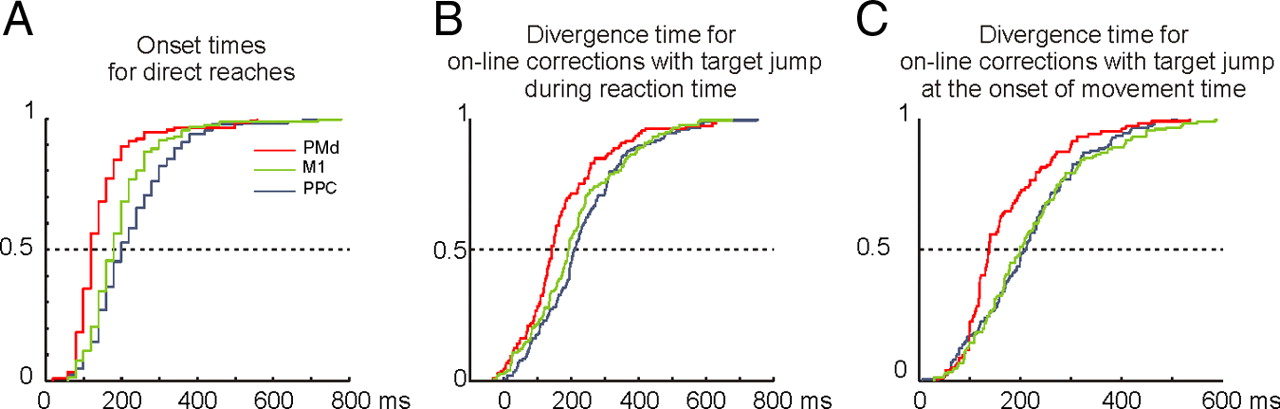
A, Cumulative frequency distributions (CFDs) of the onset times of cell activity of hand-related cells after first target presentation. B, C, CFDs of the divergence times, i.e., the times when cell activity in the corrected reaches diverged from that observed during direct reaches, after second target presentation during the reaction time (B) and (C) at the onset of movement time. The three curves in each plot refer to the different populations of neurons (PMd, red; M1, green; and PPC, blue).
When looking at the relationship between the goodness of correlation of neural activity with hand kinematics and that with the latency data, we have found that the R2 values of the multiple linear regression were negatively and significantly correlated (p < 0.01) with the onset times of neural activity. In fact, cells with better fit with hand kinematics tended to have shorter latencies relative to the first target presentation. However, no correlation has been found between R2 and divergence times.
Evolution of population activity: direct reaches versus online corrections
For this analysis, the pop-SDF was computed under the different task conditions. For direct reaches (Fig. 8A), we have used the neural activity of each cell at its preferred direction. In this and following panels, the onset of the hand movement coincides with the left end of the horizontal bar. It can be seen that after target presentation, the pop-SDF increased in both the frontal and parietal lobe, but with a different onset time across areas, since it was earlier in PMd (∼270 ms before MT onset) than in M1 (∼220 ms before MT onset) and PPC (∼170 ms before MT onset), as it was also observed through the cumulative distribution shown in Figure 7A. It is worth noticing that while the peak of the activity occurred at a similar time in the frontal areas, and coincided with the onset of hand movement, its decay was earlier in frontal than in parietal cortex, where activity outlasted that observed in the frontal lobe, thus providing continuous signaling about movement execution.

Temporal evolution of the population activity of hand-related cells in the parietofrontal system across task conditions. A, pop-SDF for direct reaches calculated at the preferred direction (PD) of each cell for three cortical areas (PMd, pink; M1, green; PPC, blue). B, Comparisons of pop-SDF of the neural activity recorded during direct reaches (faint colors) versus corrected reaches (bright colors), when the target jumped during RT (left column) or at the onset of movement time (right column). For the online corrections, the pop-SDFs were obtained by combining single-cell activity of hand movements directed first toward the target opposite to the PD (anti-PD) and then to the PD. This activity is compared to direct reaches toward the first target (anti-PD) to depict the time the two population activities diverge. Each panel refers to a particular cortical area, as indicated within each graph. In both A and B, the triangles indicate the times of target presentation, while the horizontal bars indicate the mean duration of movement time, for direct reaches (gray) and for corrected reaches (black). The time scale is aligned to the onset of hand movement (0 ms). The vertical dashed lines indicate the time at which neural activity in corrected reaches significantly diverges from that of the direct reaches, while the mean time of change of hand trajectory is indicated by the vertical solid line.
In the case of change of motor plan (Fig. 8B), we have considered the activity observed when the first target was located at the cell's anti-preferred direction (the target diagonally opposite to the preferred one) and the second was at the preferred direction. These comparisons were performed when the target signaling the change of direction was shown either during reaction time (Fig. 8B, left column) or at the onset of movement time (Fig. 8B, right column), in PMd, M1, and PPC.
As expected, after a slow initial increase of the pop-SDF associated with hand movement to the anti-preferred direction, the cells' activity significantly diverged from that of the direct reaches, due to a sharp increase associated with the hand movement to the preferred direction. In the frontal cortex, the divergence between pop-SDF in corrected and direct reaches in PMd led, while that in M1 coincided with, the onset of hand movement to this target, when the second target was presented during the hand reaction time (Fig. 8B, left column). In the parietal cortex this signal occurred shortly after (60 ms) the movement onset. This implies that when the hand was ready to move to the first target, the population activity in the frontal cortex already signaled the future correction of movement toward the second target's location. The divergence occurred, as expected, later when the second target was presented at the onset of hand movement (Fig. 8B, right column).
Across areas, when the presentation of the second target was used as a reference point, the time of divergence of the population activity, relative to the presentation of the second target, occurred earlier in PMd (80 ms) than in M1 (140 ms) and PPC (194 ms), when the second target was presented during the hand reaction time. This latency decreased when the target jumped at the movement onset (70 ms, PMd; 107 ms, M1; 127 ms, PPC). The different times in the parietofrontal network in signaling the change in hand trajectory are also evident looking at the divergence time with respect to the time of hand switch. When the target jumps during reaction time, PMd cells lead motor and parietal ones, divergence of activity occurring 190 ms before the switch in movement direction in PMd, 130 ms in M1, and 60 in PPC (Fig. 8B, left). A similar time order is observed when the target jumps at the beginning of movement time (Fig. 8B, right). A bootstrap resampling analysis with a nonparametric comparison (see Materials and Methods) confirmed that these differences across areas were statistically significant (Kolmogorov–Smirnov, p < 0.01). Figure 9 displays the distributions of divergence times between corrected and direct reaches, obtained after random resampling within each area, calculated pooling together the four correction conditions. These distributions clearly show how the time of signaling the correction of movement was earlier in PMd cells, followed by M1 and then PPC.

Distributions of divergence times obtained after a bootstrap procedure, by random resampling of hand-related cells within PMd (red), M1 (green), and PPC (blue). The times were calculated by comparing the direct versus corrected reaches in the four correction conditions. Notice that the time of signaling of movement update is earlier in PMd cells, followed by M1 and PPC.
It is also worth noticing that since recording from the three areas was performed during different experimental sessions, each area has its own behavioral data, associated with the neural activity. Behavioral times were very similar in the case of recordings from PMd and PPC (as an example, RT was 305 ± 28 ms in PMd and 300 ± 24 ms in PPC); during recording from M1, we observed slightly longer RTs (RT = 346 ± 24 ms). Furthermore, these times showed a low variability within in each recording session (SD of reaction times ranging from 24 to 28 ms). Therefore, to rule out the possibility that the differences in time relative to the behavior data could have had some influence on the temporal relationship between neural activity and behavior for different cortical areas, we repeated the population divergence analysis, selecting for each area only trials that had similar reaction times (i.e., 280 ms < RT < 360 ms). Using trials chosen under this constraint, we found that the time ordering of the population activities within the three cortical areas remained exactly the same.
Finally, it is worth noticing that when comparing the relative neural timing via a regression model on the movement kinematics, the ordering of PMd and M1 changed from that obtained when considering the time of signaling of the first or second target presentation, as illustrated above. The possible reason for this difference and its implications will be dealt with in the Discussion section.
Discussion
Control of hand trajectory
Natural hand movements unfold undisturbed toward their final destination, most commonly a visual target. When the target location suddenly changes in space, the hand trajectory is smoothly updated without undue delay. Thus, an initial motor intention can be modified at any time, since the command network for the hand control is continuously accessible to visual information during movement planning and execution. Under these conditions, neural activity in PMd, M1, and PPC (Archambault et al., 2009) encodes the hand's kinematics (Kalaska et al., 1989; Ashe and Georgopoulos, 1994; Moran and Schwartz, 1999; Wang et al., 2007).
The change of the original motor plan did not result in a recruitment of a specialized population of frontal cells, but was rather achieved by a graded utilization of the abstract variables already encoded by neural activity, i.e., hand speed, position, and movement direction. In fact, by taking into account these variables and neural activity from premotor, motor, and parietal cortex, it was possible to generate “neural trajectories” that well matched the real ones performed by the animal. When a new motor intention interfered with the old one, calling for a change of movement direction, the predictive power of neural trajectories, while dropping to some extent in these areas of the network, remained higher in the parietal than in the frontal cortex. Therefore PPC seems preferentially involved in the implementation of the online adjustment of hand trajectory, as compared to the PMd and M1.
Furthermore, as previously found in PPC (Archambault et al., 2009), in both the premotor and motor cortex the neural activity associated with the change of hand path traveled by the hand toward the first and then the second target was well predicted from that associated with the two movement paths described by the hand during direct reaches (see also Georgopoulos et al., 1983) to the same targets. Thus, encoding a complex hand trajectory simply emerges from the same mechanism subtending the movements that are segments of the overall trajectory.
Finally, the results of the relation between neural activity and hand kinematics, particularly those of the regression analysis, together with the study of the evolution in time of the population activity in motor, premotor, and parietal cortex, provided information relevant to the timing of change of neural activity relative to the task events in the network.
Relative timing of M1, PMd, and PPC during control of hand movement
The analysis of the time lag of cell activity with the encoded kinematic variables across the parietofrontal system shows that in premotor, motor, and parietal cortex, the cell activity can either lead or follow the changes of hand kinematics. However, based on the longer lead time, and therefore earlier changes of activity, observed for motor as compared to premotor and parietal cortex, it is reasonable to assume that the motor command that actually moves the hand is issued first in M1. However, when we evaluated the time of signaling the target location and that concerning the correction of the hand trajectory in the population activity, PMd cells were activated earlier than M1 and PPC. This suggests that the higher-order command to start the change of hand path is encoded first in premotor, then in motor or parietal cortex. We believe that this is not contradictory, since the two analyses provide complementary information. This apparent contradiction can be easily reconciled. In fact, the regression analysis offers an evaluation of the time relationships of neural activity with hand kinematics (position, speed, and movement direction) over an extended period of time, spanning the entire duration of the trial. On the contrary, the onset time of neural activity detects a precise moment in time when the population activity starts signaling the target presentation or the correction of movement trajectory. This time-leading role of premotor cortex has been observed in other studies, although in different task conditions (Kalaska and Crammond, 1992; Johnson et al., 1996; Pesaran et al., 2008; Westendorff et al., 2010).
Since the target presentation that calls for a movement initiation or its correction is at the same time a visual signal and an instruction to move, the difference in the timing of signals during the correction could be potentially explained by the timing of encoding visual signals in the network. However, we believe that this is not the case since premotor cells are sensitive to visual signals mostly when these call for a future movement, their activity being neither purely sensory nor strictly motor (di Pellegrino and Wise, 1993). Therefore PMd is activated earlier, relative to M1 and PPC, since the task conditions change so as to require a concurrent change of motor plan.
This order in the timing of activation of PMd, M1, and then PPC was preserved in the different task conditions. When the second target was presented during the reaction-time period of the first target, the population activity signaled the new target location, and therefore the future hand trajectory, well before the onset of hand movement to the first target. Then, at a time that depended on the interval between the first and second target's presentation, the hand moved toward the first target, although the central command mechanism encoding the correction of trajectory was already at work. When the second target was presented at the onset of hand movement to the first one, the change of the population activity was detected later and closer to that of movement trajectory.
By comparing the results of these analyses, it can be hypothesized that M1 plays a more direct and earlier role in providing precise control of hand kinematics on an ongoing basis, whereas PMd provides an earlier command signal to update the motor output when environmental conditions and the overall motor plan change, as when a second target is presented at a variable interval after a first one. At the same time it could be concluded that, thanks to presence of forward signals and their combination with sensory feedback information, the latter more influential in area PE than in PMd and MI, parietal cortex contributes to the estimate of the limb kinematics. This is an important step to optimize the updating of the motor command, so as to bring the hand to the new destination before it starts to move or is moving toward the original target location. This interpretation is further supported by the fact that in humans, lesions of the superior parietal lobule result in errors in the estimate of the limb's state (Wolpert et al., 1998).
Parallel versus sequential processing of current and future motor intentions
The results of this study might provide an answer to the long-debated question (Telford, 1931; Welford, 1952, 1959; Bertelson, 1966; Georgopoulos et al., 1981) as to whether the CNS can process different motor information in a parallel fashion. Translated into our experimental design, this question refers to the potential coexistence of neural signals about the execution of hand movement along a given path with those concerning the planning of a different trajectory. Since the persistence of a hand movement toward an “old” target requires an underlying active neural process, i.e., an appropriate level of neural activity (at least in both motor cortex and spinal interneurons) necessary to overcome gravity, it can be speculated that, in the time interval occurring after second target presentation and before the trajectory correction, the initial and the updated plans of movement can be encoded in a parallel fashion within the network, while the two movements are represented sequentially, later on. The overlap of the two processes (movement execution in one direction and planning in a different one) seems to occur in all the studied nodes (PMd, M1, and PPC) of the network, although it is implemented in a different way, as shown by the different timing of signaling the change of motor intention. Therefore, the results of this study suggest that the parietofrontal system can update a not-yet-accomplished motor plan during movement execution. This is reminiscent of other studies showing that cell activity in the premotor cortex can be related to two potential targets during the delay period (Cisek and Kalaska, 2002), and in parietal cortex can encode in a parallel fashion two motor goals, related to two sequential intended reaches (Baldauf et al., 2008). A study performed in humans came to the same conclusion (Mochizuki et al., 2005). Thus, concerning the change of motor intention, there is no sign of a central, “neural” refractory period in the parietofrontal system, as an underpinning of the one described by psychological studies (Welford, 1952, 1959).
The reciprocal nature of the corticocortical connections among the frontal and parietal areas (Caminiti et al., 2005) further suggests that what is described in our study as an apparent sequential mode of operation at different nodes of a distributed system is in reality the result of a recurrent dynamics. Within the network, different neural populations in each area are selectively recruited during the time elapsing from the composition of the original motor plan to the change of motor intention and, finally, of the hand's trajectory.
Footnotes
P.S.A. was a postdoctoral fellow (2003–2005) of the Canadian Institutes of Health Research, supported in part by the Ministry of University and Scientific Research (MIUR) of Italy. This work was supported by the MIUR of Italy. We are very grateful to Prof. Roberto Caminiti for his critical evaluation and support at all stages of this study.
- Correspondence should be addressed to Prof. Alexandra Battaglia-Mayer, Dipartimento di Fisiologia e Farmacologia, Sapienza–Università di Roma, Piazzale Aldo Moro 5, 00185 Rome, Italy. alexandra.battagliamayer{at}uniroma1.it


