

Abstract
Microarray expression profiles reveal substantial changes in gene expression in the ipsilateral dorsal horn of the spinal cord in response to three peripheral nerve injury models of neuropathic pain. However, only 54 of the 612 regulated genes are commonly expressed across all the neuropathic pain models. Many of the commonly regulated transcripts are immune related and include the complement components C1q, C3, and C4, which we find are expressed only by microglia. C1q and C4 are, moreover, the most strongly regulated of all 612 regulated genes. In addition, we find that the terminal complement component C5 and the C5a receptor (C5aR) are upregulated in spinal microglia after peripheral nerve injury. Mice null for C5 had reduced neuropathic pain sensitivity, excluding C3a as a pain effector. C6-deficient rats, which cannot form the membrane attack complex, have a normal neuropathic pain phenotype. However, C5a applied intrathecally produces a dose-dependent, slow-onset cold pain in naive animals. Furthermore, a C5aR peptide antagonist reduces cold allodynia in neuropathic pain models. We conclude that induction of the complement cascade in spinal cord microglia after peripheral nerve injury contributes to neuropathic pain through the release and action of the C5a anaphylatoxin peptide.
Introduction
Peripheral neuropathic pain typically presents with symptoms of spontaneous pain, pain in response to normally innocuous stimuli (allodynia), and an exaggerated response to noxious stimuli (hyperalgesia) (Woolf and Mannion, 1999; Dworkin et al., 2003). A particularly prominent feature of neuropathic pain is cold allodynia (Lindblom and Verrillo, 1979; Verdugo and Ochoa, 1992). Neuropathic pain results from any of multiple peripheral nerve lesions including compression, trauma, infection, metabolic disorders, toxin exposure, and autoimmune disease (Dworkin et al., 2003). Peripheral nerve damage drives a variety of changes in both the peripheral and CNS to produce pain. In the CNS, peripheral nerve injury results in amplified sensory transfer (central sensitization) attributable to augmented synaptic transmission between primary sensory and dorsal horn neurons, an increase in descending facilitatory influences from the brainstem, and a loss of inhibitory transmission in the spinal cord (Woolf and Salter, 2000; Waxman, 2001; Scholz and Woolf, 2002; Coull et al., 2003; Gebhart, 2004; Inoue et al., 2004; Scholz et al., 2005).
Several rodent partial peripheral nerve injury models have been developed to help study the mechanisms responsible for neuropathic pain. Among these are the spared nerve injury (SNI) model, in which two of the three peripheral branches of the sciatic nerve are transected, producing a distal partial nerve lesion (Decosterd and Woolf, 2000); the chronic constriction injury (CCI) model, in which loose ligatures cause compression and inflammation of the sciatic nerve, injuring mainly myelinated axons (Bennett and Xie, 1988); and the spinal nerve ligation (SNL) model, a proximal axonal injury model (Kim and Chung, 1992). All models generate prolonged peripheral hypersensitivity to noxious and innocuous mechanical and cold stimuli.
Many of the mechanisms responsible for neuropathic pain involve changes in mRNA levels because of altered gene expression or transcript stability. After complete transection of the sciatic nerve, hundreds of genes undergo altered expression in the dorsal root ganglion (DRG) when examined at a single time point (Costigan et al., 2002; Wang et al., 2002), and some of these are regulated over time (Xiao et al., 2002). In the dorsal horn of the spinal cord, gene expression also occurs after peripheral nerve injury, and studies of the global changes in gene expression after two different partial nerve injury models, L5 nerve root ligation and L5 spinal nerve transection, suggest that there is relatively little overlap in the gene expression between these models, although both produce tactile allodynia (Lacroix-Fralish et al., 2006). The extent to which changes in gene expression in the dorsal horn differs or is common across diverse peripheral neuropathic pain models is not known. In an effort to better understand the molecular mechanisms of neuropathic pain and to identify targets for potential novel analgesics, we performed a large-scale expression profile analysis in the dorsal horn, in three neuropathic pain models (SNI, SNL, and CCI) and five time points (0, 3, 7, 21, and 40 d). We find from this analysis that induction and action of the complement cascade in microglia contributes to neuropathic pain.
Materials and Methods
Animal surgery.
Three separate experimental groups were prepared for the microarrays: SNI, CCI, and SNL (Bennett and Xie, 1988; Kim and Chung, 1992; Decosterd and Woolf, 2000). Adult male Sprague Dawley rats were anesthetized using isoflurane. For SNI, the tibial and common peroneal branches of the sciatic nerve were ligated with a silk suture and transected distally, whereas the sural nerve was left intact. For CCI, three chromic gut sutures were loosely placed around the sciatic nerve at midthigh level. For SNL, an incision was made over the L4/L5 lumbar vertebrae, the transverse processes were removed on one side, and a spinal nerve (L4 or L5) was tightly ligated (Kim and Chung, 1992). All procedures were performed in accordance with the Massachusetts General Hospital (MGH) animal care regulations.
Tissue preparation, RNA extraction, and chip hybridization.
The ipsilateral lumbar L4 and L5 dorsal horn was dissected and rapidly frozen. The tissues were homogenized, and total RNA was obtained by acid phenol extraction (TRIzol reagent; Invitrogen, Carlsbad, CA). Biotinylated cRNA for hybridization was produced from the total RNA and hybridized to the Affymetrix (Santa Clara, Ca) RGU34A chip (Costigan et al., 2002). For each condition, three biologically independent hybridizations were performed, each using cRNA probes produced from independent RNA samples extracted from pooled tissue from five animals.
Data analysis.
CEL files were produced using MAS 5.0. All other data analysis was done using R software (R Development Core Team, 2005). Background correction and quantile-quantile data normalization were performed, followed by calculation of probe set intensities using the RMA (robust multiarray average) method (Bolstad et al., 2003; Irizarry et al., 2003) [www.bioconductor.org (Gentleman et al., 2004)]. To assess reproducibility, the correlation coefficients between all possible pairings of single chips within a triplicate were calculated. The weakest of the three correlation coefficients was used to represent that triplicate, with the worst within-triplicate correlation coefficient throughout the full data set still better than 0.97. The iteratively reweighted least-squares regression method was used to estimate expression level (Venables and Ripley, 2002; Diaz et al., 2003). The regression model treated time points (3, 7, 21, 40) as nested within the type of nerve injury (SNI, CCI, SNL). After estimating the expression level, Sammon's nonlinear mapping was implemented on the matrix of Euclidean distances between pairs of conditions using the MASS R library (Venables and Ripley, 2002). Bootstrap p values associated with contrasts between SNI and naive, CCI and naive, and SNL and naive for each gene were calculated by resampling from the residuals of the original model. The threshold p value consistent with a false discovery rate (FDR) near 5% was identified as 0.01 (Storey and Tibshirani, 2003), based on an estimate of the overall proportion of true null hypotheses derived from the observed distribution of p values. The q-value calculation was performed separately for each injury, and an overall p-value threshold of 0.01 was selected because it resulted in a q value near 5% for each model (SNI, 5.4%; CCI, 4.6%; SNL, 2.3%). In addition to the p-value threshold, we required that the expression ratio relative to naive averaged over the four postinjury time points reach at least 1.25-fold when converted to a linear scale, for a gene to be considered differentially expressed. Note that we have previously published a 1.5-fold cutoff with a p value of 0.05 (t test) (Costigan et al., 2002). Because the data are derived from five time points in this study (vs two in the previous study), we reduced the fold change cutoff for regulated gene identification to permit inclusion of transiently regulated genes, or genes with a consistent but relatively low magnitude of regulation. Furthermore, those genes quoted in the text of this study all displayed common regulation across three different pain models.
The temporal behavior of groups of genes was also assessed graphically. The data for each probe set meeting the criteria for regulation were scaled to mean zero, root mean square 1 over the data for a single model (Tavazoie et al., 1999). The scaled data were then grouped using k-means cluster analysis (Hartigan and Wong, 1979). The number of clusters was chosen empirically, by finding the elbow in the plot of the total within cluster sum of squares as a function of cluster number. The means of the k-means clusters were grouped using divisive hierarchical clustering (Kaufmann and Rousseeuw, 1990). For Venn diagram analysis, the number of genes regulated in a given condition was adjusted using the UniGene database such that multiple probe sets corresponding to the same gene were only counted once.
Quantitative real-time-PCR.
Quantitative real-time (RT) PCR was performed using the Sybr green detection system with primer sets designed on Primer Express. Specific PCR product amplification was confirmed using the dissociation protocol. Transcript regulation was determined using the relative standard curve method per the manufacturer's instructions (Applied Biosystems, Foster City, CA). Relative loading was determined before RT with RNA spectrophotometry, followed by gel electrophoresis and post-RT by amplification of glyceraldehyde-3-phosphate dehydrogenase. For each time point, four samples of pooled tissue from two rats were analyzed.
In situ hybridization.
Tissue was rapidly removed, embedded in Tissue Tek OCT (Sakura, Torrance, CA), and frozen. Sections were cut serially at 18 μm, and in situ hybridization histochemistry was performed using digoxygenin-labeled antisense riboprobes (0.6–2 kb in length) (Blackshaw and Snyder, 1997). For fluorescent in situ hybridization, we perfused the animals transcardially with 4% paraformaldehyde, dissected the spinal cord, and collected transverse cryosections (10 μm) of the L4 dorsal horn. We detected the hybridized riboprobes using Fab fragments from an anti-digoxigenin antibody conjugated to horseradish peroxidase (Roche, Basel, Switzerland) and a tyramide signal amplification kit (Invitrogen). Primary antibodies were rabbit anti-rat Iba1 (1:750; Wako, Richmond, VA), anti-mouse NeuN (1:2000; Chemicon, Temecula, CA), and rabbit anti-GFAP antibody (1:300; Chemicon). Fluorescent images were acquired either by using a Nikon (Tokyo, Japan) Eclipse E800 microscope or by confocal laser-scanning microscopy as described previously (Brenner et al., 2004)
Immunohistochemistry.
Terminally anesthetized rats were perfused with 0.9% NaCl, followed by 4% paraformaldehyde with 0.025% picric acid in PBS. Twelve micrometer frozen sections were prepared, blocked for 1 h, and incubated for 24 h in 1% BSA with 0.1% Triton X-100 in PBS, with primary antibody [i.e., 1:1000 goat anti-rat C3 (MP Bio, Irvine, CA), 1:750 rabbit anti-rat Iba, 1:50 mouse anti-rat C5aR (R63; Hycult Biotechnology, Uden, The Netherlands), 1:100 Griffonia simplicifonica isolectin IB4 conjugated to FITC (Sigma-Aldrich, St. Louis, MO)]. Colocalization was performed using sequential application of each pair of primary and secondary antibodies. Fluorescent Alexa secondary antibodies were obtained from Invitrogen.
Primary microglial cell cultures.
Cerebral cortices from postnatal day 1 C57BL/6 mice were dissected, digested, and mechanically dissociated. Cells were plated in RPMI 1640 medium, 10% FBS, 5 mg/ml granulocyte macrophage colony-stimulating factor. After 14 d, microglial cells were dislodged by shaking at 220 rpm for 2 h. Microglial cells settled from the resulting suspension and were washed extensively with RPMI medium. This produced purified microglial cultures (≥99%), assessed by staining using antibodies against microglial markers Iba1 and CD11b (1:1000, rat anti-mouse AbD; Serotec, Raleigh, NC), with negative immunoreactivity against GFAP (astrocytes), NeuN (neurons), and myelin basic protein (oligodendrocytes) (data not shown).
Animal behavior.
Cold allodynia was assayed by applying a drop of acetone to the plantar hindpaw and measuring the time the animal spent licking, shaking, or lifting the paw within the first 20 s (Decosterd and Woolf, 2000). C5-deficient Hc0 mice and congenic controls were obtained from The Jackson Laboratory (Bar Harbor, ME). C6-deficient rats were supplied from the colony maintained by G.L.S. (Bohle and Stahl, 2004). For C5a intrathecal injection, an indwelling spinal catheter (Recathco, Allison Park, PA) was preimplanted 3 d before injection. C5a in saline or saline alone were injected intrathecally (C5a; 10 or 100 ng single 20 μl injection). Results for both paws were averaged. The C5a receptor (C5aR) antagonist, a synthetic cyclic AcF-[OPdChaWR] peptide, was produced by the MGH peptide core and stored at −80°C (0.5 mg/ml PBS and 5% ethanol) (Clark et al., 2006). A catheter (32 gauge; Recathco) was implanted into the intrathecal space of the vertebral column with its tip at the lumbar (L3–L5) level through a cisternal incision. The catheter was connected to an osmotic minipump (model 2002 delivering 0.5 μl/h for 14 d; Alzet, Cupertino, CA) containing antagonist in PBS [200 ng/ml, approximately 10 times the peptide ED50 concentration (March et al., 2004)]. Control catheters contained PBS alone. Primary baseline behavior was performed on day −1, before catheter and pump placement. Secondary baseline behavior was performed on day 0, before SNI surgery. Ten days after surgery therefore represented pump day 11.
Results
Expression profiles after peripheral nerve injury
We used oligonucleotide microarrays to measure changes in mRNA expression in the dorsal horn in the SNI, CCI, and SNL peripheral nerve injury models. The three models produced a very similar pattern of pain hypersensitivity (data not shown). We used multidimensional scaling (Fig. 1 a) to assess the relationships between the global expression profiles of the models at the different time points. A priori, these analyses had three possible outcomes: no clustering, clustering according to time point, or clustering according to neuropathic pain model. The global expression profiles represent an average of the triplicate data for all probe sets on the Affymetrix RGU34A array. Displaying the distance matrix in two-dimensional space (Fig. 1 a) showed the dorsal horn data formed three distinct groups, one for each model. Time is, therefore, a less important contributor to the degree of similarity in global transcriptional regulation than the type of injury to sensory neurons, which differ by location (proximal SNL, distal SNI), numbers of primary sensory neurons with injured axons (almost all SNL, ∼40% CCI and SNI), and presence of substantial perineural inflammation (CCI).

Global expression profiles in neuropathic pain models. A , Multidimensional scaling display of the dissimilarities among the microarrays. Axes are in arbitrary units derived such that the distance between each pair of points in the XY plane is the most accurate possible representation of the Euclidean distance between the expression levels of all the genes measured on the corresponding pair of microarrays. SNI (red circles), CCI (green squares), and SNL (blue triangles) data are shown with time points as indicated. B , Venn diagram showing the number of regulated genes meeting fold difference and statistical thresholds in each model (SNI, CCI, or SNL). C , Temporal expression patterns of genes regulated in neuropathic pain models within the dorsal horn. Each gene was normalized according to mean 0, SD 1 and subjected to k-means clustering. The increased relative expression level is shown by increasing darkness.
We defined regulated genes using criteria of p < 0.01 and an overall fold difference from naive of >1.25 (see Materials and Methods). The p-value threshold was selected using an FDR control method (Storey and Tibshirani, 2003). The numbers of regulated genes within the dorsal horn for each model and combination of models is shown in Figure 1 b and are identified in supplemental Table 1 (available at www.jneurosci.org as supplemental material). To group the regulated genes according to change in expression over time within each model, we used a two-step clustering method (Hartigan and Wong, 1979; Kaufmann and Rousseeuw, 1990; Diaz et al., 2003).
Figure 1 c illustrates the time course of relative expression of the regulated genes for each model. Changes typically either peaked at 3 d, with rapid recession to near-naive values, or showed a sustained pattern of altered regulation over the full time course (Fig. 1 c). More genes were upregulated than downregulated, with the proportion downregulated varying according to the injury model. The genes regulated in all three neuropathic pain models were grouped according to functional class (supplemental Fig. 1, available at www.jneurosci.org as supplemental material). The largest group consisted of genes associated with immune function (Fig. 2). Other functional gene classes regulated in all three models included neurotransmission, signal transduction, transcriptional regulation, and the cytoskeleton (Fig. 2 and supplemental Fig. 1, available at www.jneurosci.org as supplemental material).

A , Distribution of commonly regulated genes according to functional class. B , Genes related to immune function regulated in neuropathic pain models in the dorsal horn. Data shown for each gene are SNI (red circles), CCI (green squares), or SNL (blue triangles) after injury. Each plot is on a log base 2 scale, with the origin zero equivalent to onefold (nonregulation). The rat gene abbreviation, the maximum difference from the origin on the log base 2 scale, and conversion to linear scale are as indicated beneath each plot. Genes are sorted according to peak upregulation. C1qb, C1qg, C3, and C4 complement components; Aif1, Allograft inflammatory factor 1 (Iba1); Ctss, cathepsin S; Ctsh, cathepsin H; CCR5, C-C chemokine receptor 5; Ifngr, interferon-γ receptor 1; Cx3cr1, chemokine (C-X3-C motif) receptor 1.
Induction of complement genes in the dorsal horn
We screened the commonly regulated genes for members of the same signaling pathways as means to detect potential key functional contributors to the pain phenotype. We have previously used a similar approach in the DRG that identified the contribution of the tetrahydrobiopterin synthesis cascade to the peripheral generation of neuropathic pain (Tegeder et al., 2006). Four genes encoding three complement components (C1qb, C1qg, C4, and C3) were among the immune genes regulated in the arrays across all three models (Fig. 2). C1qb and C3 were also the most highly regulated transcripts across all genes assayed, averaged over all time points and models (supplemental Table 2, available at www.jneurosci.org as supplemental material). Therefore, we decided to direct attention to the possible involvement of the complement cascade (Fig. 3 a) in neuropathic pain hypersensitivity. Relatively recent data by Twining et al. (2005) implicates complement in neuropathic pain using intrathecal treatment with sCR1 (soluble complement receptor 1). This study did not investigate the cellular origin of the cascade or the complement effector pathway responsible, however.

A , Complement cascade and major effector mechanisms. B , Expression by in situ hybridization of the complement genes C1qb, C4, and C3 in naive spinal cord and spinal cord 3, 7, and 40 d after SNI. Inset, The number is fold difference from the microarrays. Scale bar, 100 μm.
The spatial localization of C1qb, C3, and C4 mRNA expression in the dorsal horn after nerve injury was characterized by in situ hybridization (Fig. 3 b). The expression pattern for these complement genes closely matched the temporal regulation observed in the array data. We also validated by in situ hybridization the upregulation of these genes in the dorsal horn of SNL and CCI animals at 7 d (data not shown).
Expression of complement genes in microglia
All three of the complement components expressed in the dorsal horn after peripheral nerve injury were found only in myeloid cells, as identified by colocalization with the microglial marker Iba1 (Imai et al., 1996) and the absence of coexpression with either a neuronal (NeuN) or astrocytic (GFAP) marker (Fig. 4). To localize the spatial extent of the activated microglia relative to injured central afferent terminals in the superficial dorsal horn after SNI, we compared Iba1 immunoreactivity, a marker of activated microglia, with IB4 binding, a marker of C-fiber nociceptor central terminals that synapse in spinal cord lamina II (Fig. 5). IB4 staining in afferent central terminals decreases after peripheral nerve injury (Munglani et al., 1995; Shehab et al., 2004). Iba1 staining was strong in, but not limited to, the area innervated by injured nociceptive afferents as detected by decreased IB4 staining (Fig. 5 a). Iba1 staining in the deeper lamina was consistent with the medial innervation of the tibial and common peroneal nerves as opposed to the more lateral innervation of the spared sural nerve. C3 immunoreactivity colocalized to a subset of the Iba1-positive cells in the ipsilateral dorsal horn after SNI, indicating that this complement protein is produced after the injury in many but not all microglia (Fig. 5 b–g).

Complement gene expression in microglia. Fluorescent in situ hybridization for C1q, C4, and C3 in the ipsilateral dorsal horn is shown. Each mRNA signal colocalizes with Iba1, a microglial marker, but not with NeuN (neuronal) or GFAP (astrocyte) markers. Staining of C1q was performed 3 d after injury, and staining of C4 and C3 was performed 7 d after injury. Scale bar, 15 μm.

A , Confocal microscopic photomontage of the lumbar dorsal horn of the rat spinal cord 5 d after SNI labeled with the c-fiber central terminal marker IB4 (green) and the microglial marker Iba1 (blue). The region between the arrows has reduced IB4 staining marking the central termination zone of the injured axons. B , C , Complement component C3 immunostaining in the ipsilateral ( B ) and contralateral ( C ) dorsal horn 5 d after SNI from the same section acquired using the same microsope settings. D–F , C3 immunoreactivity (5 d SNI; D ) colocalizes with Iba1 (microglia; E ) but not IB4 (c-fiber; F ) staining. G , Overlay of images D–F . Scale bars: A–C , 100 μm; E , F , 10 μm.
C5 is the pivotal terminal complement component before the C5a anaphylatoxin and membrane attack complex (MAC) complement effectors (Fig. 3 a). C5a acts directly on its receptor, C5aR, whereas C5b activity leads to MAC formation. We therefore examined expression of C5 mRNA and that of the C5aR (C5aR/CD88) in the dorsal horn after SNI. C5 mRNA progressively increased after SNI, reaching a level ∼7.5-fold higher than that present in uninjured rats at 21 d (Fig. 6 e), whereas C5aR increased rapidly, with an earlier peak at 3 d (Fig. 6 d). C5aR was detected immunohistochemically only in spinal cord microglia (Fig. 6 a), with low constitutive level expression in uninjured spinal cord that increased considerably early after SNI (Fig. 6 b,c).

A , C5aR immunoreactivity within the ipsilateral dorsal horn of the spinal cord 3 d after SNI colocalizes with Iba1 (first 3 panels), confirming localization to microglia. Scale bar, 10 μm. B , C5aR immunoreactivity in the ipsilateral L4–L5 lumbar dorsal horn increases from a low expression in naive animals peaking 3 d after SNI. Scale bar, 100 μm. C , High-power image of the naive dorsal horn section in B showing baseline C5aR expression. D , E , Change in C5aR mRNA ( D ) and C5 mRNA ( E ) in the dorsal horn of the spinal cord of rats after SNI relative to levels in uninjured animals, detected by quantitative real-time PCR (n = 4; ANOVA, *p < 0.05).
Next, we analyzed potential mechanisms for complement C3 mRNA induction. Purified neonatal mouse microglial cell cultures (Fig. 7 a–d) showed minimal basal C3 expression (Fig. 7 e,f) but began to express C3 mRNA and protein after activation of the microglia by bacterial lipopolysaccharide (LPS) or tumor necrosis factor α (TNFα), but not interleukin-1β (IL-1β) (Fig. 7 e–h). These cells expressed C5aR protein constitutively in vitro (data not shown).
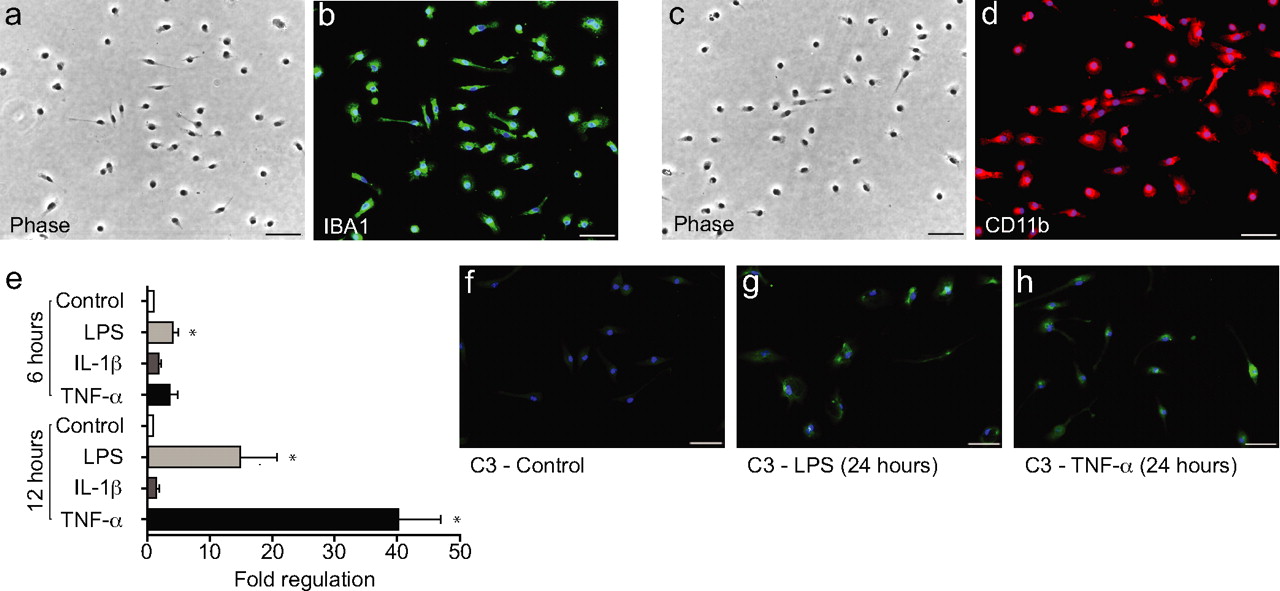
Induction of C3 in microglial cultures. A–D , Neonatal mouse microglial cell cultures under phase ( A , C ) and labeled with two microglial markers, Iba1 ( B ) and CD11b ( D ). E , Quantitative real-time PCR shows strong upregulation of C3 mRNA 24 h after treatment with LPS (10 μg/ml) and TNF-α (10 ng/ml) but not IL-1β (10 ng/ml). E–H , Complement C3 protein is upregulated in the presence of LPS (10 μg/ml; G ) and TNF-α (10 ng/ml; H ) compared with control ( F ) after 24 h. DAPI staining for nuclei (blue) is shown in all merged images. Scale bar, 50 μm. *p < 0.05 (t test).
Activation of the complement cascade and pain
We find that mice with C5 deficiency (Frank, 1995), which blocks formation of both C5a and the MAC, show decreased pain sensitivity in the SNI model (supplemental Fig. 2, available at www.jneurosci.org as supplemental material). These findings confirm those of the Watkins group (Twining et al., 2005) and, in addition, show that the C3a anaphylatoxin is not involved in nerve injury-induced pain sensitivity, because C3a production occurs before C5 function in the complement cascade. To determine whether MAC formation is a potential mediator of complement-induced neuropathic pain hypersensitivity, we tested a strain of rats deficient in complement component C6, which is downstream of C5b and absolutely necessary for MAC assembly. We found no difference in pain hypersensitivity after SNI in C6-deficient rats relative to controls (supplemental Fig. 2, available at www.jneurosci.org as supplemental material) and conclude, therefore, that the MAC is not involved.
Collectively, these data appear to exclude a major role for C3a or the MAC as pain effectors, leaving only C5a. To determine whether the C5a anaphylatoxin peptide has a role in pain hypersensitivity, we injected C5a into the intrathecal space of the rat spinal cord in noninjured animals. The C5a peptide produced a dose-dependent increase in cold pain sensitivity that persisted for 6 h (Fig. 8 a). This suggests that C5a is sufficient to enhance nociceptive pain sensitivity, although the effect of C5a after peripheral injury may differ attributable to upregulation of its receptor. We then investigated whether C5a contributes to neuropathic pain hypersensitivity by infusing a cyclic peptide, specific C5aR antagonist AcF-[OPdChaWR] (Finch et al., 1999), continuously into the intrathecal space of rats subject to SNI over a period of 10 d. The C5aR antagonist significantly reduced cold allodynia relative to vehicle (PBS)-treated animals (Fig. 8 b). This suggests that C5a is necessary, at least for this feature of neuropathic pain. Mechanical responsiveness showed a nonsignificant trend toward lower sensitivity after the C5R antagonism (data not shown).

C5a function. A , Paw withdrawal in response to a cold stimulus as a function of time subsequent to injection of C5a peptide into the intrathecal space of rats. Data for saline injection (filled squares; n = 7), 10 ng of C5a peptide (open circles; n = 7), and 100 ng of C5a peptide (open squares; n = 5) are shown. The area under the response-time curve (AUC) was calculated for each dose. There was a significant difference among the three doses by one-way ANOVA (F (2,16) = 8.72; p = 0.0027), with post hoc testing (Tukey's method) showing a significant difference between saline and 100 ng (p = 0.002) but not between 10 and 100 ng (p = 0.13) or between saline and 10 ng (p = 0.09). All data are mean ± SEM. B , Paw withdrawal in response to a cold stimulus (acetone evaporation) as a function of time subsequent to SNI injury in rats during continuous infusion of a C5a antagonist into the intrathecal space via an osmotic pump. Day −1 behavioral testing was before pump placement; day 0 behavioral testing was before SNI injury. There was a significant difference in the area under the response-time curve between C5a antagonist-treated (open squares; n = 12) and vehicle-treated (filled squares; n = 11) animals by Welch's two-sample t test (t = 2.17; df = 20.4; p = 0.042).
Discussion
Induction of the complement cascade after nerve injury
Given that the SNI, CCI, and SNL models of peripheral nerve injury are all characterized by an increase in pain-related behavior, we hypothesized that at least some of the genes that are regulated in parallel across all the models may contribute to the shared pain phenotype. The largest group of commonly regulated transcripts are related to immune function, and most prominent of these are several members of the complement cascade. The complement cascade is part of the innate immune system and provides a rapid host defense mechanism before the slower but more specific acquired immune system is activated. The complement system relies on recognizing certain non-self or pathogen-associated molecular signatures. Approximately 30 activator and inhibitor proteins interact in a cascade to opsonize pathogens, initiate cell signaling, effect cell lysis, recruit inflammatory cells, and increase vascular permeability (Walport, 2001; Carroll, 2004). Proteins of the complement cascade are generally considered the product of hepatic synthesis, with distribution in plasma to their site of action, although increasingly it is recognized that local synthesis in injured tissues also occurs. Because CSF complement concentration is several hundred-fold lower than that in serum (Jongen et al., 2000), transfer from serum is unlikely to be the source of complement in the CNS. Microglia, astrocytes, and oligodendrocytes synthesize complement proteins in the CNS after injury, infection, and ischemia (Laufer et al., 2001; van Beek et al., 2003) and, as we now show, after peripheral nerve injury. Excessive activation of this cascade or expression in inappropriate sites can cause severe damage in many tissues, including the CNS (Laufer et al., 2001; van Beek et al., 2003).
Microglia are activated in the dorsal horn after peripheral nerve injury and lie in close proximity with the central terminal zone of injured afferents (Liu et al., 1998; Winkelstein et al., 2001; Tsuda et al., 2005). We find that a subset of Iba1-positive microglia upregulate components of the complement cascade. Inflammatory cytokines are prime candidates for inducing upregulation of complement genes in microglia. IL-1β, IL-6, TNFα, and interferon-γ (IF-γ) induce components of the complement cascade in liver and brain (Veerhuis et al., 1999; van Beek et al., 2003; Stapp et al., 2005) and are expressed in the spinal cord and DRG, where their levels increase after peripheral nerve injury (Arruda et al., 1998; Hashizume et al., 2000; Winkelstein et al., 2001; Tanga et al., 2004). We find, moreover, that TNFα strongly increases C3 expression in cultured microglia (Fig. 7). TNFα is a candidate of particular interest because after nerve injury it has been shown to be a mediator of both spinal microglial activation and neuropathic pain hypersensitivity (Svensson et al., 2005). Candidates for gene upregulation by complement are the chemokines CX3CL1 (fractalkine) and CCL2 (monocyte chemoattractant protein-1) (Abbadie et al., 2003; Albrecht et al., 2004; Verge et al., 2004; Tanga et al., 2005; Thurman et al., 2007). Increased expression of the receptors for CX3CL1, CCL3, CCL8, and IF-γ is found after peripheral nerve injury (supplemental Table 1 and supplemental Fig. 1, available at www.jneurosci.org as supplemental material), consistent with the possibility that these chemokines in turn activate microglia (Abbadie et al., 2003; Verge et al., 2004; Tanga et al., 2005).
Activation of the complement cascade after nerve injury
What triggers activation of the complement cascade in the spinal cord? Although immune complexes are the best known activator of the classical complement pathway, other molecular entities, both endogenous and exogenous, can activate C1q, including serine proteases, myelin, amyloid fibrils, DNA, and LPS (Vanguri et al., 1982; Elward and Gasque, 2003). C3 is centrally located in the complement cascade, representing the point of convergence of the three different arms of complement activation. C3 activity leads to opsonization and clearance, as well as activation of C5, which in turn leads both to the production of the terminal complement MAC and release of the anaphylatoxin C5a peptide.
The lack of a reduction in pain sensitivity after peripheral nerve injury in C6-deficient rats argues against a role for MAC in the generation of neuropathic pain. Our findings point instead to C5a as the effector of the complement pathway in neuropathic pain. We show that intrathecal injection of C5a produces cold allodynia in naive animals, whereas that of a C5aR antagonist reduces cold pain in rats with SNI. C5a has pleiotropic inflammatory effects, acting on numerous cell types via activation of nuclear factor-κB, activator protein-1, and cAMP response element-binding protein signal transduction pathways (Mastellos et al., 2005). C5a causes an oxidative burst in neutrophils, enhances phagocytosis (Guo and Ward, 2005), and acts as a chemoattractant for neutrophils, monocytes, and macrophages (Marder et al., 1985).
C5aR is a G-protein-coupled receptor that is expressed in the CNS (Stahel et al., 1997; Farkas et al., 2003). We find that C5aR is constitutively expressed at low levels by microglia in the intact dorsal horn and that its expression increases shortly after peripheral nerve injury, likely enhancing the responsiveness of microglia to C5a. C5a signaling may be involved, therefore, in the activation and/or recruitment of microglia in the dorsal horn after nerve injury and, in this way, contributes to the initiation of neuropathic pain.
Microglia and pain
Chemokines, purines, and cytokines all contribute to neuropathic pain via the activation of microglia in the dorsal horn from their normal quiescent state (DeLeo and Yezierski, 2001; Watkins et al., 2001; DeLeo et al., 2004; Tsuda et al., 2005), and we now propose that C5a is also involved. Activated microglia release BDNF, which causes a shift in the anion reversal potential in a subset of spinal lamina I neurons, leading to an excitatory response to GABA instead of inhibition within these cells (Coull et al., 2003, 2005). In addition, several other signal molecules that alter excitability or synaptic transmission are released from microglia (Marchand et al., 2005). Inhibition of microglia, using minocycline and propentophylline as well as mitogen-activated protein kinase p38 inhibitors, reduces neuropathic pain (Sweitzer et al., 2001; Jin et al., 2003; Raghavendra et al., 2003; Ledeboer et al., 2005; Tawfik et al., 2007), as do null mutations of chemokine and Toll-like receptors expressed by microglia (Abbadie et al., 2003; Verge et al., 2004; Tanga et al., 2005).
Conclusion
Increased expression of the complement cascade in the spinal cord is the most prominent transcriptional change found across multiple neuropathic pain models. C5a anaphylatoxin acting via C5aR expressed on microglia augments pain hypersensitivity. We conclude that a neuroimmune interaction involving induction and activation of the complement cascade in microglia contributes, by production of C5a, to the maladaptive responses to nerve injury that lead to the generation of pain.
Footnotes
-
This work was supported by the National Institutes of Health [Grants RDE017821A and NS038253 (C.J.W.), NS052623 (M.C.), and NS044139 (G.J.B.)] and Bayer AG. A.M. is the recipient of a Bogue research fellowship (University College London, London, UK). We thank Ashok Khatri, peptide core Massachusetts General Hospital for production of the C5a receptor antagonist, and Marissa Hamrick for technical assistance.
- Correspondence should be addressed to Dr. Clifford J. Woolf, Neural Plasticity Research Group, Department of Anesthesia and Critical Care, Massachusetts General Hospital and Harvard Medical School, 149 13th Street, Room 4309, Charlestown, MA 02129. cwoolf{at}partners.org
References
- Abbadie et al., 2003.↵
- Albrecht et al., 2004.↵
- Arruda et al., 1998.↵
- Bennett and Xie, 1988.↵
- Blackshaw and Snyder, 1997.↵
- Bolstad et al., 2003.↵
- Brenner et al., 2004.↵
- Carroll, 2004.↵
- Clark et al., 2006.↵
- Costigan et al., 2002.↵
- Coull et al., 2003.↵
- Coull et al., 2005.↵
- Decosterd and Woolf, 2000.↵
- DeLeo and Yezierski, 2001.↵
- DeLeo et al., 2004.↵
- Diaz et al., 2003.↵
- Dworkin et al., 2003.↵
- Elward and Gasque, 2003.↵
- Farkas et al., 2003.↵
- Finch et al., 1999.↵
- Frank, 1995.↵
- Gebhart, 2004.↵
- Gentleman et al., 2004.↵
- Guo and Ward, 2005.↵
- Hartigan and Wong, 1979.↵
- Hashizume et al., 2000.↵
- Imai et al., 1996.↵
- Inoue et al., 2004.↵
- Irizarry et al., 2003.↵
- Jin et al., 2003.↵
- Jongen et al., 2000.↵
- Kaufmann and Rousseeuw, 1990.↵
- Kim and Chung, 1992.↵
- Lacroix-Fralish et al., 2006.↵
- Laufer et al., 2001.↵
- Ledeboer et al., 2005.↵
- Lindblom and Verrillo, 1979.↵
- Liu et al., 1998.↵
- March et al., 2004.↵
- Marchand et al., 2005.↵
- Marder et al., 1985.↵
- Mastellos et al., 2005.↵
- Munglani et al., 1995.↵
- R Development Core Team, 2005.↵
- Raghavendra et al., 2003.↵
- Scholz and Woolf, 2002.↵
- Scholz et al., 2005.↵
- Shehab et al., 2004.↵
- Stahel et al., 1997.↵
- Stapp et al., 2005.↵
- Storey and Tibshirani, 2003.↵
- Svensson et al., 2005.↵
- Sweitzer et al., 2001.↵
- Tanga et al., 2004.↵
- Tanga et al., 2005.↵
- Tavazoie et al., 1999.↵
- Tawfik et al., 2007.↵
- Tegeder et al., 2006.↵
- Thurman et al., 2007.↵
- Tsuda et al., 2005.↵
- Twining et al., 2005.↵
- van Beek et al., 2003.↵
- Vanguri et al., 1982.↵
- Veerhuis et al., 1999.↵
- Venables and Ripley, 2002.↵
- Verdugo and Ochoa, 1992.↵
- Verge et al., 2004.↵
- Walport, 2001.↵
- Wang et al., 2002.↵
- Watkins et al., 2001.↵
- Waxman, 2001.↵
- Winkelstein et al., 2001.↵
- Woolf and Mannion, 1999.↵
- Woolf and Salter, 2000.↵
- Xiao et al., 2002.↵


