 Kelly A. Bordner1 Elizabeth D. George1 Becky C. Carlyle1 Alvaro Duque2 Robert R. Kitchen1,3 TuKiet T. Lam4 Christopher M. Colangelo4 Kathryn L. Stone4 Thomas B. Abbott4 Shrikant M. Mane4 Angus C. Nairn1 Arthur A. Simen1*
- 1 Department of Psychiatry, Yale University School of Medicine, New Haven, CT, USA
- 2 Department of Neurobiology, Yale University School of Medicine, New Haven, CT, USA
- 3 Department of Physics, The University of Edinburgh, Scotland, UK
- 4 Department of Molecular Biophysics and Biochemistry/Keck Biotechnology Services, New Haven, CT, USA
Early life neglect is an important public health problem which can lead to lasting psychological dysfunction. Good animal models are necessary to understand the mechanisms responsible for the behavioral and anatomical pathology that results. We recently described a novel model of early life neglect, maternal separation with early weaning (MSEW), that produces behavioral changes in the mouse that persist into adulthood. To begin to understand the mechanism by which MSEW leads to these changes we applied cDNA microarray, next-generation RNA-sequencing (RNA-seq), label-free proteomics, multiple reaction monitoring (MRM) proteomics, and methylation analysis to tissue samples obtained from medial prefrontal cortex to determine the molecular changes induced by MSEW that persist into adulthood. The results show that MSEW leads to dysregulation of markers of mature oligodendrocytes and genes involved in protein translation and other categories, an apparent downward biasing of translation, and methylation changes in the promoter regions of selected dysregulated genes. These findings are likely to prove useful in understanding the mechanism by which early life neglect affects brain structure, cognition, and behavior.
Introduction
Child neglect is currently the most prevalent form of child maltreatment in the United States, accounting for close to half of all childhood maltreatment fatalities (Us-Government-Report, 2008). Children who survive childhood neglect will often go on to develop long lasting behavioral and cognitive problems (De Bellis, 2005) including cognitive deficits (De Bellis and Thomas, 2003), aggression and poor impulse control (Hildyard and Wolfe, 2002), depression (Bhatia and Bhatia, 2007; Widom et al., 2007a), anxiety (Mathews et al., 2008), drug and alcohol abuse (Kaufman et al., 2007; Trent et al., 2007; Widom et al., 2007b), attention deficit hyperactivity disorder (Ouyang et al., 2008), and delinquency (Maxfield and Widom, 1996; Hildyard and Wolfe, 2002; Kotch et al., 2008). Early life neglect has also been associated with numerous neuroanatomical alterations. Examples include maldevelopment of the corpus callosum (Teicher et al., 1997; Jackowski et al., 2008), volumetric loss in the hippocampus, corpus callosum, and prefrontal cortex (PFC), altered cortical symmetry in frontal lobes and superior temporal gyrus, reduced neuronal density or integrity of the anterior cingulate (Teicher et al., 2006), and delays in myelination (Diamond et al., 1964; Juraska and Kopcik, 1988).
Unfortunately, the molecular bases for both the neuroanatomical and behavioral alterations listed above remain largely unknown. Early research has focused on well-described pathways, including stress responsive systems (Anisman et al., 1998; Gutman and Nemeroff, 2002; De Kloet et al., 2005). To our knowledge, however, a fully comprehensive evaluation of the molecular changes that occur following early life neglect has not yet been performed. This task, which would significantly enhance the understanding of the consequences of early life neglect, requires the use of an adequate animal model. Previously, we described the development of a novel mouse model of maternal separation (maternal separation with early weaning, MSEW). Mice subjected to MSEW exhibit consistent, long lasting behavioral hyperactivity, and altered emotionality that persists well into adulthood (George et al., 2010).
Therefore, the goal of this work was to create a comprehensive description and evaluation of the molecular events that occur following extended periods of early maternal neglect in the mouse. We performed a structured, high throughput analysis of RNA and protein expression in the PFC of MSEW and control mice. We focused on the PFC because of the effects of child abuse and neglect on the structure (De Bellis et al., 2002; Panzer, 2008; Tomoda et al., 2009) and function (Deprince et al., 2009; Samuelson et al., 2010) of this region in children exposed to maltreatment. We also assessed the role of DNA methylation in a select set of genes showing significant changes at the level of RNA expression. We report highly significant effects of MSEW on the expression of mRNAs and proteins involved in myelination and protein translation, in addition to other categories relevant to neurodevelopment. The effects of MSEW on protein expression were found to be biased in a negative direction, with many more proteins downregulated than upregulated. This work gives critical insight into the molecular mechanisms by which MSEW affects brain structure and function. We believe that these findings will help to inform efforts to understand the pathophysiology of early life neglect.
Materials and Methods
Animals
Experimentally naïve C57Bl/6J (B6) and DBA/2J (D2) mice were obtained from Jackson Laboratory (Bar Harbor, ME, USA), and experimental subjects were bred in house. Upon birth, entire litters were randomized to control or MSEW. Control animals were left undisturbed and weaned at postnatal day (PD) 23, the usual weaning date at our facility. MSEW animals were separated from the dam for 4 h per day on PDs 2–5, and 8 h per day on PDs 6–16, then weaned on PD 17. After weaning, animals were group housed with same sex littermates and were sacrificed at PD 75. Only male mice were used for the work described in this manuscript.
Tissue Collection
Mice were anesthetized with chloral hydrate (1500 mg/kg) and rapidly decapitated. Whole brain was collected and stored in RNAlater (Qiagen) for 24 h. Brains in RNAlater were then stored at −20°C.
RNA/DNA/Protein Extraction
Brains were removed from RNAlater, sectioned at 300 μm on a vibratory microtome (Vibratome), and sections were stored in 0.025% methylene blue in RNAlater at −20°C for 48 h. Medial PFC, defined as anterior cingulate, pre-limbic cortex, and infralimbic cortex, was dissected under a stereomicroscope, placed in RNAlater at 4°C, and processed within 24 h. RNA and DNA were extracted using the Qiagen AllPrep mini kit. RNAlater was removed from the samples and 600 μL of buffer RLT (Qiagen) containing β-mercaptoethanol was added. Tissue was sonicated for 5 s at 10% power on ice, prior to RNA extraction. Protein was precipitated from the RNA column flow-through using the 2D Clean-Up Kit (GE) and pellets frozen at −80°C.
Microarray Analysis
Total RNA was collected and analyzed on a Bioanalyzer (Agilent). Samples with RNA integrity (RIN) > 9 were used for array analysis. Five hundred nanograms of RNA from each sample was hybridized to Illumina Mouse WG-6 arrays. The Lumi package in R/Bioconductor was used to perform variance stabilization and quantile normalization. After excluding probes found to be poorly expressed (detection threshold = 0.01) the resulting data were quality checked using graphical tools from the Lumi package and then analyzed using the Maanova package1 in R on a parallel computing cluster. Because the array platform used here contains six arrays on each chip (“beadchip”), such that six samples can be run on each chip, we added the random effect of beadchip to the model to avoid any spurious results due to correlations between data collected from the same beadchip. Conditions (B6 MSEW, B6 Control, D2 MSEW, D2 Control) were carefully counterbalanced on the beadchips. The Maanova package is designed to readily accommodate such designs2. We first analyzed both strains simultaneously using linear models with strain and group × strain as fixed effects and then we analyzed the two strains separately. p-values were calculated using the “Fs” statistic (Cui et al., 2005) from permutation tests (1000 permutations per test) and were corrected for multiple testing (Storey, 2002). Results were analyzed using GeneGo software (Metacore) as well as Cytoscape and ClueGo software. For the later analyses, genes at the Q < 0.0001 level of significance were extracted and analyzed with respect to GO (Gene Ontology) Biological Process terms using the 10/29/2010 build of GO. ClueGo settings were: Enrichment only, Benjamini–Hochberg false discovery rate (FDR) correction, GO Term Restriction Level 1–6 and two genes/4% minimum, GO Term Connection (Kappa) minimum 0.3, GO Term Grouping was on, with an initial group size of 3 and Group Merging set at 50%.
RNA-seq Analysis
Total RNA was collected as described above and subjected to Bioanalyzer analysis. Samples with RIN > 9 were used for library preparation using the mRNA-Seq 8-Sample Prep Kit (Illumina). The library was then used for cluster generation using the Standard Cluster Generation Kit v4 (Illumina). Flow cells were then run on a Genome Analyzer IIe with 75 nt read lengths. RNA-sequencing (RNA-seq) data were mapped to the July 2007 mouse genome using GERALD software using the ELANDv2 algorithm (Illumina). Reads falling within Refseq genes were counted using the CASAVA counting algorithm (Illumina) and gene counts were analyzed using the EdgeR package (Robinson et al., 2010) using negative binomial statistics and were corrected for multiple testing (Storey, 2002). Exon-level statistics were calculated using identical methods, except that CASAVA exon-level counts were used instead of the gene level counts. Gene ontology analysis was conducted using GeneGo software (Metacore) as well as Cytoscape and ClueGo software as for the microarray data.
Methylation Analysis
Genes for methylation analysis were chosen based on the microarray results. We selected 10 genes that showed significant expression differences between MSEW and control animals, did not show a significant strain × group interaction effect, and with potential relevance to prefrontal cortical function based on published literature. Five hundred nanograms of DNA from each animal was used for Sequenom EpiTyper methylation analysis at multiple CpG sites close to the transcription start site of each gene of interest. In brief, DNA was bisulfite converted (EZ DNA Methylation Kit, Zymo Research) and PCR amplified using primers designed with EpiDesigner software (Sequenom) to analyze promoter CpGs. CpGs were selected within approximately −400 to +200 nt of the transcription start site. Amplified DNA underwent methylation specific cleavage, and fragments were then quantified using MALDI-TOF on a Sequenom MassARRAY system. In most cases individual CpGs could be quantified but in some cases clusters of adjacent CpGs could not be resolved and were analyzed together. Data were filtered for more than 7% and less than 90% methylation at each CpG or CpG cluster, which is approximately the linear range of the assay, and p-values were corrected for multiple comparisons within genes (Storey, 2002). Primer sequences are given in Table S1 in Supplementary Material.
Label-Free Proteomics
Sample preparation
Proteins were precipitated as described above. Frozen pellets were resuspended in 8 M urea. The samples were then homogenized and sonicated and then centrifuged and supernatants retained. Protein abundances were estimated using a NanoDrop spectrophotometer (Thermo Scientific). Samples were then diluted to 2 M Urea and 0.4 M ammonium bicarbonate, reduced with dithiothreitol (DTT), alkylated with iodoacetamide (IAN), and digested for 16 h at 37°C. Multi-enzyme digestion (i.e., Glu-C/Trypsin) was carried out to ensure maximum protein sequence coverage.
Label-free instrumentationn
Samples were run on a LTQ Orbitrap equipped with a Waters nanoACQUITY™ UPLC™ system, using a Waters Symmetry® C18 180 μm × 20 mm trap column and a 1.7-μm, 75 μm × 250 mm nanoAcquity™ UPLC™ column (35°C) for peptide separation.
Label-free quantitation
Five microlitters of the digested samples (at 0.1 μg/μL conc.) were injected onto a nanoACQUITY™ UPLC™ in-line with an LTQ Orbitrap MS system. The LC gradient and sequence of MS events are described below. Buffer A: 0.1% formaic acid (FA) in water; Buffer B: 0.075% FA in acetonitrile (ACN). A 120-min run time was utilized as follows: 0 min, 5% B; 1 to 90 min – 5 to 40%B, 90 to 91 min – 40 to 85% B, maintained at 85% B for 4 min, then back to 5% B in 1 min, finally 24 min re-equilibration at 5%B. Two blanks (1st 100% ACN, 2nd Buffer A) followed each injection to ensure no carry over.
MS sequence events
MS was acquired in the Orbitrap using 1 microscan, and a maximum inject time of 900 ms followed by three data dependant MS/MS acquisitions in the ion trap (with precursor ions threshold of >3000); the total cycle time for both MS and MS/MS acquisition was 1.0 s. Peaks targeted for MS/MS fragmentation by collision induced dissociation (CID) were first isolated with a 2-Da window followed by normalized collision energy of 35%. Dynamic exclusion was activated where former target ions were excluded for 30 s. See below for MS script details and LTQ Orbitrap parameters used. The data were processed with Progenesis LCMS (Non-linear Dynamics, LLC) and protein identification was carried out using the Mascot search algorithm (version 2.3.0; Matrix Science). See details below.
LF Data analyses
Feature extraction, chromatographic/spectral alignment, data filtering, and statistical analysis were performed using Non-linear Dynamics Progenesis LCMS software (Non-linear Dynamics, LLC). First, the raw data files were imported into the program. A sample run was chosen as a reference (usually at or near the middle of all runs in a set), and all other runs were automatically aligned to that run in order to minimize retention time (RT) variability between runs. No adjustments are necessary in the m/z dimension due to the high mass accuracy of the mass spectrometer (typically <3 ppm). All runs were selected for detection with an automatic detection limit. Features within RT ranges of 0–16 min and 102–120 min were filtered out, as were features with charge ≥ +8. A normalization factor was then calculated for each run to account for differences in sample loading between injections. The experimental design was set up to group multiple injections from each run. The algorithm then calculates and tabulates raw and normalized abundances, max fold change, and ANOVA p-values for each feature in the data set. The MS/MS collected for the experiment were filtered to exclude spectra with rank > 10 or isotope > 3 to ensure that the highest quality MS/MS spectral data are utilized for peptide assignments and subsequent protein ID. The remaining MS/MS were exported to an .mgf (Mascot generic file) for database searching (see below). After the Mascot search, an .xml file of the results was created, and then imported into the Progenesis LCMS software, where search hits were assigned to corresponding features.
Database searching
The.mgf files created by the Progenesis LCMS were searched in house using the Mascot algorithm (Hirosawa et al., 1993, version 2.2.0) for un-interpreted MS/MS spectra. The data was searched against a user specific protein database. Search parameters included: Variable modifications-Carbamidomethyl (Cys), Oxidation (Met), Carbamyl (K). Other modifications were used when appropriate. Other settings included peptide mass tolerance – ±15 ppm; Fragment mass tolerance – ±0.6 Da; and with Decoy search to estimate FDR. Using the Mascot database search algorithm, the Keck Facility considers a protein identified when Mascot lists it as significant and more than two unique peptides match the same protein. The Mascot significance score (similar to the “Confidence scores” column in the Progenesis LCMS protein features spreadsheet) is based on a MOWSE score and relies on multiple matches to more than one peptide from the same protein. The Mascot search results were filtered using a significance cutoff of p < 0.05, an ion score cutoff of 28, and a requirement of at least one Mascot “bold” (first time any match to the spectrum has appeared in the report) and “red” (top scoring peptide match for this spectrum) for the peptide.
MRM Proteomics
Select genes that showed statistically significant changes by RNA-seq related to oligodendrocyte biology were selected for protein-level quantification using Multiple Reaction Monitoring (MRM) methods. All analyses were carried out on a 5500 Q-TRAP instrument coupled to an online Waters nanoACQUITY™ UPLC™ system. Peptides were resolved for MRM (LC step) by loading 4 μL of sample onto a Symmetry C18 nanoAcquity trapping column (180 μm × 20 mm 5 μm) with 100% water/0.1% FA at 15 μL per min for 1 min. After trapping, peptides were resolved on a BEH130 C18 nanoAcquity column (75 μm x 100 mm 1.7 μm) with a 30-min, 2–40% ACN/0.1% FA linear gradient (0.75 μL/min flow rate). MRM scanning was carried out with 211 transitions and a cycle time of 2.4 s with a 5-ms dwell time per transition in positive polarity. Data were initially processed using MRMPilot 2.0, Analyst 1.5 with MIDAS, and Multiquant2.0 software. Peptide identification was confirmed using MASCOT 2.3. Both Multiquant and MASCOT datasets were then uploaded and merged in the Yale Protein Expression Database (Shifman et al., 2007). Data were analyzed using nested linear models with transition nested within peptide and peptide nested within protein. All interaction effects were included in the model and significant group (control vs. MSEW) × transition effects within peptide were used to identify outlying transitions which were subsequently deleted from further analysis. Statistics were calculated using nested analysis of variance with group, peptide, transition nested in peptide, the group × peptide interaction, and group × transition nested within peptide entered as terms in the model, and p-values corresponding to the effect of group were reported. Plots were generated using least squares (i.e., marginal) mean and SE for the group term.
Results
MSEW Leads to Dysregulation of Gene Expression by Microarray Analysis
To begin to determine the molecular consequences of MSEW we conducted microarray analysis on medial PFC from DBA/2J (D2) and C57Bl/6J (B6) mice. Tissue was taken from mice at PD 75 (P75), 7.5 weeks after the termination of the early life manipulation. MSEW affected 8043 probes in 6977 genes at the FDR adjusted p-value (Q-value) of Q < 0.05. A total of 4375 probes in 4031 genes were significant at a Q < 0.01 level with regard to the effect of MSEW (see Table S2 in Supplementary Material). A total of 1688 probes in 1630 genes were significant for the interaction effect at the Q < 0.05 level, and 236 probes in 235 genes were significant at the Q < 0.01 level for the interaction effect (see Table S2 in Supplementary Material), suggesting that certain genes were differentially dysregulated in the two strains. When B6 mice were analyzed individually, 8156 probes in 6825 unique genes were significantly changed at the Q < 0.05 level, and 4065 probes in 3758 unique genes were identified at the Q < 0.01 level (see Table S3 in Supplementary Material). All 6825 of these genes were also significant in the combined analysis of both strains. Probes that reached significance (Q < 0.01) were then used to “cluster” the individual mice using multidimensional scaling. As shown in Figure 1A, control and MSEW animals of both strains, and particularly the B6 strain, were effectively differentiated on the basis of these data. The most significant genes were then subjected to gene ontology analysis using ClueGO (Bindea et al., 2009), a plugin for Cytoscape (Shannon et al., 2003) software. As shown in Figure 1B, MSEW led to dyregulation of numerous genes with known roles in translation as well as other important biological categories. We also observed downregulation of two genes associated with oligodendrocytes, including Enpp2 (see Tables S2 and S3) and Mbp (see Table S3 in Supplementary Material), and a third gene Nkx6-2 approached significance for the B6 mice only (Q = 0.016; data not shown).
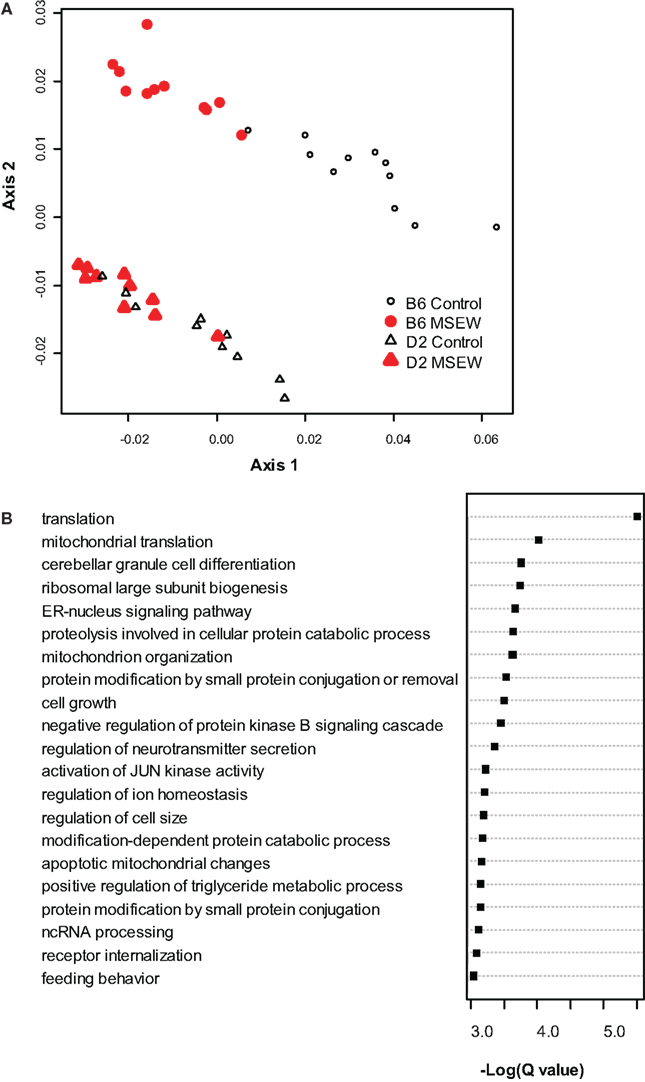
Figure 1. Microarray analysis. (A) Multidimensional scaling plot based on the genes found to be significantly dysregulated (Q < 0.01) by microarray analysis. Control (black, not filled) and MSEW (red, filled) animals are well separated for B6 (circles) and D2 (diamonds) animals. (B) Gene Ontology analysis of the most significant genes (Q < 0.0001) found to be dysregulated by MSEW using microarray analysis. Cytoscape and ClueGo software were used to perform enrichment analysis and the negative natural log of the Benjamini–Hochberg corrected p-values is shown for the significantly enriched gene categories. Details of the analysis are given in Section “Materials and Methods.”
The results with respect to mRNAs coding for proteins involved in translation were particularly striking as many of the observed changes in mRNA expression for this category (Eif3i, Eif3k, Eif5a, Eif6, Ict1, Mrpl2, Mrpl20, Mrpl23, Rpl19, Rpl29, Rpl5) were in the negative direction (see Tables S2 and S3) although the gene Cyld was upregulated. The dysregulated genes were also analyzed with respect to over-represented transcription factor binding sites using Metacor software (GeneGo Inc.). As shown in Table 1, a number of transcription factors showed significant overrepresentation in the dysregulated gene list.
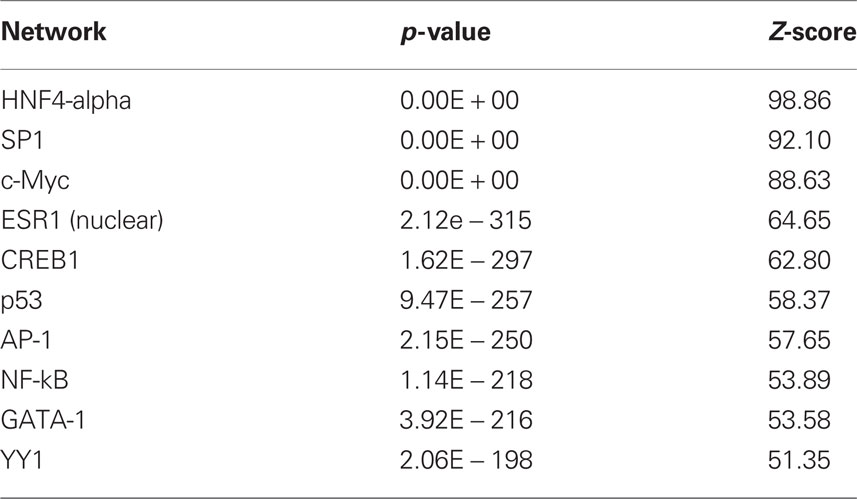
Table 1. Transcription factor overrepresentation analysis based on microarray results.
Strain × MSEW Interaction Effects on RNA Expression
Because we conducted the microarray analysis on two strains of mice, we were able to explore the impact of mouse strain on the molecular consequences of MSEW by including a term for the interaction of strain and MSEW (Strain × MSEW) in our models. Significant Strain × MSEW effects for a particular gene would suggest that MSEW differentially affects the expression of that gene in B6 and D2 mice. MSEW led to very similar effects in the two strains with few exceptions. Only 127 probes showed evidence for significant MSEW × Strain interaction effects as well as a main effect of strain. For these probes, more pronounced gene expression changes were generally noted for B6 mice than for D2 mice (see Figure 2; Table S4 in Supplementary Material), and B6 animals showed a larger dynamic range (~0.8 in log2 units) than D2 mice (~0.3; see Figure 2A). The majority of these genes were upregulated in B6 animals and downregulated in D2 animals (see Figures 2A–C). Genetic differences are likely to contribute to the observed strain differences in response to MSEW, and this warrants further investigation in future studies. As for the microarrays, a number of transcription factors showed significant overrepresentation in the dysregulated gene list (see Table 2).
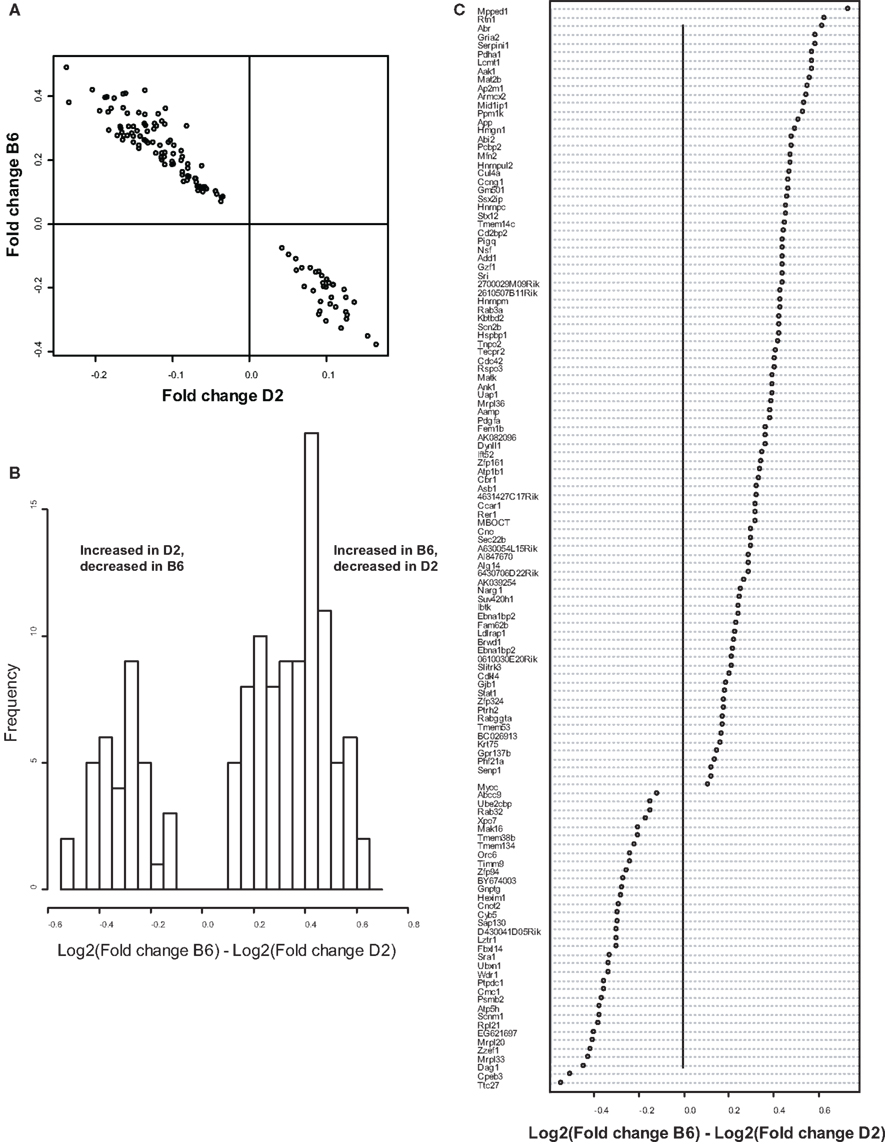
Figure 2. Comparison of B6 and D2 response to MSEW by microarray analysis. (A) Plot of Log2(Fold change) for B6 mice against Log2(Fold change) for D2 mice for genes that showed a significant interaction effect (Q < 0.01) by microarray analysis in addition to a significant (Q < 0.01) main effect of MSEW. Fold change values were scored as MSEW/Control. (B) Histogram of Log2(Fold change B6) – Log2(Fold change D2). Fold change values were scored as MSEW/Control. The majority of probes showed an increase in B6 and a decrease in D2 mice (92 probes), compared to a minority with the opposite pattern (35 probes). Chi-square = 25.6, p = 4.24E − 7. (C) Plot of genes showing strain × MSEW interaction effects (Log2(Fold change B6) –Log2(Fold change D2) values). Certain genes (e.g., Mpped1) showed a much larger change in B6 than D2 mice, whereas other genes (e.g., Ttc27) showed a larger change in D2 than B6 mice. B6 and D2 mice are known to differ genetically (see http://phenome.jax.org/SNP/). For example, D2 and B6 mice differ at one position in the promoter region of Mpped1 at SNP rs13482680 (C/C in B6 and T/T in D2). Similarly, the strains differ at SNP rs33366454 (A/A in B6 and G/G in D2) in the promoter region of Ttc27.
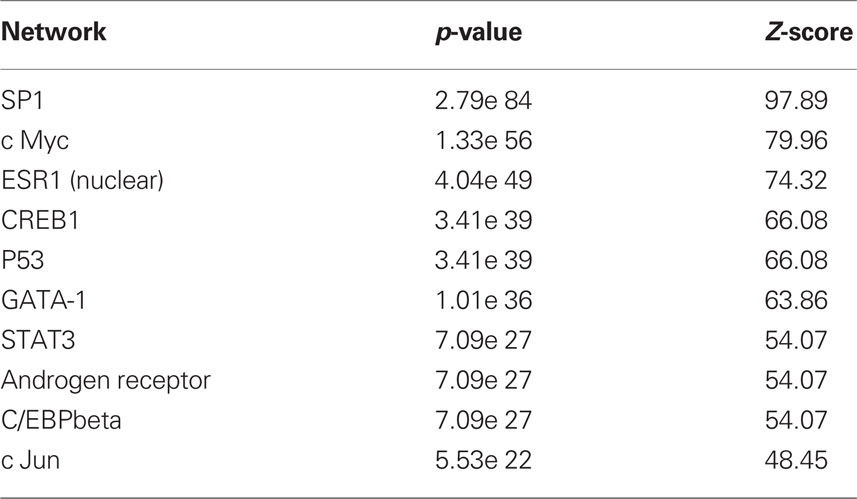
Table 2. Transcription factor overrepresentation analysis based on RNA-seq results.
MSEW Leads to Dysregulation of Gene Expression by RNA-seq
We performed RNA-seq on two pools of RNA obtained from B6 control animals and four pools obtained from B6 MSEW animals. Each pool contained RNA from medial PFC, in equal proportions, from five animals. RNA was sequenced from B6 animals exclusively because of our particular interest in this strain and for financial reasons. At this level of analysis there were 1239 genes significant at the Q < 0.01 level (see Table S5 in Supplementary Material).
The most significant genes were then subjected to gene ontology analysis as for the microarray data. A large number of GO categories were overrepresented in the list of dysregulated genes (see Figure 3). We noted a particularly large number of myelin related genes to be significantly (Q < 0.01) downregulated, including Mag, Mal, Mbp, Mobp, Mog, Omg, Opalin, and Plp1. As for the microarrays, we again found evidence for downregulation of numerous translation initiation factors such as Eif2a and Eif5b and mitochondrial (Mrpl18 and Mrpl48) and non-mitochondrial (Rpl13, Rpl23, Rps27l, Rsl1d1) ribosomal genes (see Table S5 in Supplementary Material). Certain translation-related genes were also found to be upregulated, for example Eif2c1, Eif2c2, Eif4ebp2 and Rplp1, Rps2, Rps6ka2, and Rps6kc1, suggesting bidirectional dysregulation of this category of genes.
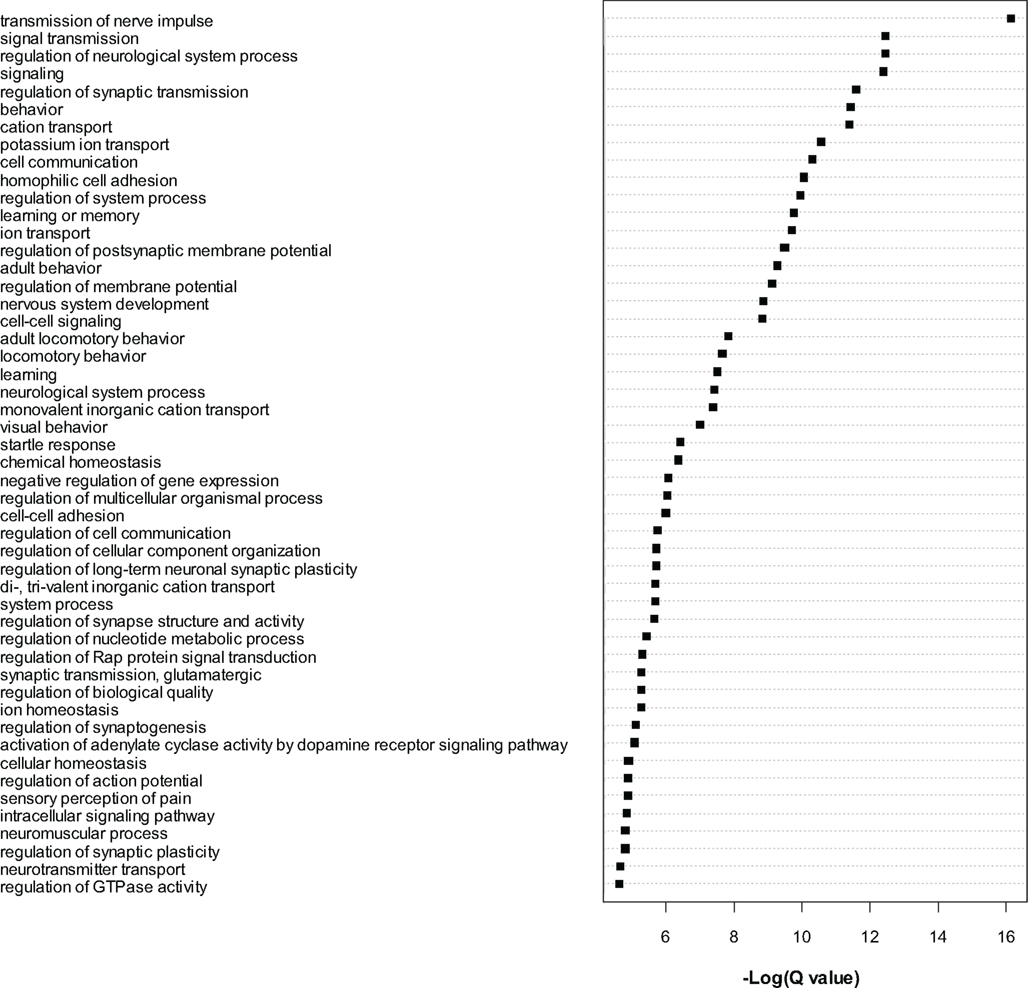
Figure 3. Gene ontology analysis of gene level RNA-seq results. Gene Ontology analysis of the most significant genes (Q < 0.0001) found to be dysregulated by RNA-seq analysis. Cytoscape and ClueGo software were used to perform enrichment analysis and the negative natural log of the Benjamini–Hochberg corrected p-values (Q-value) is shown for the significantly enriched gene categories. Only the top 50 significant categories out of 111 are shown.
Exon-Level RNA-seq Analysis
At the exon level of analysis a total of 11641 exons in 5268 genes were significant at the Q < 0.05 level of significance and 6423 exons in 3136 genes were significant at the Q < 0.01 level. At the Q < 0.05 level of significance, the majority of the changes involved mRNA upregulation (9628 exons upregulated, 2013 downregulated, p < 0.0001 by Chi-square). Similarly, at the Q < 0.01 level of significance 757 exons were downregulated and 5407 were upregulated by MSEW, a significant excess of upregulated over downregulated genes (p < 0.0001; see Table S6 in Supplementary Material).
Dysregulated exons (Q < 0.01) were filtered to retain only the most significant changes and were subjected to Gene Ontology (GO) analysis with Cytoscape/ClueGo. Overrepresented GO categories are shown in Figure 4. Numerous myelin related genes were downregulated at the exon level including Cldn11, Cnp, Ermn, Mag, Mal, Mbp, Mog, Plp1, and Ugt8a. In most cases a single exon was downregulated, but for Cldn11 and Mag two exons were downregulated, and for Plp1 four exons were downregulated. For these genes, the significantly dysregulated exons were generally those with higher read counts and statistical power was therefore highest for these regions. As in the case of the whole-gene level RNA-seq analysis, these results strongly support an effect of MSEW on mature, myelinating oligodendrocytes. We again observed bidirectional dysregulation of numerous mRNAs involved in translation, including App, Akt1, Aplp1, Cyld, Eef2, Eif3b, Eif4b, Eif4ebp2, Eif4g1, Eif4g3, Gm672, Igfbp5, Lrrc47, Mapk1, Poldip3, Ppp1r15b, Ptk2b, Pum2, Rpl13a, and Uhmk1 (see Table S6 in Supplementary Material).
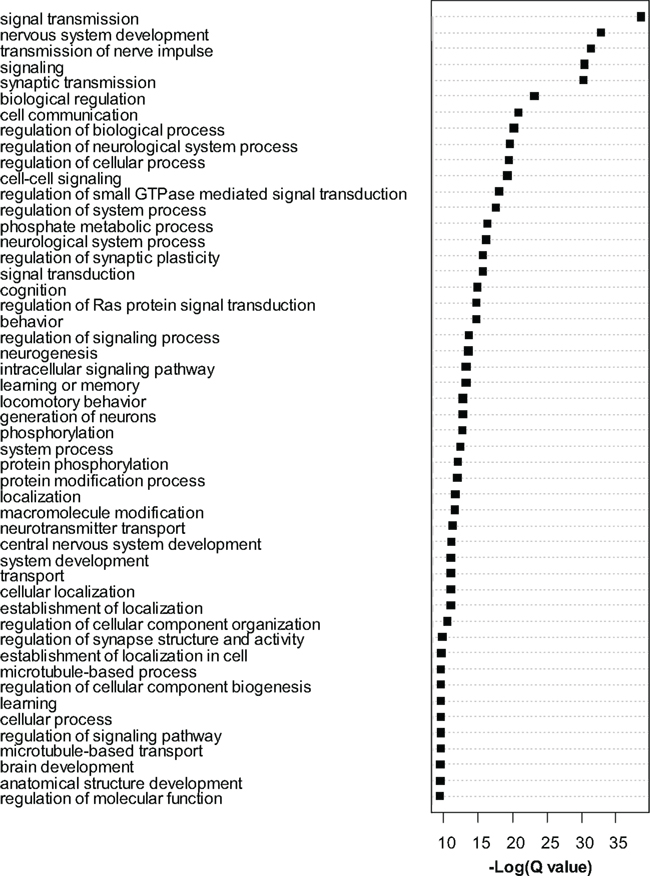
Figure 4. Gene ontology analysis of exon-level RNA-seq results. Gene Ontology analysis of the most significant genes (Q < 0.0001) found to be dysregulated by exon-level RNA-seq analysis. Cytoscape and ClueGo software were used to perform enrichment analysis and the negative natural log of the Benjamini–Hochberg corrected p-values (Q-value) is shown for the 50 most significantly enriched gene categories. A total of 209 categories were significant overall.
We performed a simple comparison of the results obtained with microarrays and exon-level RNA-seq. Approximately half of the genes found to be dysregulated at the exon level were also found to be dysregulated by microarray analysis. Specifically, 2475 genes were found to be dysregulated by both technologies at the Q < 0.05 level. An additional 3283 genes were found to be unique to the microarrays and 2792 were unique to the RNA-seq. The correspondence between the two platforms was better for the exon-level analysis than the whole-gene level of analysis. At the whole-gene level, only 897 genes were found significant by both technologies and only 1308 were unique to the RNA-seq at the Q < 0.05 level of significance. We discuss these differences in more detail below (see Discussion). Overall, the results of exon-level RNA-seq analysis provide further evidence for transcriptional dysregulation resulting from MSEW.
Label-Free Proteomics Identifies Additional Dysregulated Peptides
We compared MSEW and Control B6 mice using label-free proteomics (LFP) technology (Haqqani et al., 2008) which provided further evidence for dysregulation of myelin related proteins and for MSEW effects on translation. A total of 798 proteins were quantified using LFP. As shown in Figure 5A; Table S7 in Supplementary Material, the protein expression changes detected by LFP were mostly in the direction of downregulation (p = 3.65E − 5). Specifically, a total of nine of the significant (Q < 0.05) changes identified involved upregulation whereas 37 of the changes involved downregulation (see Figure 5B). As mentioned previously, this was not the case for the mRNA analyses. The specific proteins found to be dysregulated (at Q < 0.05) are shown in Figure 5C.
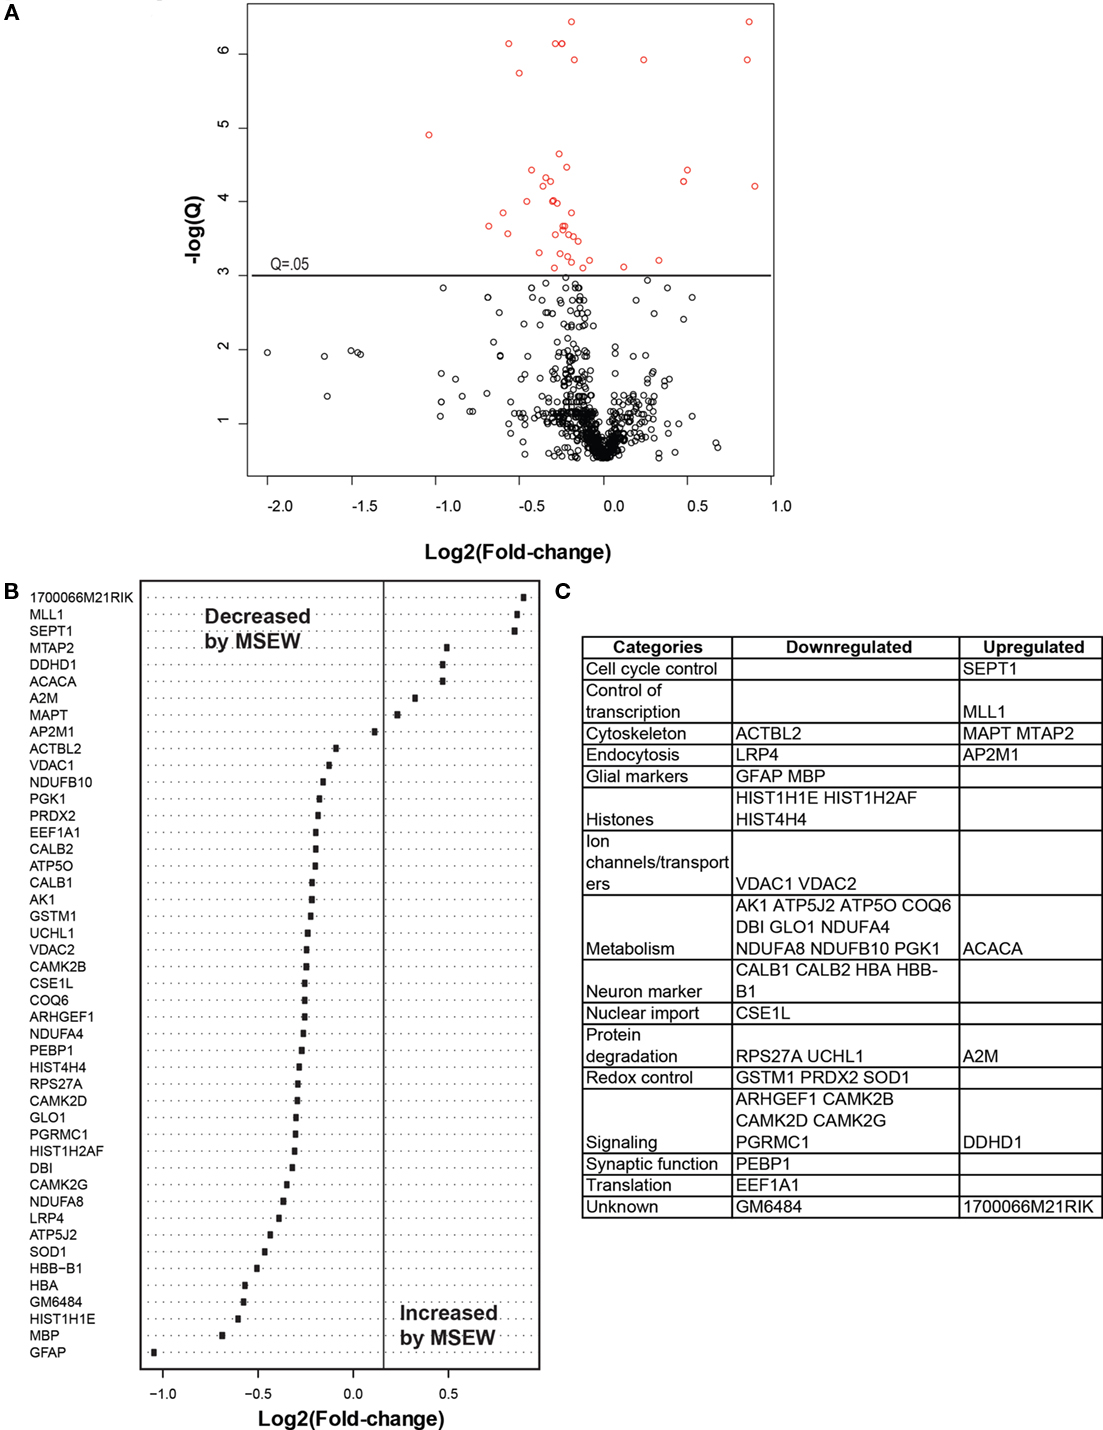
Figure 5. Label-free proteomics analysis. (A) Volcano plot showing negative natural log of the Q-values plotted against the base 2 log of the change for each of the proteins quantified by label-free proteomic analysis comparing control and MSEW animals. Significant proteins (Q < 0.05) are plotted in red. Many more proteins were downregulated by MSEW [negative Log2(fold change)] than upregulated. Fold change values were scored as MSEW/Control. (B) Plot of Log2(fold change) for each of the significantly (Q < 0.05) dysregulated proteins quantified. (C) Categorization of genes showing upregulation and downregulation.
Of particular interest was the reduction in the myelin component MBP. Notably, this effect was consistent with the results obtained by microarray and RNA-seq analysis. Figure 6 shows an example of label-free quantification for 1 of the 12 MBP peptides that we were able to quantify. As is evident from Figure 6A, the effects of MSEW on MBP expression is extremely pronounced and consistent across biological replicates.
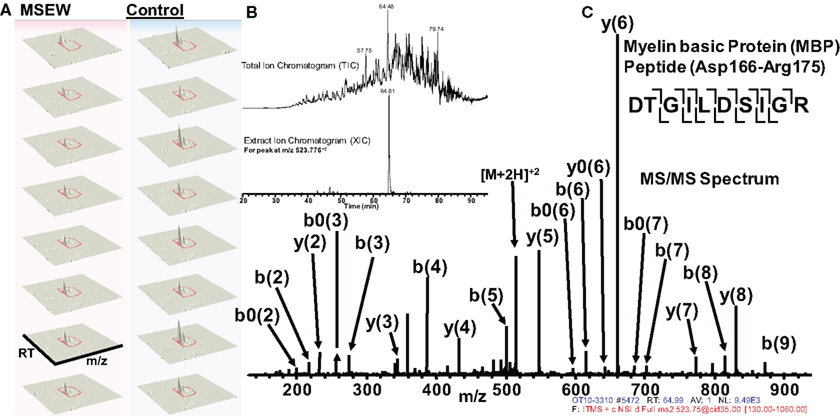
Figure 6. Example of quantification and MS/MS fragmentation of MBP by label-free proteomics. (A) Quantification of 1 of 12 MBP peptides identified illustrating the effects of MSEW on expression. Three dimensional plots [retention time (RT) × mass/charge (m/x) × abundance] are shown for two biological replicates and four technical replicates of the assay. A 1.67-fold decrease of the MBP peptide (Asp166–Arg175) by MSEW was observed. (B) Example of a Total Ion Chromatogram (TIC, upper) and an Extracted Ion Chromatogram (XIC, lower) for the eluting Asp166–Arg175 MBP peptide (m/z at 523.776 + 2). (C) MS/MS spectrum showing the fragmentation pattern for the Asp166–Arg175 MBP peptide; note that all major fragment peaks are identified. The fragmentation pattern for the peptide backbone is illustrated in the inset, upper right.
We again noted a downregulation of components of the translation machinery (EAF1A1; see Figures 5B,C; Table S7 in Supplementary Material). We also saw downregulation of CALB1 and CALB2 (see Figure 5B; Table S7 in Supplementary Material), which are important intracellular calcium buffers. Calb2 knockout mice show impaired neuronal firing and poor motor co-ordination (Schiffmann et al., 1999). CALB1 is often used as a marker of GABAergic neurons along with somatostatin and neuropeptide Y. Although somatostatin and neuropeptide Y were not quantified using LFP, Npy was downregulated by RNA-seq (Log2 Fold change = −0.626, Q = 9.98E − 08) as was Sst (Log2 Fold change = −0.396, Q = 0.0001). These results may be an indication of a loss of GABAergic neurons in the PFC which may be related to the observed changes in myelin-related genes, as discussed in detail in “Discussion” below.
Focused Proteomics Using Multiple Reaction Monitoring Analysis Confirms Protein-Level Dysregulation
We used MRM proteomics methods (Kitteringham et al., 2009) to provide further confirmation of the effects of MSEW on myelin-related proteins. To accomplish this, peptides corresponding to shared and variable regions of myelin-related proteins of interest were identified. We then searched an extensive in-house proteomics database (Shifman et al., 2007) for spectra corresponding to these target proteins. Spectra were filtered based on uniqueness and peak amplitudes and MRM assays were designed based on these previously obtained proteomics datasets and applied to the experimental samples. MS/MS identifications were also obtained simultaneously. As shown in Figure 7, MRM detected significant (Bonferroni corrected p < 0.05) downregulation of the oligodendrocyte proteins CNP, MBP, OMG, and RTN4. MAG reached a nominal level of significance but did not survive Bonferroni correction. These results provide further evidence for significant effects of MSEW on oligodendrocyte related protein expression.
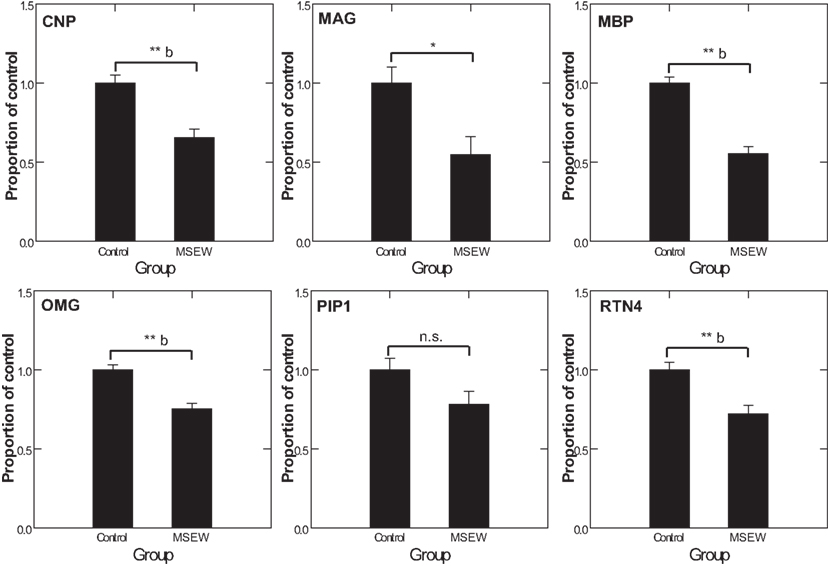
Figure 7. Multiple reaction monitoring (MRM) proteomics analysis. CNP, MAG, MBP, OMG, PLP1, and RTN4 were selected for targeting by focused proteomics using MRM proteomics and were quantified from N = 6 control and N = 6 MSEW samples. Each protein was represented by at least two peptides. The corresponding F tests for the group term were as follows: CNP F(1,13) = 21.42, p < 0.0001; MAG F(1,13) = 8.823, p = 0.011; MBP F(1,13) = 63.88, p < 0.0001; OMG F(1,13) = 24.37, p < 0.0001; PLP1 F(1,13) = 3.907, p = 0.87; RTN4 F(1,13) = 15.649 p = 0.002. (*p < 0.05, **p < 0.005, b Bonferroni corrected p < 0.05).
MSEW Leads to Alterations of DNA Methylation
Because there is evidence that DNA methylation plays a role in development (Covic et al., 2010; Hsieh and Eisch, 2010), and because methylation appears to play a role in the transcriptional response to early experience (Champagne et al., 2006; Auger et al., 2011), we initially explored the role of changes in CpG methylation in the repression of Mbp as well as Actb, both of which were significantly downregulated on microarray analysis and RNA-seq. Methylation within approximately −400 to +200 nt of the transcription start site was determined using bisulfite conversion, followed by PCR, base-specific cleavage, and MALDI-TOF mass spectrometry (Sequenom Inc). CpGs outside of the assay range (<7% or >90% methylation) were excluded. In the case of Mbp, only a single position (CpG 6) showed nominal significance (71.7% methylation in controls, 75.0% methylation in MSEW, p = 0.026; see Table S1 in Supplementary Material for primer sequences) but did not survive multiple comparison correction. Similarly, small changes in the methylation status of the Actb promoter were noted (CpGs 5, 11, and 13; 2.22% methylation in controls, 7.30% methylation in MSEW, p = 0.005; see Figure S1 for genomic regions interrogated) and remained significant after multiple comparison correction.
Given the minimal evidence for methylation changes in Mbp and Actb, we examined another class of genes, namely genes that may impact on the function of the PFC after MSEW. These genes included ion channels (Kcnab2, Kcnh1), genes influencing ion channel function (Drd1, Gad1, Gng2, Gnai, Ppp2r1a, Prkaca, and Prkcc), and determinants of neuronal structure (Cdc42se1 and Rhob) which were found to be dysregulated by microarray analysis. This was motivated by the fact that functional imaging methods have demonstrated medial prefrontal hypoactivity in patients with trauma histories that is strongly correlated with the severity of symptoms (Shin et al., 2006). Such changes may be caused, in part, by changes in the firing properties of prefrontal neurons. p-Values were FDR corrected and no strain × MSEW interactions were noted. As shown in Figure 8; Table S8 in Supplementary Material, we observed significant associations between MSEW and methylation levels for Gng2, Kcnab2, and Ppp2r1a. As shown in Figure 9, in all three cases RNA expression levels and methylation levels showed the expected inverse relationship for both strains of mice tested. Whereas Gng2 and Kcnab2 showed decreased mRNA expression after MSEW in conjunction with increased methylation levels, Ppp2r1a showed increased expression in conjunction with decreased methylation levels. See Figure S1 for the genomic regions interrogated.
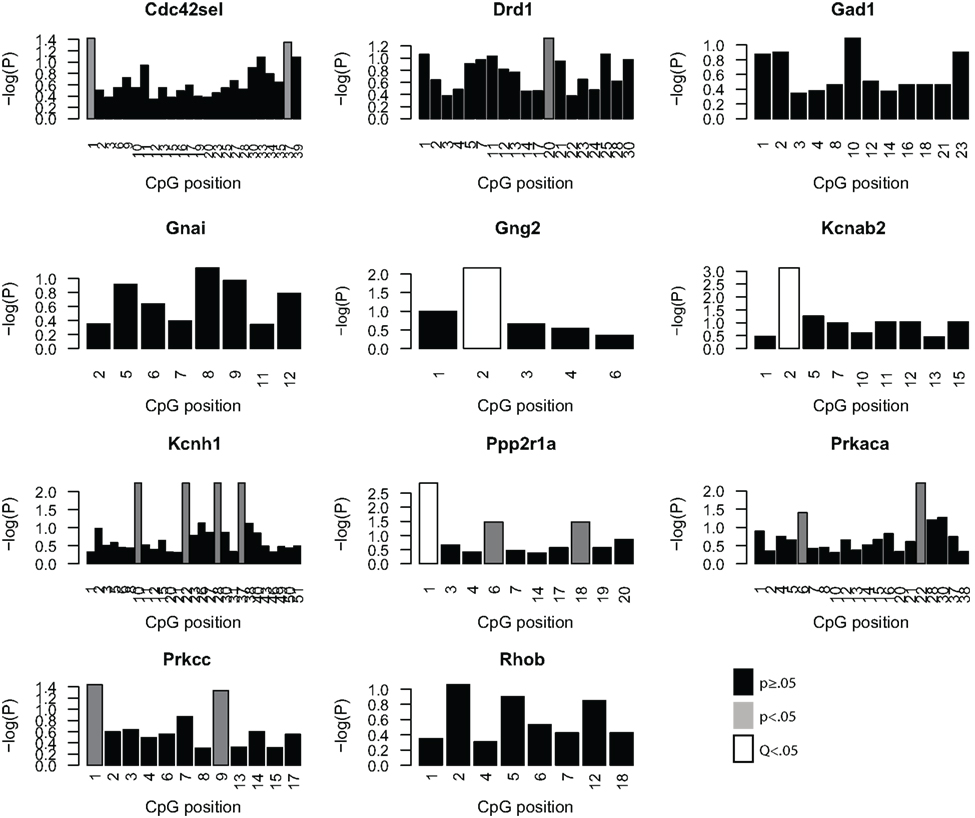
Figure 8. Analysis of promoter CpG methylation for select genes. The genes Cdc42se1, Drd1, Gad1, Gnai, Gng2, Kcnab2, Kcnh1, Ppp2r1a, Prkaca, Prkar1b, and Prkcc were chosen for methylation analysis based on the microarray results, based on significant dysregulation (Q < 0.05), a lack of a significant strain × MSEW interaction effect (Q > 0.1) and because of potential relevance to prefrontal activity. The negative log (base 10) of the p-values for each CpG position, arranged 5′–3′, within the bounds of the assay are plotted for each gene for the comparison of controls and MSEWs of both strains. Nominally significant (p < 0.05) changes in methylation are denoted in gray, and CpG positions significant after false discovery rate correction (Q < 0.05) are denoted in white.
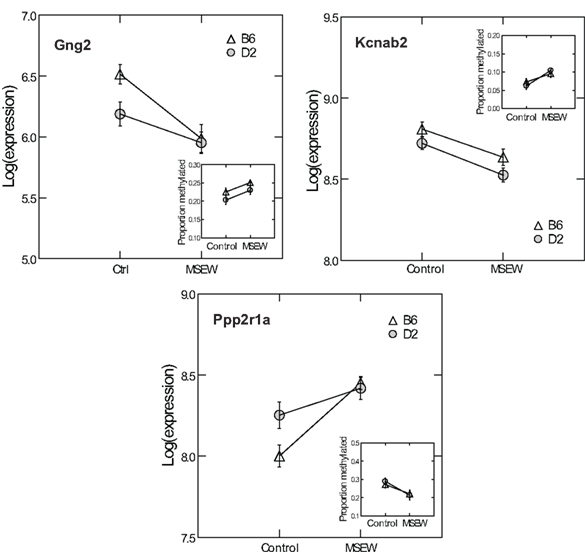
Figure 9. Comparison of RNA expression and CpG methylation. The three CpG positions showing the highest level of significance (Q < 0.05) in Figure 8 (Gng2 CpG position 2, Kcnab2 CpG position 2, and Ppp2r1a CpG position 1) were selected for further analysis. Each plot shows the log of the microarray-based expression levels for the corresponding gene which were all highly significant (Q < 0.01 by microarray analysis). Insets show the proportion methylation of the CpG position in question.
Discussion
Early life neglect is a very significant public health problem but relatively little is known regarding the molecular mechanisms by which neglect affects brain structure, behavior, and cognition. The mouse is an excellent organism to study the pathophysiology of early life neglect since the genome has been fully sequenced and is well annotated, and there are many genetic tools available for manipulations to be performed. However, the mouse is relatively resistant to the effects of early life manipulations (Millstein et al., 2006; Millstein and Holmes, 2007; Parfitt et al., 2007), especially relative to higher mammalian species. After considerable optimization we developed the MSEW model of early life neglect in the mouse that yields robust and long lasting changes in behavior (George et al., 2010). The work presented here was performed in an effort to begin to understand the molecular basis of the effects of early life neglect in the cortex, particularly with regard to alterations in the PFC because of the effects of child abuse and neglect on the structure (De Bellis et al., 2002; Panzer, 2008; Tomoda et al., 2009) and function (Deprince et al., 2009; Samuelson et al., 2010) of this region in children exposed to child maltreatment. Our results suggest particularly significant alterations in genes involved in myelination and translation, summarized in Table S9 in Supplementary Material; Figure 10.
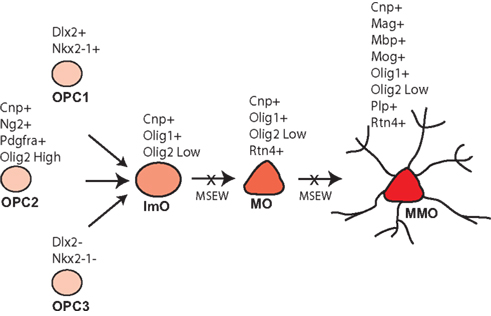
Figure 10. Model of MSEW effects on oligodendrocyte development. Oligodendrocytes develop from oligodendrocyte precursors (OPC 1–3) that can be distinguished on the basis of specific antigens. OPCs then develop into immature oligodendrocytes (ImO), which become mature oligodendrocytes (MO). Mature oligodendrocytes then begin to synthesize the individual components of myelin and become mature, myelinating oligodendrocytes (MMO). Our data are consistent with MSEW inhibiting the differentiation of oligodendrocyte precursors and immature oligodendrocytes to the mature and mature, myelinating stage. Figure is based largely on Bradl and Lassmann (2010).
Changes in white matter are evident in childhood abuse and neglect. Diffusion tensor imaging (DTI) in humans has shown reduced fractional anisotropy in the medial and posterior corpus callosum of maltreated children with post-traumatic stress disorder (PTSD; Jackowski et al., 2008). Alterations have also been observed in the anterior limb of the internal capsule, a fiber tract with important projections to the PFC, of macaques with disrupted mother–infant attachment (Coplan et al., 2010). Additionally, maltreated children with PTSD have reduced volume of the corpus callosum (De Bellis et al., 1999). Disorganization of frontal white matter has been observed in numerous serious psychiatric disorders including major depression (MDD; Nobuhara et al., 2004), schizophrenia (Sussmann et al., 2009; Mamah et al., 2010), bipolar disorder (Sussmann et al., 2009), and obsessive compulsive disorder (OCD; Togao et al., 2010) the biology of this system is therefore of enormous importance.
The data reported here help to constrain models of white matter disruption by early life neglect. Although the medial PFC does not contain dense myelinated fiber tracts, myelinated axons are present (Van De Werd et al., 2010), and myelination in this region is important for normal PFC function (Gregg et al., 2009). As shown in Figure 10, oligodendrocytes develop from three pools of oligodendrocyte precursors (OPCs) that can be differentiated on the basis of marker expression. OPCs give rise to immature oligodendrocytes which then mature (MOG negative) and finally elaborate myelin (MOG positive). The composition of myelin includes MBP, MOG, and PLP, in addition to a lipid component. Myelinating oligodendrocytes are also characterized by the expression of OMG, MOBP, and MAL (Bradl and Lassmann, 2010). A variety of transcription factors play important roles in oligodendrocyte development including NKX2.2 (Qi et al., 2001), NKX6.2 (Southwood et al., 2004), OLIG1 (Li et al., 2007), and OLIG2 (Qi et al., 2001).
RNA-sequencing revealed decreased expression of Mag, Mal, Mbp, Mobp, Mog, Omg, Opalin, and Plp1 mRNA. Exon-level analysis revealed downregulation of Cldn11, Cnp, Ermn, Mag, Mal, Mbp, Mog, Plp1, and Ugt8a. Label-free proteomics showed significant downregulation of MBP, and MRM proteomics revealed downregulation of CNP, MBP, OMG, and RTN4, and MAG reached nominal levels of significance but Plp1 failed to show significance. The power to detect changes by MRM depends on many factors including the number of samples analyzed, the number of adequate transitions quantified for each protein, and the signal to noise ratio for the transitions of interest. Further optimization of our assays may detect changes in PLP1 as well. We also observed downregulation by RNA-seq of Tspan2 which is involved in the terminal differentiation of glia into myelinating oligodendrocytes (Birling et al., 1999; Terada et al., 2002), as well as downregulation of Ugt8a which is involved in the transfer of galactose to ceremide, which forms an essential glycolipid component of myelin (Koul et al., 1980; Hof and Csiza, 1982; Bosio et al., 1996). Therefore, although the precise genes and proteins found to be altered varied somewhat between methods, there was evidence from all of the methods used for MSEW effects on myelin-related gene expression.
Many of the protein products of these genes have known roles in the biology of myelination. Cldn11 knockout mice show slowed nerve conduction and it is involved in forming tight junction intramembranous strands in CNS myelin (Gow et al., 1999). CNP is also associated with myelin and has an essential role in supporting axonal integrity (Lappe-Siefke et al., 2003). ERMN is specifically expressed in myelinating oligodendrocytes (Brockschnieder et al., 2006) and has been found to be dysregulated on a protein level in schizophrenia (Martins-De-Souza et al., 2009). MAG is a myelin component that interacts with the NOGO receptor (RTN4R) on neurons (Domeniconi et al., 2002). MBP is also a myelin component and mutations in Mbp are responsible for the shiverer mouse phenotype which involves deficient CNS myelination as well as tremors and convulsions, a phenotype that is reversed by introduction of a functional Mbp gene (Readhead et al., 1987). Plp1 is genetically associated with Pelizaeus–Merzbacher disease, a hypomyelinative leukodystrophy (Yool et al., 2000), and deletion of Plp1 from the mouse leads to axonal disruption suggesting that olidodendrocytes are required for axon function (Edgar et al., 2004b). Mice deficient in Ugt8a show hypomyelination as well as increased numbers of oligodendrocytes (Marcus et al., 2000). Therefore, downregulation of many of these myelin related genes would be expected to contribute to a myelin phenotype in MSEW mice.
As noted above, we observed downregulation of numerous genes characteristic of mature, myelinating oligodendrocytes. With regard to markers of less mature oligodendrocytes, Dugas et al (2006) reported gene expression changes associated with differentiation of oligodendrocytes from OPCs. A comparison of the genes identified by these authors as showing the largest fold change downregulation during oligodendrocyte differentiation and our RNA-seq database revealed no consistent effect of MSEW on expression (Scg2 – no change; S11a10 – not quantified; Top2a – downregulated; Mki67 – no change; Nptxr – upregulated; Cited2 – no change; Gal (Galn) – not quantified; Ccnd2 – no change). Therefore, it appears that the effects of MSEW are specific for later stages of oligodendrocyte development, particularly myelination. On the basis of these data we hypothesize that OPCs fail to fully differentiate into mature, myelinating oligodendrocytes (see Figure 10).
As mentioned above, early life abuse and neglect forms one of the major risk factors for later onset of a series of psychiatric conditions, including MDD, schizophrenia, PTSD, and substance abuse disorders (Arnow, 2004). Many of these conditions have also been linked to abnormalities in myelin. Myelin regulates the velocity and synchronicity of neuron firing in areas such as the PFC, allowing for coordination between long distance neuronal connections (Fields, 2008). Genetic studies have shown association between SNPs in myelin related genes and schizophrenia, MDD, bipolar disorder and OCD (Stewart et al., 2007; Fields, 2008). Additionally, post mortem studies of myelin related RNA also found decreased abundance of MAG, MBP, PLP, MOG, CNP, and SOX10 transcripts in human PFC in these disorders (Hakak et al., 2001; Tkachev et al., 2003).
Research has demonstrated that early environmental influences can influence risk for schizophrenia and can affect the course of the disorder. Consistent with these findings, childhood maltreatment, especially neglect, is associated with a more severe presentation of schizophrenia, including more functional and social impairment and more hallucinations, delusions, and suicide attempts at the time of presentation (Gil et al., 2009; Vogel et al., 2009; Sar et al., 2010). Recently, Kerns et al. (2010) reported a gene expression analysis of the internal capsule from post mortem schizophrenia samples compared to control samples. As noted by the authors, schizophrenia is associated with significant white matter abnormalities. The authors noted significant decreases in oligodendrocyte density in the schizophrenia brains as determined by stereology from nissl stained tissue, in addition to increased expression of RNA for the cell cycle regulator CCND2 and JAG1, a NOTCH pathway component involved in differentiation. Decreased RNA for PCNA, an RNA upregulated during cell division, and CASP3, which has an important role in governing apoptosis, were also observed. The authors conclude that schizophrenia may involve a failure of OPCs to appropriately exit the cell cycle in order to differentiate and mature into myelinating oligodendrocytes. These results are similar to our findings with respect to MSEW. For example, the cell cycle regulator Ccnd2 was strongly upregulated by RNA-seq. Although we were not able to quantify Jag1, we did detect strong upregulation of Dtx1, another positive regulator of Notch signaling, and we also observed strong downregulation of Pcna. These results suggest that the MSEW model may be useful to understand the mechanism by which early life neglect influences risk for and the expression of schizophrenia.
Many studies have found decreased functional anisotropy in human PFC in a series of disorders including ADHD, autism and OCD in addition to the disorders referred to above (Fields, 2008). There are two current theories as to how dysmyelination in the above disorders may lead to impaired neural function. Firstly, conduction velocity along excitatory glutamatergic nerve fibers may be altered, disrupting synchrony of firing. This may lead to impaired regulation of GABAergic interneurons, and dysregulation of other neurotransmitters in connected functional circuits, for example dopamine in the striatum (Fields, 2008). It is interesting to note that there was evidence of decreased markers of GABAergic interneurons in both our RNA-seq and label-free proteomics investigations (CALB1 in LFP, Npy in RNA-seq). Secondly, myelin forms an inhibitory environment for axon sprouting, which is important for correct formation of synapses in response to environmental stimuli (Fields, 2008).
The coincidence of oligodendrocyte changes and neuronal changes is not surprising, given that reciprocal interactions between neurons and oligodendrocyte precursors in the early post natal brain regulates all stages of the myelination process from proliferation, differentiation and survival of oligodendrocyte precursors (OPCs), recognition and attachment of oligodendrocytes to axons, and finally wrapping and compaction of the myelin sheath (Simons and Trajkovic, 2006). These interactions continue to be important throughout development. The interactions between oligodendrocytes and neurons must attain a fine equilibrium. While myelin is generally presumed to have an inhibitory effect on neuronal regrowth, for example through the reticulon-4/Nogo A pathway (Domeniconi et al., 2002; Giger et al., 2008), support from oligodendrocyte proteins is also required for neuronal maintenance (Nave and Trapp, 2008). In addition to their roles in myelin stability, studies of human disease and knock out mouse models have clearly demonstrated that the myelin associated proteins CNP (Lappe-Siefke et al., 2003), PLP (Griffiths et al., 1998; Edgar et al., 2004a; Inoue, 2005) and MAG (Bartsch et al., 1997; Schnaar and Lopez, 2009) are essential for maintaining axonal integrity. Thus it is conceivable that changes in the expression of these proteins, as observed for the MSEW model, may lead to disruptions of axonal structure and function.
Multiple levels of evidence from MSEW mice suggest there may be a repression of translation in these animals. Although RNA expression changes induced by MSEW were primarily in the positive direction, Label-Free Proteomics analysis revealed a significant bias in the direction of decreased protein expression. Both RNA level analyses showed an enrichment for the GO category of translation as a great many translation-related mRNA were downregulated. In the label-free proteomics analysis, a hypothesis free approach to assessing the abundance of protein, there was more than a fourfold excess of downregulated proteins relative to upregulated proteins. We observed bidirectional dysregulation of genes involved in protein translation by microarray analysis and RNA-seq. It is possible that transcriptional repression of some of these genes led to downregulation of the corresponding gene products, but that certain other genes showed upregulation of RNA expression in compensation (e.g., Cyld). Further research will be required to clarify these issues.
Translation occurs in three steps, consisting of initiation, elongation, and termination. Deficits in the factors controlling the rate limiting step of translation initiation are particularly evident in the microarray dataset, although all three stages are represented to some extent. These deficits include EIF4E, which binds the mRNA cap to aid association of the mRNA with the ribosomal subunits, EIF4A, an ATP dependant RNA helicase, and multiple components of EIF3, a 13 subunit complex which regulates assembly of the 40S ribosomal subunit (Sonenberg, 2008). Similarly, EIF1A is involved in determining the selection of the translation start site on the mRNA transcript, ensuring appropriate assembly of the ribosomal subunits (Mitchell and Lorsch, 2008), while EIF2B and EIF5A play roles in generating and recycling the EIF2-GDP complex that forms with every round of translation (Kapp and Lorsch, 2004). Furthermore, decreased expression is observed for many components of the ribosomal subunits themselves (the RPL and RPS gene families). Finally, a similar dysregulation of translation is also apparent in mitochondria, including many members of the mitochondrial ribosomal families (MRPL and RPL) and the mitochondrial peptide chain release factor MTRF1. Because certain proteins are synthesized by ribosomes that are present in neuronal axons and dendrites (Rodriguez et al., 2008; Skup, 2008; Gumy et al., 2010), and mitochondria are also present in these compartments (Cheng et al., 2010), it is possible that the reduction in RNAs and proteins involved in translation is due to disruption of dendrites and/or axons as a consequence of MSEW, but this hypothesis will require further research to verify.
We also conducted a limited number of focused methylation assays and observed particularly strong relationships with regard to Gng2, Kcnab2, and Ppp2r1a which showed altered methylation and altered expression. Further research will be required to more fully define the epigenetic changes induced by MSEW, and such studies are in progress in our laboratory.
The relationships observed between methylation and expression in the two genes (see Figure 9) highlight an interesting phenomenon. Although D2 and B6 strains did not differ significantly with regard to methylation levels, the effects of alterations in methylation by MSEW differed between the strains. As is evident in Figure 9, Gng2 and Ppp2r1a showed reduced strain differences after MSEW compared to the control condition despite similar changes in methylation levels. There are a number of possible explanations for these results. First, we noted that MSEW does seem to cause a slight convergence of expression levels between the two strains generally. To quantify this across the genome, we calculated the absolute value of the log2 ratios between D2 and B6 mice and analyzed this as a function of whether there was a significant MSEW effect in at least one of the strains. For the genes that did not differ as a function of MSEW (Q ≥ 0.05), controls showed slightly higher strain differences than MSEW animals (0.027 vs. 0.019, p < 0.0001 by paired t-test). For the genes that showed some MSEW effect (Q < 0.05) there was a somewhat greater reduction in the strain difference as a function of MSEW (0.050 vs. 0.030, p < 0.0001 by paired t-test). We cannot determine whether these effects are due to strain differences in the influence of methylation on the basis of our data, however, such strain (genetic) effects on the consequences of altered methylation are possible. For example, if the strains have SNP polymorphisms at particularly important CpG positions, methylation could influence gene expression differentially.
Because we used microarrays as well as RNA-seq technology for RNA expression analysis we had the opportunity to compare the technologies. Several studies have provided initial insight into the technical noise and reproducibility of Illumina RNA-seq runs. These second-generation sequencing methods appear less susceptible to confounding technical variation than array-based methods (Sims et al., 2008; Kitchen et al., 2010). Several recent studies have also compared RNA-seq favorably to numerous array-based approaches to interrogating the transcriptome (Bloom et al., 2009; Agarwal et al., 2010; Bradford et al., 2010; Liu et al., 2010) and have shown enhanced resolution to detect expression at exon-boundaries and a less biased quantification of transcript-level gene expression. As noted above, quantification at the level of entire genomic loci is very different than quantification at the level of exons or microarray probes. At the exon level, we observed a moderate level of agreement with the microarray results. Overlap was lower when RNA-seq was quantified at the whole-gene locus level, which is logical given the very different level of analysis. More analysis of technical differences between the technologies is in progress and will be the subject of a future report.
Similarly, we quantified the effects of MSEW on RNA as well as protein expression. As noted in the “Results” section, the two types of analysis did not lead to identical patterns of expression changes although certain important categories were identified by both sets of methods, as noted above. For many genes the relationship between RNA and protein expression has been found to be non-linear and this lack of correlation has been the subject of a number of published studies (Griffin et al., 2002; Greenbaum et al., 2003; Bitton et al., 2008; Bitton et al., 2010). In the case of microarrays it is likely that this lack of correlation is due in part to imperfect probe/target hybridization and variable technical noise in the reported expression levels of microarrays (Kitchen et al., 2010). However, it is not entirely clear that poor RNA/protein correlation is not, at least in some part, attributable to biological processes. Biological explanations may include differential RNA stability, antisense transcription of interfering RNA, post-translational modifications, and mechanisms that cause protein expression to feed back on the regulation of transcription, and these issues warrant further investigation in future studies.
Conclusion
Further work will be required to determine the relative contribution of the genes identified here in determining the phenotype that results from MSEW. Taken together with the previously reported behavioral changes resulting from MSEW, we believe that the MSEW model will prove to be highly fruitful as a platform for translational neuroscience studies focused on treating and preventing the sequelae of early life neglect in humans.
Conflict of Interest Statement
The authors declare that the research was conducted in the absence of any commercial or financial relationships that could be construed as a potential conflict of interest.
Acknowledgments
This work was supported by NIDA grant DA022251 to Arthur A. Simen, a pilot grant from the Yale Center for Translational Study of Alcoholism NIAAA grant P50 AA A06377 to Arthur A. Simen, a grant from the Yale Center for Genomics to Arthur A. Simen, a grant from the Conway family to Arthur A. Simen, and NINDS grant 5U24NS051869 to Shrikant M. Mane. The proteomics work was supported by NIA grant DA018343. Elizabeth D. George and Kelly A. Bordner were supported by NIMH grant T32-MH14276. Kelly A. Bordner was also supported by NIA Services grant P01 AG 030004-01A1. Arthur A. Simen was supported by NCRR grant RR024138 and NIA grant AG030970 and a grant from the Yale Pepper Center. Alvaro Duque was supported by NIH grant 2 R01 NS014841-31. The authors wish to acknowledge the support of the Yale Center for High Performance Computation in Biology and Biomedicine and NIH grant RR19895 which funded the computing instrumentation. The authors wish to thank Irina Tikhonova for performing the Sequenom assays, Michael Snyder, Sherman Weissman, Jane Taylor, Shannon Gourley, and Joan Kaufman for helpful discussions, Kiran D. Patel for her skillful assistance, and Terence Wu for his assistance with the label-free proteomic analyses. This study was carried out in strict accordance with the recommendations in the Guide for the Care and Use of Laboratory Animals of the National Institutes of Health. This work was approved by the Yale Institutional Animal Care and Use Committee.
Supplementary Material
The Supplementary Material for this article can be found online at http://www.frontiersin.org/Neurogenomics/10.3389/fpsyt.2011.00018/abstract/
Footnotes
References
Agarwal, A., Koppstein, D., Rozowsky, J., Sboner, A., Habegger, L., Hillier, L. W., Sasidharan, R., Reinke, V., Waterston, R. H., and Gerstein, M. (2010). Comparison and calibration of transcriptome data from RNA-Seq and tiling arrays. BMC Genomics 11, 383. doi: 10.1186/1471-2164-11-383
Anisman, H., Zaharia, M. D., Meaney, M. J., and Merali, Z. (1998). Do early-life events permanently alter behavioral and hormonal responses to stressors? Int. J. Dev. Neurosci. 16, 149–164.
Arnow, B. A. (2004). Relationships between childhood maltreatment, adult health and psychiatric outcomes, and medical utilization. J. Clin. Psychiatry 65(Suppl. 12), 10–15.
Auger, A. P., Jessen, H. M., and Edelmann, M. N. (2011). Epigenetic organization of brain sex differences and juvenile social play behavior. Horm. Behav. 59, 358–363.
Bartsch, S., Montag, D., Schachner, M., and Bartsch, U. (1997). Increased number of unmyelinated axons in optic nerves of adult mice deficient in the myelin-associated glycoprotein (MAG). Brain Res. 762, 231–234.
Bhatia, S. K., and Bhatia, S. C. (2007). Childhood and adolescent depression. Am. Fam. Physician 75, 73–80.
Bindea, G., Mlecnik, B., Hackl, H., Charoentong, P., Tosolini, M., Kirilovsky, A., Fridman, W. H., Pages, F., Trajanoski, Z., and Galon, J. (2009). ClueGO: a Cytoscape plug-in to decipher functionally grouped gene ontology and pathway annotation networks. Bioinformatics 25, 1091–1093.
Birling, M. C., Tait, S., Hardy, R. J., and Brophy, P. J. (1999). A novel rat tetraspan protein in cells of the oligodendrocyte lineage. J. Neurochem. 73, 2600–2608.
Bitton, D. A., Okoniewski, M. J., Connolly, Y., and Miller, C. J. (2008). Exon level integration of proteomics and microarray data. BMC Bioinformatics 9, 118. doi: 10.1186/1471-2105-9-118
Bitton, D. A., Smith, D. L., Connolly, Y., Scutt, P. J., and Miller, C. J. (2010). An integrated mass-spectrometry pipeline identifies novel protein coding-regions in the human genome. PLoS ONE 5, e8949. doi: 10.1371/journal.pone.0008949
Bloom, J. S., Khan, Z., Kruglyak, L., Singh, M., and Caudy, A. A. (2009). Measuring differential gene expression by short read sequencing: quantitative comparison to 2-channel gene expression microarrays. BMC Genomics 10, 221. doi: 10.1186/1471-2164-10-221
Bosio, A., Binczek, E., and Stoffel, W. (1996). Molecular cloning and characterization of the mouse CGT gene encoding UDP-galactose ceramide-galactosyltransferase (cerebroside synthetase). Genomics 35, 223–226.
Bradford, J. R., Hey, Y., Yates, T., Li, Y., Pepper, S. D., and Miller, C. J. (2010). A comparison of massively parallel nucleotide sequencing with oligonucleotide microarrays for global transcription profiling. BMC Genomics 11, 282. doi: 10.1186/1471-2164-11-282
Bradl, M., and Lassmann, H. (2010). Oligodendrocytes: biology and pathology. Acta Neuropathol. 119, 37–53.
Brockschnieder, D., Sabanay, H., Riethmacher, D., and Peles, E. (2006). Ermin, a myelinating oligodendrocyte-specific protein that regulates cell morphology. J. Neurosci. 26, 757–762.
Champagne, F. A., Weaver, I. C., Diorio, J., Dymov, S., Szyf, M., and Meaney, M. J. (2006). Maternal care associated with methylation of the estrogen receptor-alpha1b promoter and estrogen receptor-alpha expression in the medial preoptic area of female offspring. Endocrinology 147, 2909–2915.
Cheng, A., Hou, Y., and Mattson, M. P. (2010). Mitochondria and neuroplasticity. ASN Neuro 2, e00045.
Coplan, J. D., Abdallah, C. G., Tang, C. Y., Mathew, S. J., Martinez, J., Hof, P. R., Smith, E. L., Dwork, A. J., Perera, T. D., Pantol, G., Carpenter, D., Rosenblum, L. A., Shungu, D. C., Gelernter, J., Kaffman, A., Jackowski, A., Kaufman, J., and Gorman, J. M. (2010). The role of early life stress in development of the anterior limb of the internal capsule in nonhuman primates. Neurosci. Lett. 480, 93–96.
Covic, M., Karaca, E., and Lie, D. C. (2010). Epigenetic regulation of neurogenesis in the adult hippocampus. Heredity 105, 122–134.
Cui, X., Hwang, J. T., Qiu, J., Blades, N. J., and Churchill, G. A. (2005). Improved statistical tests for differential gene expression by shrinking variance components estimates. Biostatistics 6, 59–75.
De Bellis, M. D., Keshavan, M. S., Clark, D. B., Casey, B. J., Giedd, J. N., Boring, A. M., Frustaci, K., and Ryan, N. D. (1999). A.E. Bennett Research Award. Developmental traumatology. Part II: Brain development. Biol. Psychiatry 45, 1271–1284.
De Bellis, M. D., Keshavan, M. S., Shifflett, H., Iyengar, S., Beers, S. R., Hall, J., and Moritz, G. (2002). Brain structures in pediatric maltreatment-related posttraumatic stress disorder: a sociodemographically matched study. Biol. Psychiatry 52, 1066–1078.
De Bellis, M. D., and Thomas, L. A. (2003). Biologic findings of post-traumatic stress disorder and child maltreatment. Curr. Psychiatry Rep. 5, 108–117.
De Kloet, E. R., Sibug, R. M., Helmerhorst, F. M., and Schmidt, M. V. (2005). Stress, genes and the mechanism of programming the brain for later life. Neurosci. Biobehav. Rev. 29, 271–281.
Deprince, A. P., Weinzierl, K. M., and Combs, M. D. (2009). Executive function performance and trauma exposure in a community sample of children. Child Abuse Negl. 33, 353–361.
Diamond, M. C., Krech, D., and Rosenzweig, M. R. (1964). The effects of an enriched environment on the histology of the rat cerebral cortex. J. Comp. Neurol. 123, 111–120.
Domeniconi, M., Cao, Z., Spencer, T., Sivasankaran, R., Wang, K., Nikulina, E., Kimura, N., Cai, H., Deng, K., Gao, Y., He, Z., and Filbin, M. (2002). Myelin-associated glycoprotein interacts with the Nogo66 receptor to inhibit neurite outgrowth. Neuron 35, 283–290.
Dugas, J. C., Tai, Y. C., Speed, T. P., Ngai, J., and Barres, B. A. (2006). Functional genomic analysis of oligodendrocyte differentiation. J. Neurosci. 26, 10967–10983.
Edgar, J.M., Mclaughlin, M., Barrie, J.A., Mcculloch, M.C., Garbern, J., and Griffiths, I.R. (2004a). Age-related axonal and myelin changes in the rumpshaker mutation of the Plp gene. Acta. Neuropathol. 107, 331–335.
Edgar, J. M., Mclaughlin, M., Yool, D., Zhang, S. C., Fowler, J. H., Montague, P., Barrie, J. A., Mcculloch, M. C., Duncan, I. D., Garbern, J., Nave, K. A., and Griffiths, I. R. (2004b). Oligodendroglial modulation of fast axonal transport in a mouse model of hereditary spastic paraplegia. J. Cell Biol. 166, 121–131.
Fields, R. D. (2008). White matter in learning, cognition and psychiatric disorders. Trends Neurosci. 31, 361–370.
George, E. D., Bordner, K. A., Elwafi, H. M., and Simen, A. A. (2010). Maternal separation with early weaning: a novel mouse model of early life neglect. BMC Neurosci. 11, 123. doi: 10.1186/1471-2202-11-123
Giger, R.J., Venkatesh, K., Chivatakarn, O., Raiker, S.J., Robak, L., Hofer, T., Lee, H., and Rader, C. (2008). Mechanisms of CNS myelin inhibition: evidence for distinct and neuronal cell type specific receptor systems. Restor. Neurol. Neurosci. 26, 97–115.
Gil, A., Gama, C. S., De Jesus, D. R., Lobato, M. I., Zimmer, M., and Belmonte-De-Abreu, P. (2009). The association of child abuse and neglect with adult disability in schizophrenia and the prominent role of physical neglect. Child Abuse Negl. 33, 618–624.
Gow, A., Southwood, C. M., Li, J. S., Pariali, M., Riordan, G. P., Brodie, S. E., Danias, J., Bronstein, J. M., Kachar, B., and Lazzarini, R. A. (1999). CNS myelin and sertoli cell tight junction strands are absent in Osp/claudin-11 null mice. Cell 99, 649–659.
Greenbaum, D., Colangelo, C., Williams, K., and Gerstein, M. (2003). Comparing protein abundance and mRNA expression levels on a genomic scale. Genome Biol. 4, 117.
Gregg, J. R., Herring, N. R., Naydenov, A. V., Hanlin, R. P., and Konradi, C. (2009). Downregulation of oligodendrocyte transcripts is associated with impaired prefrontal cortex function in rats. Schizophr. Res. 113, 277–287.
Griffin, T. J., Gygi, S. P., Ideker, T., Rist, B., Eng, J., Hood, L., and Aebersold, R. (2002). Complementary profiling of gene expression at the transcriptome and proteome levels in Saccharomyces cerevisiae. Mol. Cell. Proteomics 1, 323–333.
Griffiths, I., Klugmann, M., Anderson, T., Yool, D., Thomson, C., Schwab, M.H., Schneider, A., Zimmermann, F., Mcculloch, M., Nadon, N., and Nave, K.A. (1998). Axonal swellings and degeneration in mice lacking the major proteolipid of myelin. Science 280, 1610–1613.
Gumy, L. F., Tan, C. L., and Fawcett, J. W. (2010). The role of local protein synthesis and degradation in axon regeneration. Exp. Neurol. 223, 28–37.
Gutman, D. A., and Nemeroff, C. B. (2002). Neurobiology of early life stress: rodent studies. Semin. Clin. Neuropsychiatry 7, 89–95.
Hakak, Y., Walker, J. R., Li, C., Wong, W. H., Davis, K. L., Buxbaum, J. D., Haroutunian, V., and Fienberg, A. A. (2001). Genome-wide expression analysis reveals dysregulation of myelination-related genes in chronic schizophrenia. Proc. Natl. Acad. Sci. U.S.A. 98, 4746–4751.
Haqqani, A., Kelly, J., and Stanimirovic, D. (2008). Quantitative protein profiling by mass spectrometry using label-free proteomics. Methods Mol. Biol. 439, 241–256.
Hildyard, K. L., and Wolfe, D. A. (2002). Child neglect: developmental issues and outcomes. Child Abuse Negl. 26, 679–695.
Hirosawa, M., Hoshida, M., Ishikawa, M., and Toya, T. (1993). MASCOT: multiple alignment system for protein sequences based on three-way dynamic programming. Comput. Appl. Biosci. 9, 161–167.
Hof, L., and Csiza, C. K. (1982). Developmental changes in glycolipid synthesizing enzymes in the brain of a myelin-deficient mutant Wistar rat. J. Neurochem. 39, 1434–1439.
Hsieh, J., and Eisch, A. J. (2010). Epigenetics, hippocampal neurogenesis, and neuropsychiatric disorders: unraveling the genome to understand the mind. Neurobiol. Dis. 39, 73–84.
Inoue, K. (2005). PLP1-related inherited dysmyelinating disorders: Pelizaeus-Merzbacher disease and spastic paraplegia type 2. Neurogenetics 6, 1–16.
Jackowski, A. P., Douglas-Palumberi, H., Jackowski, M., Win, L., Schultz, R. T., Staib, L. W., Krystal, J. H., and Kaufman, J. (2008). Corpus callosum in maltreated children with posttraumatic stress disorder: a diffusion tensor imaging study. Psychiatry Res. 162, 256–261.
Juraska, J. M., and Kopcik, J. R. (1988). Sex and environmental influences on the size and ultrastructure of the rat corpus callosum. Brain Res. 450, 1–8.
Kapp, L. D., and Lorsch, J. R. (2004). The molecular mechanics of eukaryotic translation. Annu. Rev. Biochem. 73, 657–704.
Kaufman, J., Yang, B. Z., Douglas-Palumberi, H., Crouse-Artus, M., Lipschitz, D., Krystal, J. H., and Gelernter, J. (2007). Genetic and environmental predictors of early alcohol use. Biol. Psychiatry 61, 1228–1234.
Kerns, D., Vong, G. S., Barley, K., Dracheva, S., Katsel, P., Casaccia, P., Haroutunian, V., and Byne, W. (2010). Gene expression abnormalities and oligodendrocyte deficits in the internal capsule in schizophrenia. Schizophr. Res. 120, 150–158.
Kitchen, R. R., Sabine, V. S., Sims, A. H., Macaskill, E. J., Renshaw, L., Thomas, J. S., Van Hemert, J. I., Dixon, J. M., and Bartlett, J. M. (2010). Correcting for intra-experiment variation in Illumina BeadChip data is necessary to generate robust gene-expression profiles. BMC Genomics 11, 134. doi: 10.1186/1471-2164-11-134
Kitteringham, N. R., Jenkins, R. E., Lane, C. S., Elliott, V. L., and Park, B. K. (2009). Multiple reaction monitoring for quantitative biomarker analysis in proteomics and metabolomics. J. Chromatogr. B Analyt. Technol. Biomed. Life Sci. 877, 1229–1239.
Kotch, J. B., Lewis, T., Hussey, J. M., English, D., Thompson, R., Litrownik, A. J., Runyan, D. K., Bangdiwala, S. I., Margolis, B., and Dubowitz, H. (2008). Importance of early neglect for childhood aggression. Pediatrics 121, 725–731.
Koul, O., Chou, K. H., and Jungalwala, F. B. (1980). UDP-galactose-ceramide galactosyltransferase in rat brain myelin subfractions during development. Biochem. J. 186, 959–969.
Lappe-Siefke, C., Goebbels, S., Gravel, M., Nicksch, E., Lee, J., Braun, P. E., Griffiths, I. R., and Nave, K. A. (2003). Disruption of Cnp1 uncouples oligodendroglial functions in axonal support and myelination. Nat. Genet. 33, 366–374.
Li, H., Lu, Y., Smith, H. K., and Richardson, W. D. (2007). Olig1 and Sox10 interact synergistically to drive myelin basic protein transcription in oligodendrocytes. J. Neurosci. 27, 14375–14382.
Liu, S., Lin, L., Jiang, P., Wang, D., and Xing, Y. (2010). A comparison of RNA-Seq and high-density exon array for detecting differential gene expression between closely related species. Nucleic Acids Res. 39, 578–588.
Mamah, D., Conturo, T. E., Harms, M. P., Akbudak, E., Wang, L., Mcmichael, A. R., Gado, M. H., Barch, D. M., and Csernansky, J. G. (2010). Anterior thalamic radiation integrity in schizophrenia: a diffusion-tensor imaging study. Psychiatry Res. 183, 144–150.
Marcus, J., Dupree, J. L., and Popko, B. (2000). Effects of galactolipid elimination on oligodendrocyte development and myelination. Glia 30, 319–328.
Martins-De-Souza, D., Gattaz, W. F., Schmitt, A., Rewerts, C., Marangoni, S., Novello, J. C., Maccarrone, G., Turck, C. W., and Dias-Neto, E. (2009). Alterations in oligodendrocyte proteins, calcium homeostasis and new potential markers in schizophrenia anterior temporal lobe are revealed by shotgun proteome analysis. J. Neural Transm. 116, 275–289.
Mathews, C. A., Kaur, N., and Stein, M. B. (2008). Childhood trauma and obsessive-compulsive symptoms. Depress. Anxiety 25, 742–751.
Maxfield, M. G., and Widom, C. S. (1996). The cycle of violence. Revisited 6 years later. Arch. Pediatr. Adolesc. Med. 150, 390–395.
Millstein, R. A., and Holmes, A. (2007). Effects of repeated maternal separation on anxiety- and depression-related phenotypes in different mouse strains. Neurosci. Biobehav. Rev. 31, 3–17.
Millstein, R. A., Ralph, R. J., Yang, R. J., and Holmes, A. (2006). Effects of repeated maternal separation on prepulse inhibition of startle across inbred mouse strains. Genes Brain Behav. 5, 346–354.
Mitchell, S. F., and Lorsch, J. R. (2008). Should I stay or should I go? Eukaryotic translation initiation factors 1 and 1A control start codon recognition. J. Biol. Chem. 283, 27345–27349.
Nave, K. A., and Trapp, B. D. (2008). Axon-glial signaling and the glial support of axon function. Annu. Rev. Neurosci. 31, 535–561.
Nobuhara, K., Okugawa, G., Minami, T., Takase, K., Yoshida, T., Yagyu, T., Tajika, A., Sugimoto, T., Tamagaki, C., Ikeda, K., Sawada, S., and Kinoshita, T. (2004). Effects of electroconvulsive therapy on frontal white matter in late-life depression: a diffusion tensor imaging study. Neuropsychobiology 50, 48–53.
Ouyang, L., Fang, X., Mercy, J., Perou, R., and Grosse, S. D. (2008). Attention-deficit/hyperactivity disorder symptoms and child maltreatment: a population-based study. J. Pediatr. 153, 851–856.
Panzer, A. (2008). The neuroendocrinological sequelae of stress during brain development: the impact of child abuse and neglect. Afr. J. Psychiatry (Johannesbg) 11, 29–34.
Parfitt, D. B., Walton, J. R., Corriveau, E. A., and Helmreich, D. L. (2007). Early life stress effects on adult stress-induced corticosterone secretion and anxiety-like behavior in the C57BL/6 mouse are not as robust as initially thought. Horm. Behav. 52, 417–426.
Qi, Y., Cai, J., Wu, Y., Wu, R., Lee, J., Fu, H., Rao, M., Sussel, L., Rubenstein, J., and Qiu, M. (2001). Control of oligodendrocyte differentiation by the Nkx2.2 homeodomain transcription factor. Development 128, 2723–2733.
Readhead, C., Popko, B., Takahashi, N., Shine, H. D., Saavedra, R. A., Sidman, R. L., and Hood, L. (1987). Expression of a myelin basic protein gene in transgenic shiverer mice: correction of the dysmyelinating phenotype. Cell 48, 703–712.
Robinson, M. D., Mccarthy, D. J., and Smyth, G. K. (2010). edgeR: a Bioconductor package for differential expression analysis of digital gene expression data. Bioinformatics 26, 139–140.
Rodriguez, A. J., Czaplinski, K., Condeelis, J. S., and Singer, R. H. (2008). Mechanisms and cellular roles of local protein synthesis in mammalian cells. Curr. Opin. Cell Biol. 20, 144–149.
Samuelson, K. W., Krueger, C. E., Burnett, C., and Wilson, C. K. (2010). Neuropsychological functioning in children with posttraumatic stress disorder. Child Neuropsychol. 16, 119–133.
Sar, V., Taycan, O., Bolat, N., Ozmen, M., Duran, A., Ozturk, E., and Ertem-Vehid, H. (2010). Childhood trauma and dissociation in schizophrenia. Psychopathology 43, 33–40.
Schnaar, R.L., and Lopez, P.H. (2009). Myelin-associated glycoprotein and its axonal receptors. J. Neurosci. Res. 87, 3267–3276.
Schiffmann, S. N., Cheron, G., Lohof, A., D’alcantara, P., Meyer, M., Parmentier, M., and Schurmans, S. (1999). Impaired motor coordination and Purkinje cell excitability in mice lacking calretinin. Proc. Natl. Acad. Sci. U.S.A. 96, 5257–5262.
Shannon, P., Markiel, A., Ozier, O., Baliga, N. S., Wang, J. T., Ramage, D., Amin, N., Schwikowski, B., and Ideker, T. (2003). Cytoscape: a software environment for integrated models of biomolecular interaction networks. Genome Res. 13, 2498–2504.
Shifman, M. A., Li, Y., Colangelo, C. M., Stone, K. L., Wu, T. L., Cheung, K. H., Miller, P. L., and Williams, K. R. (2007). YPED: a web-accessible database system for protein expression analysis. J. Proteome Res. 6, 4019–4024.
Shin, L. M., Rauch, S. L., and Pitman, R. K. (2006). Amygdala, medial prefrontal cortex, and hippocampal function in PTSD. Ann. N. Y. Acad. Sci. 1071, 67–79.
Simons, M., and Trajkovic, K. (2006). Neuron-glia communication in the control of oligodendrocyte function and myelin biogenesis. J. Cell. Sci. 119, 4381–4389.
Sims, A. H., Smethurst, G. J., Hey, Y., Okoniewski, M. J., Pepper, S. D., Howell, A., Miller, C. J., and Clarke, R. B. (2008). The removal of multiplicative, systematic bias allows integration of breast cancer gene expression datasets – improving meta-analysis and prediction of prognosis. BMC Med. Genomics 1, 42. PMID: 18803878
Skup, M. (2008). Dendrites as separate compartment – local protein synthesis. Acta Neurobiol. Exp. (Wars) 68, 305–321.
Sonenberg, N. (2008). eIF4E, the mRNA cap-binding protein: from basic discovery to translational research. Biochem. Cell Biol. 86, 178–183.
Southwood, C., He, C., Garbern, J., Kamholz, J., Arroyo, E., and Gow, A. (2004). CNS myelin paranodes require Nkx6-2 homeoprotein transcriptional activity for normal structure. J. Neurosci. 24, 11215–11225.
Stewart, S. E., Platko, J., Fagerness, J., Birns, J., Jenike, E., Smoller, J. W., Perlis, R., Leboyer, M., Delorme, R., Chabane, N., Rauch, S. L., Jenike, M. A., and Pauls, D. L. (2007). A genetic family-based association study of OLIG2 in obsessive-compulsive disorder. Arch. Gen. Psychiatry 64, 209–214.
Sussmann, J. E., Lymer, G. K., Mckirdy, J., Moorhead, T. W., Munoz Maniega, S., Job, D., Hall, J., Bastin, M. E., Johnstone, E. C., Lawrie, S. M., and Mcintosh, A. M. (2009). White matter abnormalities in bipolar disorder and schizophrenia detected using diffusion tensor magnetic resonance imaging. Bipolar Disord. 11, 11–18.
Teicher, M. H., Ito, Y., Glod, C. A., Andersen, S. L., Dumont, N., and Ackerman, E. (1997). Preliminary evidence for abnormal cortical development in physically and sexually abused children using EEG coherence and MRI. Ann. N. Y. Acad. Sci. 821, 160–175.
Teicher, M. H., Tomoda, A., and Andersen, S. L. (2006). Neurobiological consequences of early stress and childhood maltreatment: are results from human and animal studies comparable? Ann. N. Y. Acad. Sci. 1071, 313–323.
Terada, N., Baracskay, K., Kinter, M., Melrose, S., Brophy, P. J., Boucheix, C., Bjartmar, C., Kidd, G., and Trapp, B. D. (2002). The tetraspanin protein, CD9, is expressed by progenitor cells committed to oligodendrogenesis and is linked to beta1 integrin, CD81, and Tspan-2. Glia 40, 350–359.
Tkachev, D., Mimmack, M. L., Ryan, M. M., Wayland, M., Freeman, T., Jones, P. B., Starkey, M., Webster, M. J., Yolken, R. H., and Bahn, S. (2003). Oligodendrocyte dysfunction in schizophrenia and bipolar disorder. Lancet 362, 798–805.
Togao, O., Yoshiura, T., Nakao, T., Nabeyama, M., Sanematsu, H., Nakagawa, A., Noguchi, T., Hiwatashi, A., Yamashita, K., Nagao, E., Kanba, S., and Honda, H. (2010). Regional gray and white matter volume abnormalities in obsessive-compulsive disorder: a voxel-based morphometry study. Psychiatry Res. 184, 29–37.
Tomoda, A., Suzuki, H., Rabi, K., Sheu, Y. S., Polcari, A., and Teicher, M. H. (2009). Reduced prefrontal cortical gray matter volume in young adults exposed to harsh corporal punishment. Neuroimage 47(Suppl. 2), T66–T71.
Trent, L., Stander, V., Thomsen, C., and Merrill, L. (2007). Alcohol abuse among U.S. Navy recruits who were maltreated in childhood. Alcohol Alcohol. 42, 370–375.
Us-Government-Report. (2008). Child Maltreatment 2008. A.O.C. U.S. Department of Health and Human Services Administration for Children and Families, Youth, and Families, Washington, DC.
Van De Werd, H. J., Rajkowska, G., Evers, P., and Uylings, H. B. (2010). Cytoarchitectonic and chemoarchitectonic characterization of the prefrontal cortical areas in the mouse. Brain Struct. Funct. 214, 339–353.
Vogel, M., Spitzer, C., Kuwert, P., Moller, B., Freyberger, H. J., and Grabe, H. J. (2009). Association of childhood neglect with adult dissociation in schizophrenic inpatients. Psychopathology 42, 124–130.
Widom, C. S., Dumont, K., and Czaja, S. J. (2007a). A prospective investigation of major depressive disorder and comorbidity in abused and neglected children grown up. Arch. Gen. Psychiatry 64, 49–56.
Widom, C. S., White, H. R., Czaja, S. J., and Marmorstein, N. R. (2007b). Long-term effects of child abuse and neglect on alcohol use and excessive drinking in middle adulthood. J. Stud. Alcohol Drugs 68, 317–326.
Keywords: early life neglect, microarray analysis, proteomic analysis, RNA-sequencing, prefrontal cortex, oligodendrocytes, translation
Citation: Bordner KA, George ED, Carlyle BC, Duque A, Kitchen RR, Lam TT, Colangelo CM, Stone KL, Abbott TB, Mane SM, Nairn AC and Simen AA (2011) Functional genomic and proteomic analysis reveals disruption of myelin-related genes and translation in a mouse model of early life neglect. Front. Psychiatry 2:18. doi: 10.3389/fpsyt.2011.00018
Received: 21 February 2011;
Accepted: 11 April 2011;
Published online: 25 April 2011.
Edited by:
Mark Reimers, Virginia Commonwealth University, USAReviewed by:
Rafael Fernández-Chacón, The Neuroscience Institute at Seville, SpainJessica Connelly, University of Virginia, USA
Copyright: © 2011 Bordner, George, Carlyle, Duque, Kitchen, Lam, Colangelo, Stone, Abbott, Mane, Nairn and Simen. This is an open-access article subject to a non-exclusive license between the authors and Frontiers Media SA, which permits use, distribution and reproduction in other forums, provided the original authors and source are credited and other Frontiers conditions are complied with.
*Correspondence: Arthur A. Simen, Divisions of Molecular Psychiatry, Human Genetics, and Aging Research, Department of Psychiatry, Yale University School of Medicine, 300 George Street, Suite 901, New Haven, CT 06511-6624, USA. e-mail: arthur.simen@yale.edu