Imaging of thalamocortical dysrhythmia in neuropsychiatry
- 1 Department of Physiology and Neuroscience, New York University School of Medicine, New York, NY, USA
- 2 Department of Psychiatry, New York University School of Medicine, New York, NY, USA
- 3 Department of Environmental Medicine, New York University School of Medicine, New York, NY, USA
Abnormal brain activity dynamics, in the sense of a thalamocortical dysrhythmia (TCD), has been proposed as the underlying mechanism for a subset of disorders that bridge the traditional delineations of neurology and neuropsychiatry. In order to test this proposal from a psychiatric perspective, a study using magnetoencephalography (MEG) was implemented in subjects with schizophrenic spectrum disorder (n = 14), obsessive–compulsive disorder (n = 10), or depressive disorder (n = 5) and in control individuals (n = 18). Detailed CNS electrophysiological analysis of these patients, using MEG, revealed the presence of abnormal theta range spectral power with typical TCD characteristics, in all cases. The use of independent component analysis and minimum-norm-based methods localized such TCD to ventromedial prefrontal and temporal cortices. The observed mode of oscillation was spectrally equivalent but spatially distinct from that of TCD observed in other related disorders, including Parkinson’s disease, central tinnitus, neuropathic pain, and autism. The present results indicate that the functional basis for much of these pathologies may relate most fundamentally to the category of calcium channelopathies and serve as a model for the cellular substrate for low-frequency oscillations present in these psychiatric disorders, providing a basis for therapeutic strategies.
Introduction
Schizophrenia, called the paradigmatic illness of psychiatry (Sadock et al., 2009) was recognized as a medical ailment in antiquity. Indeed, symptoms that are now delineated in the latest Diagnostic and Statistical Manual of Mental Disorders (DSM) can be found in writings from ancient Greece (Hippocrates 460–377 BC). From its inception in the nineteenth century the formal study of schizophrenia as a separate diagnostic entity has been the subject of intricate theorization. From a strict scientific perspective its pathophysiology has closely followed advances in neuroscience and in the technology it wields. The goal of such research has, for the most part, been directed toward understanding the basic pathophysiology of the disorder in the hope of finding appropriate treatments. More recently, emphasis has expanded toward defining objective diagnostic tools that may help delineate the nature of the dysfunction on basic scientific terms.
With respect to understanding the pathophysiology of schizophrenia, until recently, theories have belonged to one of two broad categories, morphological in the sense of neuropathology (Segall et al., 2009; Skudlarski et al., 2010; White et al., 2011) or biochemical focusing on particular neurotransmitter systems (Tsai and Coyle, 2002; Gordon, 2010; Marek et al., 2010; Seeman, 2010). Although electrophysiological abnormalities have long been recognized in schizophrenia patients, it is only recently that a third category has emerged. This may be called electrophysiological or oscillatory. This theory is based on the finding of abnormal brain oscillations in patients at rest or while performing a task and is the subject of a journal issue (Ford and Mathalon, 2008) and a recent review (Uhlhaas and Singer, 2010). The approach is integrative in that it incorporates elements of the other two categories (Gonzalez-Burgos and Lewis, 2008). This novel troika promises a more integrated approach toward defining a truly objective diagnostic criterion. In fact, a recent review has asked if changes in brain rhythms may be used as an objective diagnostic tool, but concluded “not yet” (Galderisi et al., 2009) due partly to the variety in methods used in the studies. Indeed, this is the general conclusion with respect to the search for biomarkers whether based on chemical analysis of plasma (Domenici et al., 2010), fMRI (Kim et al., 2003), or electrophysiology (Buchsbaum, 2009; Clark et al., 2009; Ferreira and Busatto, 2010) for other major categories of psychiatric disorders in addition to schizophrenia. The emergence of an interest in brain rhythms has paralleled the development of computational tools for the analysis of oscillatory dynamics using time–frequency analysis (Rudin, 1962) and an understanding of the generation of oscillations by single neurons (Llinas, 1988).
The present work tests the hypothesis that a decisive factor in schizophrenia and other psychiatric disorders is the generation of abnormal recurrent neuronal activation that is evidenced by abnormal thalamocortical rhythm epiphenomena, i.e., a thalamocortical dysrhythmia (TCD). This assertion is based on an understanding of the intrinsic oscillatory properties of thalamic neurons (Jahnsen and Llinas, 1984; Llinas, 1988; Steriade and Llinas, 1988; Jeanmonod et al., 1996) thalamocortical anatomy (Jones, 1998), and biochemical influences on the thalamocortical circuit (Behrendt, 2006).
Included in this study are groups of patients with obsessive–compulsive disorder (OCD) and major depressive disorder (DD) that were sent to our center for magnetoencephalography (MEG) scans of spontaneous brain activity. They are included here to extend our study to other psychiatric disorders. This is a pilot study in which we investigated whether this approach would warrant an in depth study.
Materials and Methods
The database for this study comprised 11 women and 19 men (15–64 years of age, mean, SEM 40.5 ± 2.7) referred to us having been diagnosed with a psychiatric disorder according to DSM-IV criteria (American Psychiatric Association, 2000). The control group comprised 8 healthy women and 10 healthy men (23–67 years of age, mean, SEM 33.5 ± 3.4 years) with no reported neurological or psychiatric history. The NYU Institutional Review Board and Bellevue Hospital Research Protocol Review Group approved the study and an informed written consent was obtained from all subjects before the MEG recordings.
MEG Data Acquisition
All MEG recordings were carried out in a mu-metal magnetically shielded room using our original 148-channels (4-D Neuroimaging) whole-head magnetometer system while the person was supine. (For comparison, one schizophrenia spectrum disorder (SSD), OCD, and DD patient was imaged with our new 275-channel (CTF System) in the sitting position.) A set of three MEG recordings (filtered 1–100 Hz; sampling rate 508 Hz), each lasting 7-min, was made from each person. Two sets of recordings were made with the eyes closed (EC) and one with the eyes open (EO). The location of the head was monitored during the recordings using electrodes placed at three standard fiducial marker points (left and right preauricular points, and the nasion). The head shape, including the location of the three fiducial markers, was obtained for each subject using a 3-D tracking system by moving a stylus to each fiducial point and over the surface of the head (Fastrak, Polhemus, Colchester, VT, USA).
MEG Data Analysis of Power Spectra
Electrocardiograms were recorded off-line for heartbeat-artifact minimization. A channel-by-channel minimization of cardiac and distant-source artifacts was carried out following our published protocols (Schulman et al., 2005). All raw data were inspected visually and movement artifacts (as may occur during swallowing or eye blinking) or periods of large amplitude slow waves were eliminated from further analysis. Since we were interested in identifying abnormal brain rhythms in patients with neuropsychiatric disorders, the energy of the MEG signal as a function of frequency, which is the power spectral density, was calculated for each recording session. We used a multi-taper approach, which provides reduced-variance calculations of frequency (Llinas et al., 1999; Mitra and Pesaran, 1999). To quantify the relative spectral power distribution among groups, the mean spectral energy (MSE) was calculated in five frequency bands; theta (4–7.9 Hz), alpha (8–11.9 Hz), low beta (12–17.9 Hz), high beta (18–29.9 Hz), gamma (30–69.9 Hz) by dividing the total spectral power in a band by the bandwidth in Hertz (Makela et al., 1998). Multiple-response logistic regression was performed to check the age effect on diagnosis group. No effect of age was found. Then the absolute MSE was compared by t-tests between controls and each patient group, separately. Bonferroni adjustment was used to adjust the p-value in the process of multiple comparisons. SAS9.2 (SAS Institute Inc., Cary, NC, USA) was used for statistical analysis and p < 0.05 was considered significant.
For classification of individual subjects into patient or control group, classical linear discriminant analysis (DA) was carried out with spectral band power as feature vector. In order to summarize the data and because spectra from all electrodes had a similar shape and scale, we averaged the log-transformed spectra of all MEG sensors for each subject. The DA determines the linear combination of parameters that best separate two groups, in the sense that it maximizes the “between-to-within” variance ratio. Each subject was then assigned to the closest group based on this linear combination. As the feature vector for DA was the MSE in the five frequency bands.
MEG Independent Component Analysis
Localization of the site of origin of the brain’s rhythmic activity recorded with the EC was implemented for both patients and controls using independent component analysis (ICA). ICA decomposes the MEG data into spatially stationary components that are independent of each other. We used the Infomax EEGLab algorithm (Makeig et al., 1997). For each recording, this method generated a set of independent components (ICs) that were ranked according to the MEG variance accounted for by each component. Those with the lowest order of variance have the largest projection to the scalp and make the largest contribution to the signal. Results from spatial ICA provided 148 ICs for each recording (the same number as sensors). The first 50 ICs make the largest contribution to the signal and were examined in detail.
Selection of independent components
For each subject, 10–12 ICs were selected for localization. These IC met the following criteria; (1) the frequency of the IC corresponded to a dominant peak in the power spectrum of the patients, (2) the sensor distribution of the IC had a dipolar magnetic configuration, and (3) the component had a low variance (IC1–40). Some ICs was selected on the basis of the presence of low-frequency activity in the theta (4–8 Hz) frequency range. Such low-frequency activity is not typical of healthy adults and we asked if such activity was present in neuropsychiatric patients. Some ICs were selected on the basis of the presence of activity in the alpha frequency range (8–11.9 Hz). Alpha activity is the dominant activity in awake healthy adults (Nunez et al., 2001). This allowed us to ascertain if such normal activity was present in neuropsychiatric patients and if its localization was similar to that of healthy controls.
Localization of independent components
Each selected component in all the patients and in 10 of the controls was localized onto a population-average T1-weighted MRI using the information from the fiducial markers and head shape as described in Schulman et al. (2005). Concerning visualization, results were smoothed with a 3-D Gaussian kernel and linearly interpolated on the reconstructed gray-matter surface of a high resolution population-averaged MRI previously segmented into gray and white matter with the FreeSurfer software package (Fischl et al., 2002). Results were projected onto partially inflated brains. Matlab (The Mathworks, Natick, MA, USA) and custom in-house software were used for all analyses. For illustration, one representative theta IC and one representative alpha IC were selected for each patient and for 10 of the controls. The average localization for each group was then obtained by squaring current values to provide directionless units of power, normalizing the power values for all subjects, and averaging the spatial scaling factors. Using these values, the averaged data was re-plotted on a standardized brain.
Results
Clinical Description
The demographics and clinical description of the 29 patients are summarized in Table 1. The primary diagnosis (listed first in the Diagnosis and Symptom Domain column) was SSD in 14 patients, OCD in 10 patients, and major DD in 5 patients. Of those diagnosed with SSD, 11 had positive symptoms (hallucinations, delusions), of these: two also expressed disorganized behavior, two also expressed negative or deficit symptoms and one also expressed obsessive symptoms. Three of the SSD patients had primary negative or defective symptoms. Six of the OCD patients and four of the SSD patients were also diagnosed with depression. Thus, most of the patients presented with combined, chronic neuropsychiatric symptoms. Twenty-three of the patients were taking one or more of the following medications: antidepressant (16), anticonvulsant (9), atypical neuroleptic (8), benzodiazepine (4), lithium (3), anticholinergic (1), clonidine (1), typical neuroleptic (1), stimulant (1). The global assessment of functioning (GAF) scale was accessed in 17 of the patients. The demographics for the control group are given in Table 2; none of the controls were taking psychoactive medications.
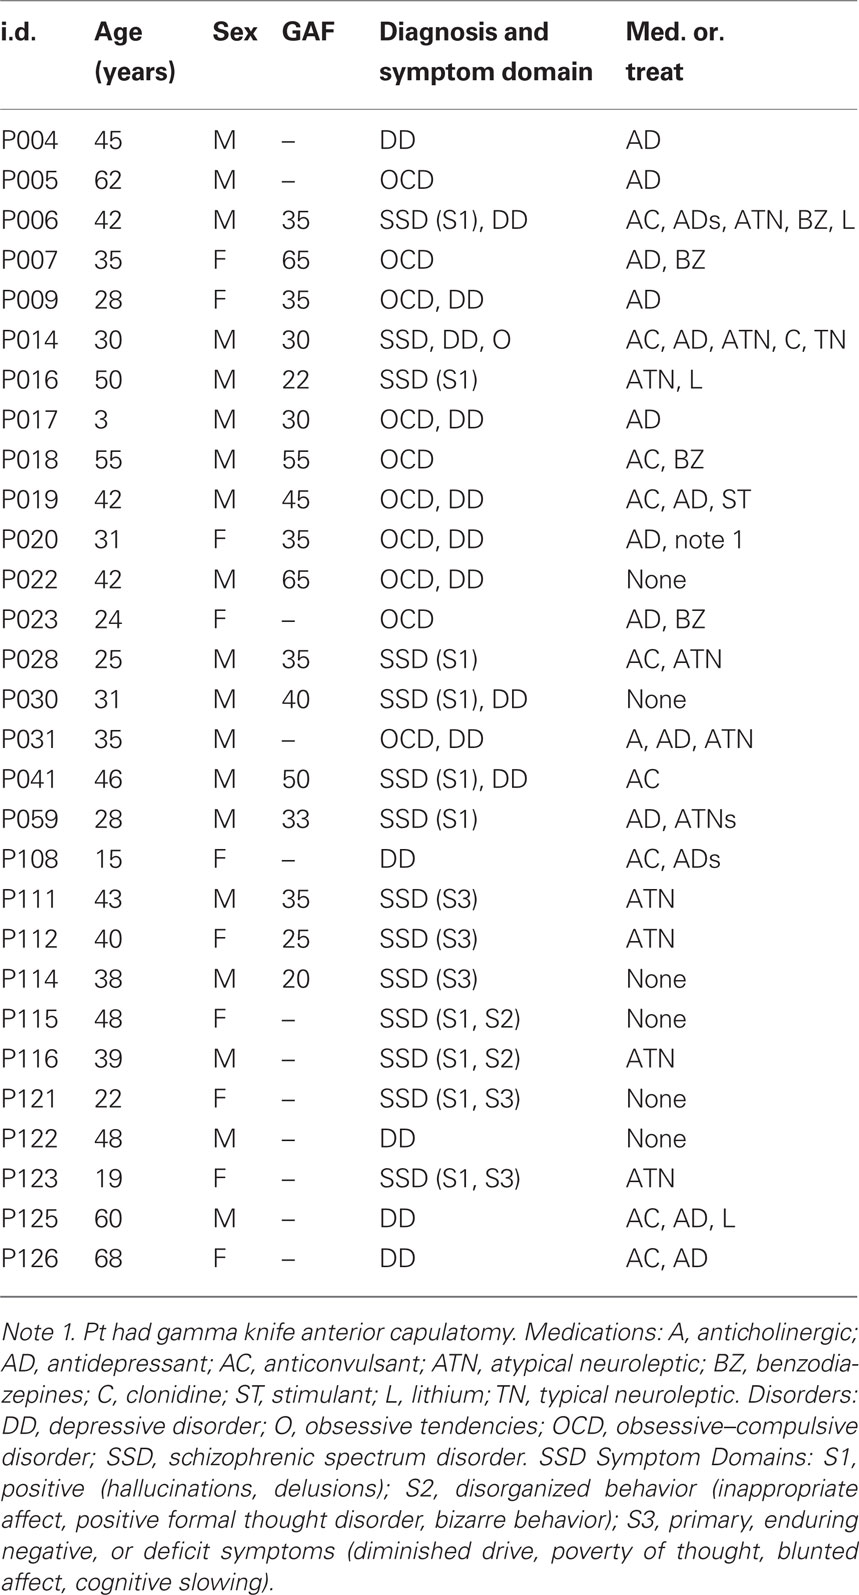
Table 1. Demographics, diagnosis, medication class for neuropsychiatric patients.
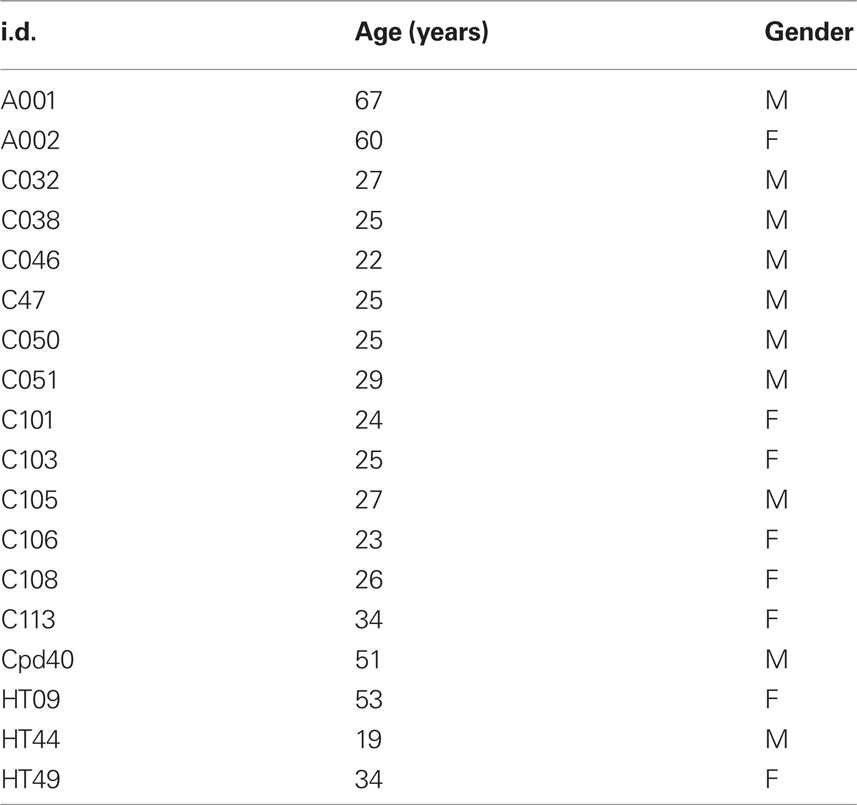
Table 2. Control subjects demographics.
Spectral Outcomes
Abnormal brain rhythms were present in all of the neuropsychiatric patients. This was determined by comparing the global power spectra for the patients and controls. The individual power spectra (gray) and group mean (red) for the controls are superimposed in Figure 1A. Note that the dominant peak is in the alpha frequency range (8–12 Hz). Individual power spectra and group mean for the SSD, OCD, and DD patients are superimposed in Figures 1B–D, respectively. The difference between the control and patient groups is clearly seen in Figure 1E where the mean power spectra for all the patients and controls are superimposed. Note that the dominant peak in the control group (red) is in the alpha range, while that for the patient group (blue) extends into the theta range, and that the power in beta range (12–30 Hz) is greater in the patient group. This difference, shown in Figure 1E, reached significance only in the theta band. This was largely due to the contribution of the OCD group as seen in Figure 1F that superimposes the mean power spectra for each patient group and the controls. In addition to the extension of the dominant peak to lower frequencies in all patient groups, note that the OCD group shows the greatest difference from controls in terms of power and was significantly larger in the theta, alpha, high beta, and gamma ranges (gamma not shown). Differences in MSE between other groups were not statistically significant in any of the five frequency bands. (The recordings made with the new CTF system were similar to those with the older system and are not discussed further).
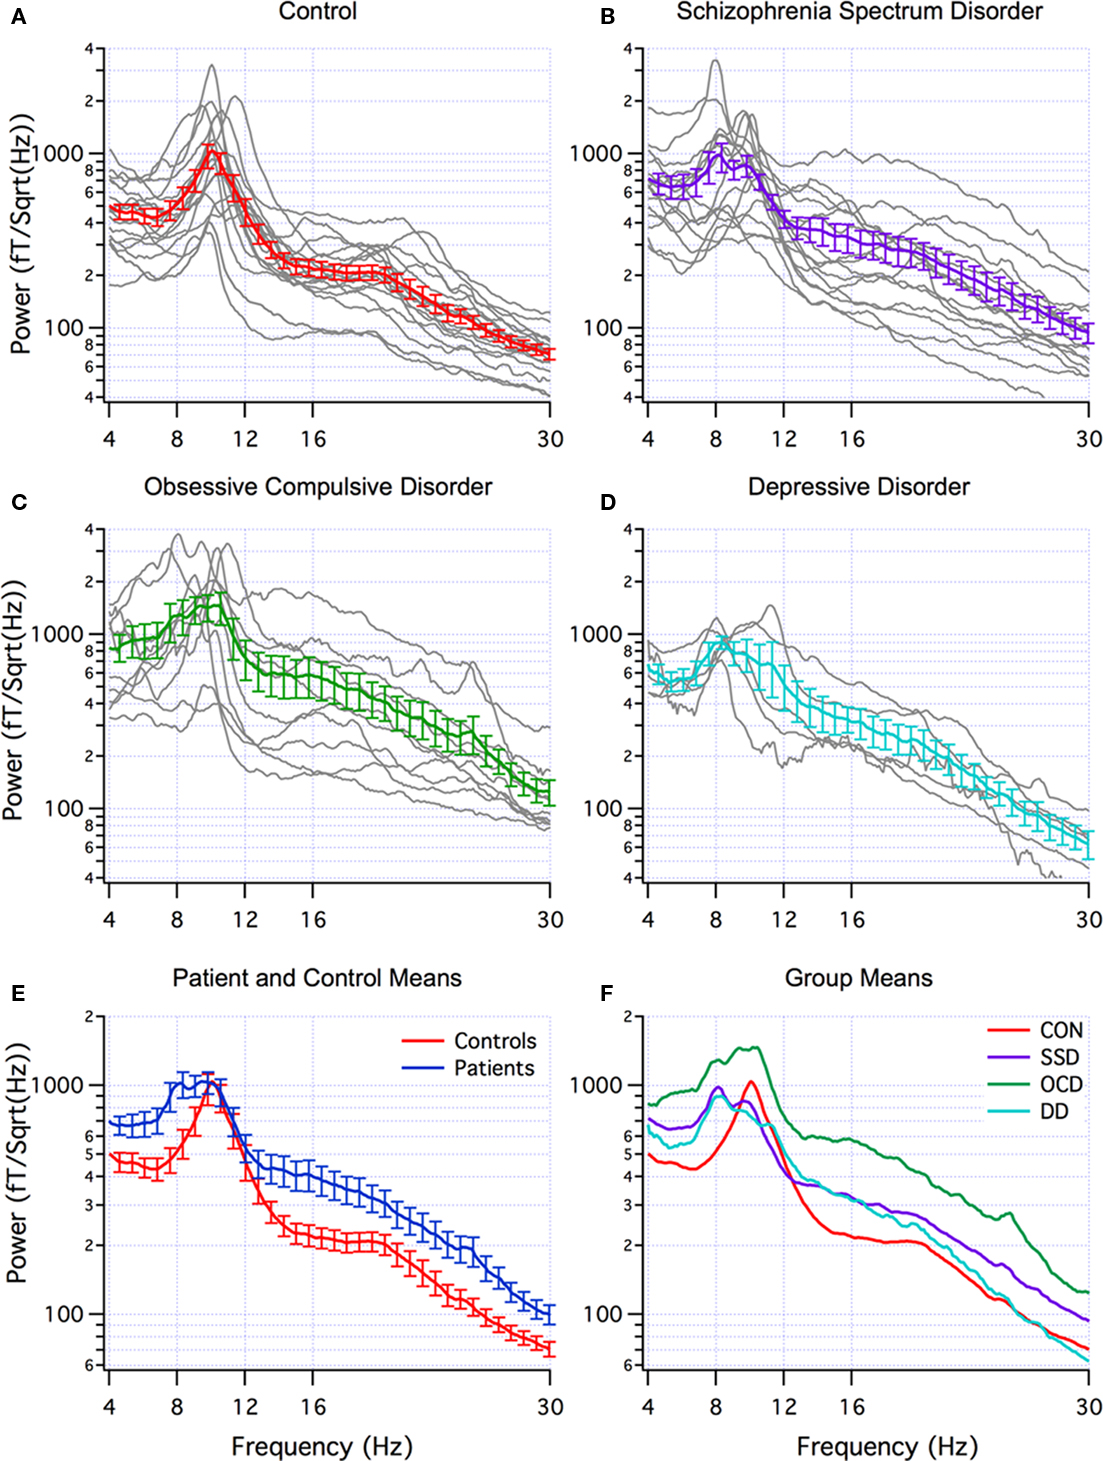
Figure 1. Multi-taper power spectra. (A–D) Individual (grey) and mean (±SEM) spectra for controls (red, n=18), schizophrenic spectrum disorder (SSD) (purple, n=14), obsessive-compulsive disorder (OCD) patients (green, n=10), and depression disorder (DD) (blue, n=5). (E) Superposition of mean (±SEM) of all patients (blue) and controls (red). (F) Superposition of means from A–D.
When DA was applied using the mean band power as feature detectors to distinguish patients from controls, the most effective bands were theta (4–8 Hz) and gamma (30–70 Hz) for all patients (70% correct) and for OCD patients (83% correct). Low beta (12–18 Hz) and gamma (30–70 Hz) were the most effective for SSD patients (69% correct) and for DD patients (87% correct). DA was also applied to distinguishing between OCD and SSD patient groups. The most effective bands were the same as for distinguishing between patients and controls; theta and gamma or low beta and gamma (both 75% correct).
ICA and Localization
Independent components with power in the theta frequency range were seen in 8 of the 18 controls and all 29 patients. Alpha range ICs were seen in all controls and patients. The individual localizations of the components are superimposed on a standardized brain in Figures 2A,C–5A,C. We included this superposition so that the localization of each subject was illustrated. The mean localization is shown in Figures 2B,D–5B,D. Localization of the theta components is shown in Figures 2A,B–5A,B, and the alpha component localization is shown in Figures 2C,D–5C,D. No statistical analysis of the localizations has been attempted so these are exploratory findings.
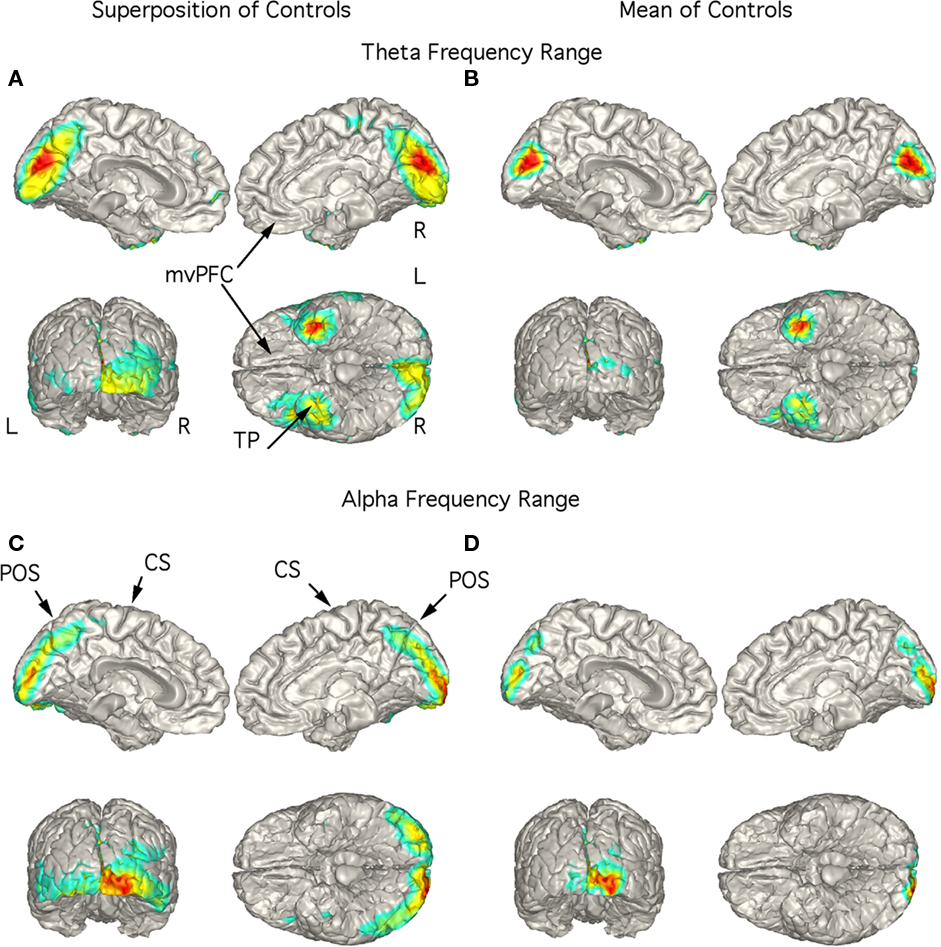
Figure 2. Localization of theta and alpha band current sources in controls. (A) Superposition of theta range independent components (ICs) seen in 8 of the 18 controls. Note that activity is to mesial occipital extending into the parietal cortex and left temporal pole (TP). (B) Mean of localizations shown in (A). This localization is in contrast to that for the patients in Figures 3–5. (C) Superposition of alpha ICs seen in all controls (10 are shown). (D) Mean of localizations shown in (D). Abbreviations: CS, central sulcus; L, left; mvPFC, medial ventral pre-frontal cortex; POS, parieto-occipital sulcus; R, right; TP, temporal pole.
Controls
Although low-frequency activity did not predominate in the overall power spectra of the controls (Figure 1A), there were 1–3 low-frequency ICs in 8 of the 18 controls. Unlike the patients, these did not correspond to peaks in the power spectrum. These ICs were localized to the region of the mesial occipital cortex and left temporal pole (TP; Figures 2A,B). Alpha frequency ICs predominated in all the controls with superposition of the localization of these ICs being found in the posterior brain regions bilaterally (Figure 2C). The mean localization was to the mesial and posterior occipital cortex (Figure 2D).
Schizophrenia spectrum disorder
In the 14 SSD patients, the strongest current sources for the theta range ICs were consistently localized to ventromedial prefrontal cortex (vmPFC; including medial aspect of the orbitofrontal cortex) and TP bilaterally as seen in the superposition of individual localizations (Figure 3A) as well as in the mean localization (Figure 3B). Indeed, the figure showing the superposition of all 14 patients did not have any strong current sources in other brain regions (Figure 3A). Superposition of the current sources for alpha range activity of each SSD patient shows low levels of activity in various brain regions (Figure 3C), however, the mean localization was to the mesial and posterior occipital cortex (Figure 3D) as in the control group.
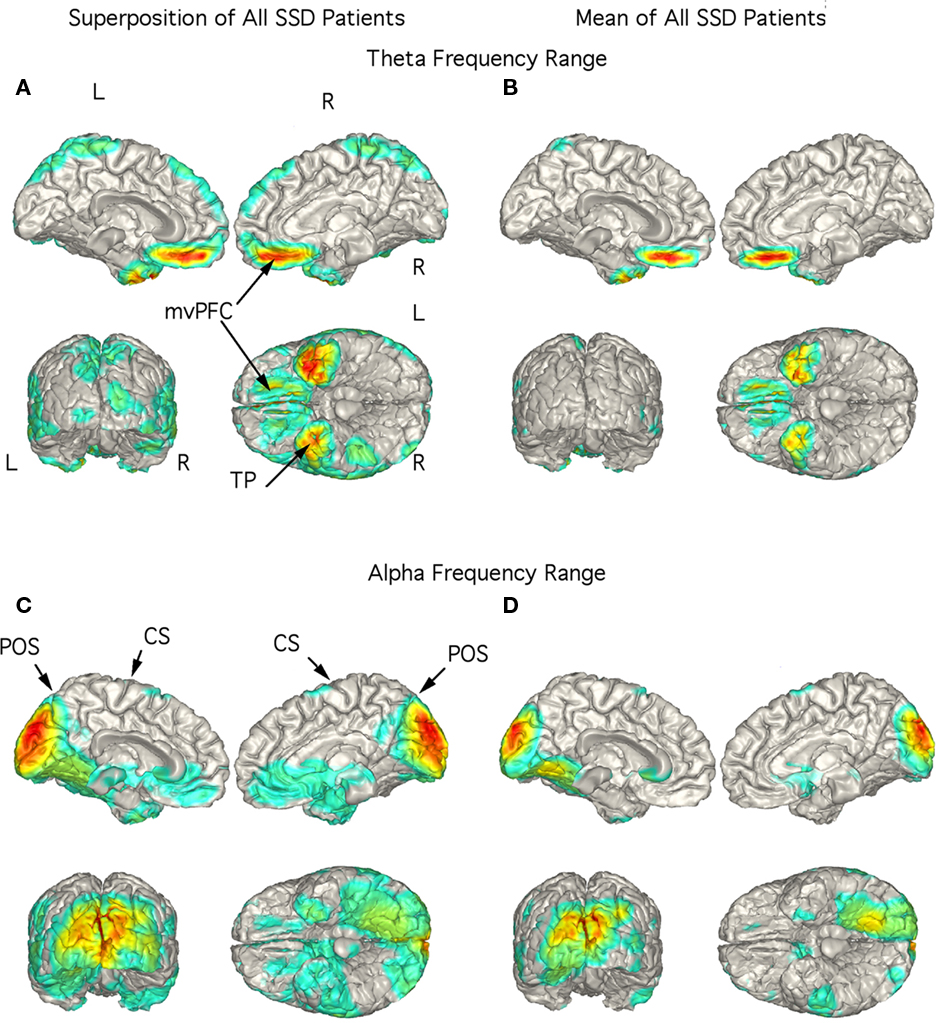
Figure 3. Localization of theta and alpha band current sources in SSD patients. (A) Superposition of theta range independent components (ICs) for SSD patients. Note that activity is to bilateral medial ventral pre-frontal cortex (mvPFC) and bilateral temporal pole (TP). (B) Mean of localizations shown in (A). (C) Superposition of alpha ICs. Note localization to occipital cortex. (D) Mean of localizations shown in (D). Note that this is similar to that seen in the controls in Figure 2D. Abbreviations: CS, central sulcus; L, left; mvPFC, medial ventral pre-frontal cortex; POS, parieto-occipital sulcus; R, right; TP, temporal pole.
Obsessive–compulsive disorder
In the 10 OCD patients the strongest current sources for the theta range ICs were localized to vmPFC and TP bilaterally (Figures 4A,B). The figure showing the superposition of localization of all 10 patients showed strong currents extending from the mesial orbital frontal cortex (OFC) to the rostral anterior cingulate cortex (Figure 4A). This rostral extension was not present in the mean localization of this activity (Figure 4B) since it was present in only two patients. Current sources for activity in the alpha frequency range were widespread including the midline and posterior regions as well as precentral gyrus and TP as seen in the superimposed images (Figure 4C). The mean alpha localization was restricted to areas of medial and posterior occipital cortex (Figure 4D) as in the control group.
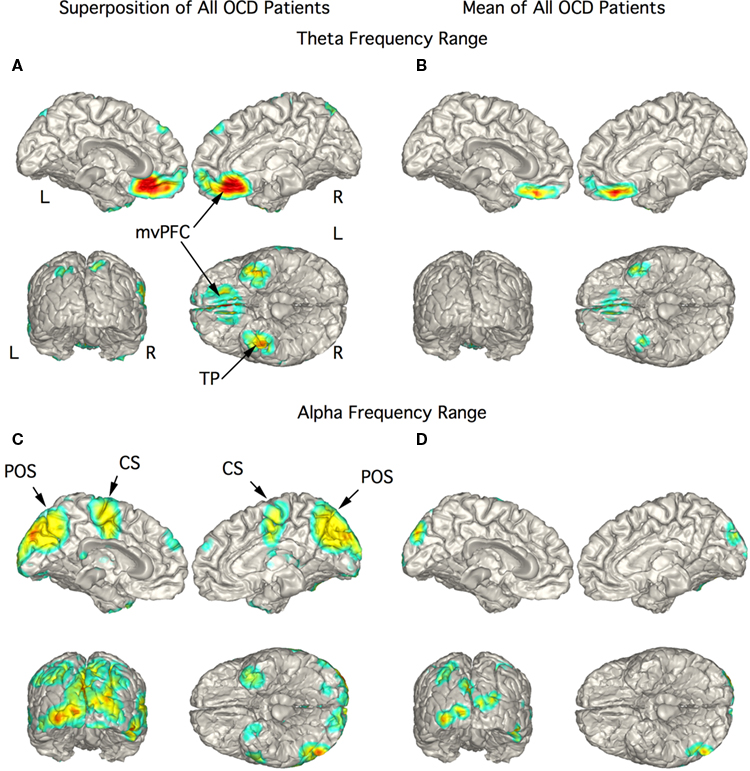
Figure 4. Localization of theta and alpha band current sources in OCD patients. (A) Superposition of theta range independent components (ICs) for OCD patients. Note that activity is to bilateral medial ventral pre-frontal cortex (mvPFC) and bilateral temporal pole (TP). (B) Mean of localizations in (A) show strong activity in orbital frontal cortex portion of mvPFC. (C) Superposition of alpha ICs that were widespread in this group of patients. (D) Mean of localizations shown in (C) reflecting the distributed nature of the localization in this chort. Abbreviations: CS, central sulcus; L, left; mvPFC, medial ventral pre-frontal cortex; POS, parieto-occipital sulcus; R, right; TP, temporal pole.
Depressive disorder
The strongest magnetic field generating current flow in the theta range in the DD patients were consistently localized to right TP in the superimposed (Figure 5A) and mean (Figure 5B) localization with stronger currents in the right than in the left TP extending laterally to inferior temporal cortex. Indeed, the figure showing the superposition of the five patients did not have any strong current sources in other brain regions (Figure 5A). Large current sources for activity in the alpha frequency range were most often found in the mesial occipital cortex although they could also localize to the left TP (Figure 5C). This pattern was also present in the mean localization (Figure 5D).
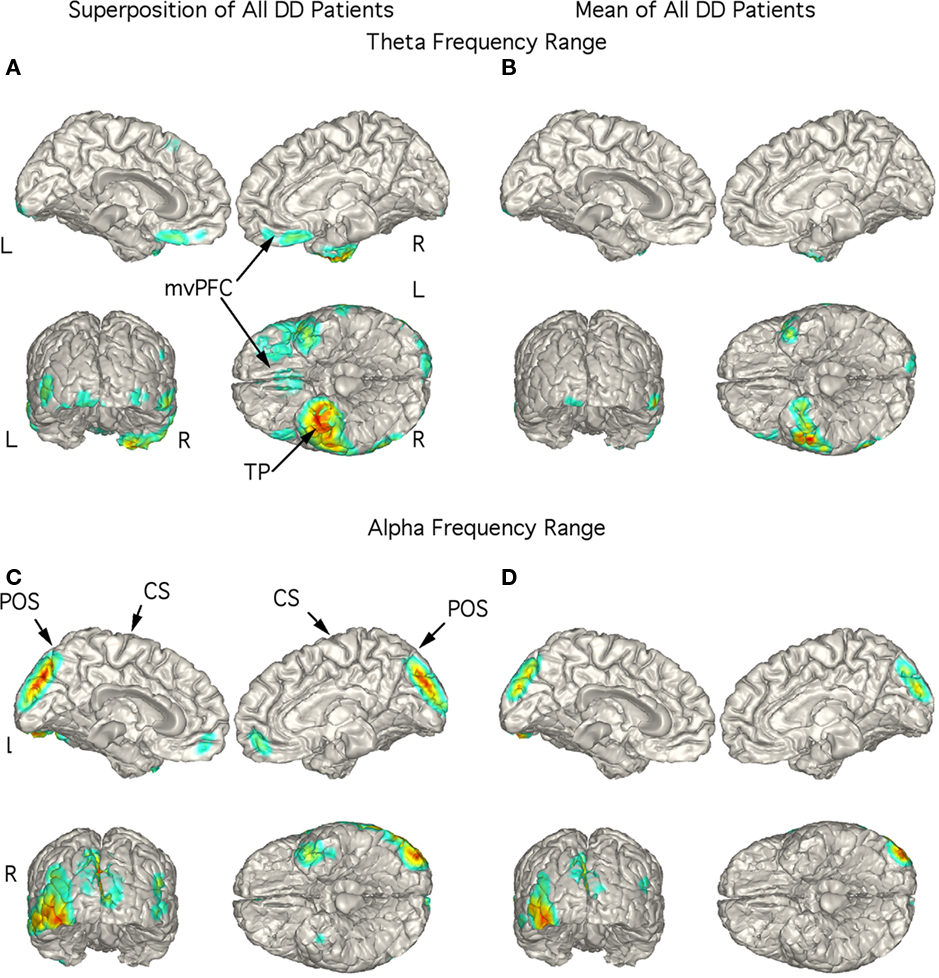
Figure 5. Localization of theta and alpha band current sources in depressed patients. (A) Superposition of theta range independent components (ICs) for depressed patients. Note that activity is strongest to right temporal pole. (B) Mean of localizations in (A) show strong activity in right temporal pole. This localization differs from SSD and OCD as well as controls. (C) Superposition of alpha ICs to occipital cortex. (D) Mean of localizations shown in (D). Abbreviations: CS, central sulcus; L, left; mvPFC, medial ventral pre-frontal cortex; POS, parieto-occipital sulcus; R, right; TP, temporal pole.
Discussion
The present study was initiated as an attempt to contribute to the understanding of neuropsychiatric dysfunction via objective characterization of brain electrophysiology. We used MEG to examine the presence of abnormal brain rhythms in patients diagnosed with one of three psychiatric disorders. Such abnormal rhythms were found to be located in brain regions previously associated with these psychiatric disorders. Although abnormal oscillations have been reported in psychiatric disorders, particularly in schizophrenia, the cellular mechanisms generating such oscillations are still largely unknown (see Marek et al., 2010). Below we offer a general hypothesis that addresses the cellular basis of low-frequency thalamocortical oscillations present in several psychiatric disorders. In particular, we propose that such abnormal function constitutes what we term a TCD (Llinas et al., 1999).
Theta Range Spontaneous Rhythmic Activity
Controls
Healthy individuals demonstrated a certain level of theta rhythmicity localized to the occipital cortex and TP (Figures 2A,B). Indeed, while the presence of theta range activity appears to serve as the pathological focus in this study, it should be stressed that transient theta activity, in the ventromedial frontal cortex (vmFC) and temporal lobe, is not intrinsically pathological. Aside from the well-known theta that emanates from the hippocampal complex (Kahana et al., 2001), mid-line frontal cortex theta activity has been associated with mental activity, task performance particularly for attention and working memory (Inanaga, 1998; Basar et al., 2001; Mitchell et al., 2008).
Schizophrenia spectrum disorder
The observed mode of oscillatory pathophysiology, theta range over-activity (Figures 1B,F), has been reported in MEG and EEG studies of schizophrenia. In the present study localization of theta range rhythms in the SSD group to vmPFC (to include the OFC) and temporal lobe bilaterally (Figures 3A,B) is in accordance with findings from neuroimaging (Goghari et al., 2010), and electrophysiological (EEG and MEG; Galderisi et al., 2009; Siekmeier and Stufflebeam, 2010; Uhlhaas and Singer, 2010) findings. Moreover, the results obtained are indeed very close to those reported by Holcomb et al. (2005) in which mesial frontal cortex and TP were imaged in a serial positron emission tomography study in volunteers with NMDA block-induced schizophrenia. NMDA block has been recently shown to generate thalamic oscillatory behavior at theta frequency in vitro due to the deinactivation of Cav3.1 calcium channel activity (Zhang et al., 2009). This is consistent with the thalamocortical hypothesis of psychiatric disorders as discussed below.
Obsessive–compulsive disorder
The OCD group exhibited spontaneous over-activity at all frequency ranges (Figures 1C,F) in agreement with a previous MEG study (Maihofner et al., 2007). As summarized in a recent review, abnormal brain activity is not unusual in OCD, and increased theta range activity has been reported in several studies (Clark et al., 2009). The unambiguous localization of theta range neuromagnetic activity to the OFC (Figures 4A,B) is also consistent with studies utilizing anatomical (Chamberlain et al., 2008; Szeszko et al., 2008; Rotge et al., 2010b; Wobrock et al., 2010) and functional imaging studies (Saxena and Rauch, 2000) and EEG (Tot et al., 2002) studies. The orbitofrontal–striatal model of OCD has been reviewed in light of recent findings and expanded to include abnormal functioning of ACC, basolateral amygdala, and hippocampus (Menzies et al., 2008).
Depressive disorder
The DD group also exhibited strong theta range over-activity (Figures 1D,F). The focus of EEG studies in depressed patients has been on asymmetries in alpha and theta rhythms (Fingelkurts et al., 2007; Stewart et al., 2010) making direct comparisons difficult. Theta range activity in these patients was most clearly localized to the TPs bilaterally (Figures 5A,B). In contrast to the SSD and OCD groups, there was little low-frequency activity in prefrontal areas. Projection of activity to the poles of the temporal lobe may reflect activation of the nearby amygdala to which the OFC is connected (Kringelbach and Rolls, 2004). In depressed subjects, this connection is thought to be reduced (Pizzagalli et al., 2003). Indeed, decreased inhibitory input from the rostral anterior cingulate and dorsal medial prefrontal cortex leads to increased activity of the amygdala (Drevets et al., 2008; Bennett, 2010). A limitation of our study is the small number of depressed patients. Nevertheless, these findings support a role for the presence of low-frequency oscillations in depression.
Alpha Rhythms
The alpha rhythms dominate recordings made from resting healthy adults with their EC (Nunez et al., 2001). This was seen in the control group (8–12 Hz, Figure 1A). Alpha peaks could be identified in the power spectra in most of the patients, although the dominant peak was shifted to lower frequencies in some individuals and reduced in others (Figures 1B–D). This rhythm is reduced or desynchronized when attention is increased, as during a task. Such desynchronization may be expected in SSD and OCD patients as they attend to internally generated stimuli or tasks. Alpha range activity was localized to the occipital cortex in all patient groups and in the controls as illustrated in Figures 2C,D–5C,D. This activity was most widespread in the OCD group. Similar localization of alpha, but not theta activity in patient and control groups point to the abnormal localization of the low-frequency oscillations and the value of these exploratory localizations.
Beta and Gamma Rhythms
An unambiguous and functionally significant finding concerns the presence of enhanced beta and gamma band activity in the OCD patients (Figure 1C). In six of the OCD patients ICA revealed components with activity in the beta and/or gamma range that were localized to the rostral temporal cortex (not shown). Gamma band activity has been associated with cognitive function in human studies and has been most thoroughly studied when the oscillations are evoked or induced (see Woo et al., 2010).
A recent EEG study in OCD patients has reported increased current density broadly in the beta range in frontal, parietal, and limbic regions (Velikova et al., 2010). Other EEG studies in OCD have reported decreased beta power (Karadag et al., 2003; Pogarell et al., 2006) particularly in frontal regions. An MEG study of spontaneous activity found an increase in fast oscillations (12.5–30 Hz) in OCD patients localized to left superior temporal gyrus (Maihofner et al., 2007). Such increases in high frequency rhythms are not commonly seen in psychiatric disorders. This is in contrast to gamma oscillations in SSD, where deficits have been widely reported and are the subject of several recent reviews (Gonzalez-Burgos et al., 2010; Uhlhaas and Singer, 2010; Woo et al., 2010).
The increased gamma in OCD patients may reflect increased internally generated cognitive/hallucinatory processes. Indeed, the obsessive–compulsive personality, when present at a level that is not incapacitating, represents a human phenotype characterized by enhanced creativity and drive as well as the characteristics from which this disorder derives its name. Interestingly, this gives further support to the functional significance of the linking of the emotional world with the intellectual realm. From this and other studies, it is clear that rhythmic brain activity is altered in several frequency ranges in psychiatric disorders, but a clear picture has not yet emerged that can be used for diagnostic purposes.
Medication Effects
An important consideration in this type of study is the effect of medications on neuronal oscillations To examine whether the observed effects were a function of pharmacologic intervention, one OCD, one DD, and four SSD patients who were medication-free for a period sufficiently long to assure complete drug washout at the time of recording were examined. No differences in the frequency spectrum or localization of these subjects from the remaining members of their category were observed. One patient was on Methylphenidate, which an EEG study found to have no effect on mid-line theta (Inanaga, 1998). Four patients were taking a benzodiazepine that has been shown to increase frontal mid-line theta, but placebo has been shown to have the same effect (see Mitchell et al., 2008). Ideally, a cohort of medication naïve subjects would best address the issue of ongoing and long-term drug effects. Nevertheless, the results suggest that the critical factor in this study is that symptomatology correlates with aberrant neuronal activity in pathology-specific areas. Thus, the commonalities observed here and in other pathologies using MEG (Llinas et al., 1999; Schulman et al., 2005) may contribute toward the ongoing development of neurological and neuropsychiatric nosology based on physiology rather than subjective phenotype or phenomenology.
Thalamocortical Dysrhythmia Model
Viewing these results with analogous findings in other neurological and psychiatric disorders, a common underlying mechanism rooted in the fundamental electrophysiological properties of the thalamocortical system may be conceptualized. A model has been proposed, TCD (Llinas et al., 1999), in which intrinsic neuronal properties form the substrate for disease-related physiology. In TCD states, persistent thalamic delta and/or theta range activity serves as the trigger for thalamocortical dysfunction in which a core region of cortex oscillates at low frequency, surrounded by an abnormal zone of beta or gamma band activity, an edge effect (Llinas et al., 2005).
Low-frequency thalamic oscillations are consistent with dysfunction of a well-characterized molecular target, the low-threshold (Cav3, T-type) Ca++ channel. At the resting potential thalamic cells fire tonically. However, when these neurons are hyperpolarized T-type calcium channels are activated and thalamic cells fire in low-frequency bursts. In TCD such hyperpolarization is maintained and low-frequency resonant recurrent interaction between thalamic and cortical neurons persists disrupting normal circuit function (Llinas et al., 1998). Such low-frequency cortical oscillations are seen in MEG recordings, the MEG does not measure thalamic activity directly as is done during surgical procedures. Indeed, theta range neuronal activity was recorded from the thalamus of four subjects in this study who received stereotactic intervention that resulted in a decrease in localized theta activity and elimination of positive symptoms (Jeanmonod et al., 2001, 2003).
Thalamic neuronal hyperpolarization may occur by excess inhibition (Llinas and Jahnsen, 1982), by disfacilitation resulting from thalamic deafferentation (Llinas et al., 1998), or by block of excitatory ligand-gated channels (Zhang et al., 2009). The last may be relevant in the case of psychiatric disorders. Indeed, blocking NMDA receptors (NMDAR) in reticular thalamus leads to low-frequency thalamic oscillations in brain slices (Zhang et al., 2009). This finding is consistent with major theories of schizophrenia; NMDAR hypofunction (Holcomb et al., 2005; Lindsley et al., 2006; Labrie and Roder, 2010), dopamine hyperfunction (Carlsson, 1977; Seeman, 2010), and inhibition of GABAergic neurons (Gonzalez-Burgos et al., 2010; Jones, 2010b). It is also consistent with glutamate based immune hypothesis of OCD (Rotge et al., 2010a) and the decreased NMDA receptor efficacy in depression (Bennett, 2010).
Low-frequency rhythmic MEG activity as seen here is, we propose, the result of a functional channelopathy. Thus, chronic deinactivation of Cav3.1 channels (Chemin et al., 2002) in thalamic neurons results in low-frequency spontaneous thalamic and thus cortical rhythmicity (Jeanmonod et al., 1996; Llinas et al., 2005; Jones, 2010a; Walton et al., 2010). Such a view of altered neuronal functioning, rather than progressive neurodegeneration is consistent with recent views of SSD and may be tested. For example, a recent review of fMRI in which patients with SSD performed tasks found negative symptoms to be associated with the vlPFC and ventral striatum while positive symptoms were associated with the mPFC, amygdala, hippocampus, and parahippocampus (Goghari et al., 2010). Our hypothesis would predict that areas associated with positive symptoms would have increases in high frequency rhythmicity while those associated with negative symptoms would be dominated by low-frequency oscillations.
Conclusion
This paper has reported an imaging study of basic pathophysiological processes related to psychiatric disease through the prism of neuronal electrophysiology. All 29 cases revealed a spectral cortical aberration (Figure 1). Mean power frequency bands are promising feature detectors in distinguishing between patients and controls providing up to 87% correct distinction in this study. In the accompanying EEG paper theta and low beta bands distinguished 82% of the patients and controls (D. Jeanmonod, personal communication). When applied to patient groups 75% of SSD and OCD patients were correctly distinguished from each other. Limitations of the study are the variety of medications and diagnoses and that the patients were treatment resistant; these results may not apply to treatment responsive patients. The framework of TCD emphasizes that disorders which historically have been assigned to the separate disciplines of neurology and psychiatry and/or given different DSM labels are electrophysiologically similar and may be amenable to modality-specific, yet mechanistically similar, interventions.
Conflict of Interest Statement
The authors declare that the research was conducted in the absence of any commercial or financial relationships that could be construed as a potential conflict of interest.
Acknowledgments
Supported by a predoctoral fellowship from the National Institute for Neurological Disorders and Stroke (F31 NS42973), NYU Medical Center General Clinical Research Center (NCRR RR00096), and the James D. Watson Foundation. We thank Diana Rojas-Soto for valuable assistance, John Garcia for writing data analysis routines and the NYU Courant Institute for use of their supercomputing facilities.
References
American Psychiatric Association (2000). Diagnostic and Statistical Manual of Mental Disorders, 4th Edn, Washington, DC: American Psychiatric Association. [Text Revision].
Basar, E., Schurmann, M., Basar-Eroglu, C., and Demiralp, T. (2001). Selectively distributed gamma band system of the brain. Int. J. Psychophysiol. 39, 129–135.
Behrendt, R. P. (2006). Dysregulation of thalamic sensory “transmission” in schizophrenia: neurochemical vulnerability to hallucinations. J. Psychopharmacol. (Oxford) 20, 356–372.
Bennett, M. R. (2010). Synapse regression in depression: the role of 5-HT receptors in modulating NMDA receptor function and synaptic plasticity. Aust. N. Z. J. Psychiatry 44, 301–308.
Buchsbaum, M. S. (2009). Evidence, evidence-based medicine, and evidence utility in psychiatry and electrophysiology. Clin. EEG Neurosci. 40, 143–145.
Chamberlain, S. R., Menzies, L., Hampshire, A., Suckling, J., Fineberg, N. A., del Campo, N., Aitken, M., Craig, K., Owen, A. M., Bullmore, E. T., Robbins, T. W., and Sahakian, B. J. (2008). Orbitofrontal dysfunction in patients with obsessive-compulsive disorder and their unaffected relatives. Science 321, 421–422.
Chemin, J., Monteil, A., Perez-Reyes, E., Bourinet, E., Nargeot, J., and Lory, P. (2002). Specific contribution of human T-type calcium channel isotypes (alpha(1G), alpha(1H) and alpha(1I)) to neuronal excitability. J. Physiol. 540, 3–14.
Clark, C. R., Galletly, C. A., Ash, D. J., Moores, K. A., Penrose, R. A., and McFarlane, A. C. (2009). Evidence-based medicine evaluation of electrophysiological studies of the anxiety disorders. Clin. EEG Neurosci. 40, 84–112.
Domenici, E., Wille, D. R., Tozzi, F., Prokopenko, I., Miller, S., McKeown, A., Brittain, C., Rujescu, D., Giegling, I., Turck, C. W., Holsboer, F., Bullmore, E. T., Middleton, L., Merlo-Pich, E., Alexander, R. C., and Muglia, P. (2010). Plasma protein biomarkers for depression and schizophrenia by multi analyte profiling of case-control collections. PLoS ONE 5, e9166. doi: 10.1371/journal.pone.0009166
Drevets, W. C., Price, J. L., and Furey, M. L. (2008). Brain structural and functional abnormalities in mood disorders: implications for neurocircuitry models of depression. Brain Struct. Funct. 213, 93–118.
Ferreira, L. K., and Busatto, G. F. (2010). Heterogeneity of coordinate-based meta-analyses of neuroimaging data: an example from studies in OCD. Br. J. Psychiatry 197, 76–77; author reply 77.
Fingelkurts, A. A., Rytsala, H., Suominen, K., Isometsa, E., and Kahkonen, S. (2007). Impaired functional connectivity at EEG alpha and theta frequency bands in major depression. Hum. Brain Mapp. 28, 247–261.
Fischl, B., Salat, D. H., Busa, E., Albert, M., Dieterich, M., Haselgrove, C., van der Kouwe, A., Killiany, R., Kennedy, D., Klaveness, S., Montillo, A., Makris, N., Rosen, B., and Dale, A. M. (2002). Whole brain segmentation: automated labeling of neuroanatomical structures in the human brain. Neuron 33, 341–355.
Ford, J. M., and Mathalon, D. H. (2008). Neural synchrony in schizophrenia. Schizophr. Bull. 34, 904–906.
Galderisi, S., Mucci, A., Volpe, U., and Boutros, N. (2009). Evidence-based medicine and electrophysiology in schizophrenia. Clin. EEG Neurosci. 40, 62–77.
Goghari, V. M., Sponheim, S. R., and MacDonald, A. W. III. (2010). The functional neuroanatomy of symptom dimensions in schizophrenia: a qualitative and quantitative review of a persistent question. Neurosci. Biobehav. Rev. 34, 468–486.
Gonzalez-Burgos, G., Hashimoto, T., and Lewis, D. A. (2010). Alterations of cortical GABA neurons and network oscillations in schizophrenia. Curr. Psychiatry Rep. 12, 335–344.
Gonzalez-Burgos, G., and Lewis, D. A. (2008). GABA neurons and the mechanisms of network oscillations: implications for understanding cortical dysfunction in schizophrenia. Schizophr. Bull. 34, 944–961.
Holcomb, H. H., Lahti, A. C., Medoff, D. R., Cullen, T., and Tamminga, C. A. (2005). Effects of noncompetitive NMDA receptor blockade on anterior cingulate cerebral blood flow in volunteers with schizophrenia. Neuropsychopharmacology 30, 2275–2282.
Inanaga, K. (1998). Frontal midline theta rhythm and mental activity. Psychiatry Clin. Neurosci. 52, 555–566.
Jahnsen, H., and Llinas, R. (1984). Electrophysiological properties of guinea-pig thalamic neurones: an in vitro study. J. Physiol. 349, 205–226.
Jeanmonod, D., Magnin, M., and Morel, A. (1996). Low-threshold calcium spike bursts in the human thalamus. Common physiopathology for sensory, motor and limbic positive symptoms. Brain 119, 363–375.
Jeanmonod, D., Magnin, M., Morel, A., Siegmund, M., Cancro, R., Lanz, M., Llinas, R., Ribary, U., Kronberg, E., Schulman, J., and Zonenshayn, M. (2001). Thalamocortical dysrhythmia II. Clinical and surgical aspects. Thalamus Relat. Syst. 1, 245–254.
Jeanmonod, D., Schulman, J., Ramirez, R., Cancro, R., Lanz, M., Morel, A., Magnin, M., Siegemund, M., Kronberg, E., Ribary, U., and Llinas, R. (2003). Neuropsychiatric thalamocortical dysrhythmia: surgical implications. Neurosurg. Clin. N. Am. 14, 251–265.
Jones, M. W. (2010b). Errant ensembles: dysfunctional neuronal network dynamics in schizophrenia. Biochem. Soc. Trans. 38, 516–521.
Jones, E. G. (1998). Viewpoint: the core and matrix of thalamic organization. Neuroscience 85, 331–345.
Kahana, M. J., Seelig, D., and Madsen, J. R. (2001). Theta returns. Curr. Opin. Neurobiol. 11, 739–744.
Karadag, F., Oguzhanoglu, N. K., Kurt, T., Oguzhanoglu, A., Atesci, F., and Ozdel, O. (2003). Quantitative EEG analysis in obsessive compulsive disorder. Int. J. Neurosci. 113, 833–847.
Kim, M. S., Kang, S. S., Youn, T., Kang, D. H., Kim, J. J., and Kwon, J. S. (2003). Neuropsychological correlates of P300 abnormalities in patients with schizophrenia and obsessive-compulsive disorder. Psychiatry Res. 123, 109–123.
Kringelbach, M. L., and Rolls, E. T. (2004). The functional neuroanatomy of the human orbitofrontal cortex: evidence from neuroimaging and neuropsychology. Prog. Neurobiol. 72, 341–372.
Labrie, V., and Roder, J. C. (2010). The involvement of the NMDA receptor D-serine/glycine site in the pathophysiology and treatment of schizophrenia. Neurosci. Biobehav. Rev. 34, 351–372.
Lindsley, C. W., Shipe, W. D., Wolkenberg, S. E., Theberge, C. R., Williams, D. L. Jr., Sur, C., and Kinney, G. G. (2006). Progress towards validating the NMDA receptor hypofunction hypothesis of schizophrenia. Curr. Top. Med. Chem. 6, 771–785.
Llinas, R., and Jahnsen, H. (1982). Electrophysiology of mammalian thalamic neurones in vitro. Nature 297, 406–408.
Llinas, R., Ribary, U., Contreras, D., and Pedroarena, C. (1998). The neuronal basis for consciousness. Philos. Trans. R. Soc. Lond. B Biol. Sci. 353, 1841–1849.
Llinas, R., Urbano, F., Leznik, E., Ramizeriz, R., and Van Marle, H. (2005). Rhythmic and dysrhythmic thalamocortical dynamics: GABA systems and the edge effect. Trends Neurosci. 28, 325–333.
Llinas, R. R. (1988). The intrinsic electrophysiological properties of mammalian neurons: insights into central nervous system function. Science 242, 1654–1664.
Llinas, R. R., Ribary, U., Jeanmonod, D., Kronberg, E., and Mitra, P. P. (1999). Thalamocortical dysrhythmia: a neurological and neuropsychiatric syndrome characterized by magnetoencephalography. Proc. Natl. Acad. Sci. U.S.A. 96, 15222–15227.
Maihofner, C., Sperling, W., Kaltenhauser, M., Bleich, S., de Zwaan, M., Wiltfang, J., Thurauf, N., Elstner, S., Reulbach, U., Lewczuk, P., Kornhuber, J., and Ropohl, A. (2007). Spontaneous magnetoencephalographic activity in patients with obsessive-compulsive disorder. Brain Res. 1129, 200–205.
Makeig, S., Jung, T. P., Bell, A. J., Ghahremani, D., and Sejnowski, T. J. (1997). Blind separation of auditory event-related brain responses into independent components. Proc. Natl. Acad. Sci. U.S.A. 94, 10979–10984.
Makela, J. P., Salmelin, R., Kotila, M., Salonen, O., Laaksonen, R., Hokkanen, L., and Hari, R. (1998). Modification of neuromagnetic cortical signals by thalamic infarctions. Electroencephalogr. Clin. Neurophysiol. 106, 433–443.
Marek, G. J., Behl, B., Bespalov, A. Y., Gross, G., Lee, Y., and Schoemaker, H. (2010). Glutamatergic (N-methyl-D-aspartate receptor) hypofrontality in schizophrenia: too little juice or a miswired brain? Mol. Pharmacol. 77, 317–326.
Menzies, L., Chamberlain, S. R., Laird, A. R., Thelen, S. M., Sahakian, B. J., and Bullmore, E. T. (2008). Integrating evidence from neuroimaging and neuropsychological studies of obsessive-compulsive disorder: the orbitofronto-striatal model revisited. Neurosci. Biobehav. Rev. 32, 525–549.
Mitchell, D. J., McNaughton, N., Flanagan, D., and Kirk, I. J. (2008). Frontal-midline theta from the perspective of hippocampal “theta”. Prog. Neurobiol. 86, 156–185.
Mitra, P. P., and Pesaran, B. (1999). Analysis of dynamic brain imaging data. Biophys. J. 76, 691–708.
Nunez, P. L., Wingeier, B. M., and Silberstein, R. B. (2001). Spatial-temporal structures of human alpha rhythms: theory, microcurrent sources, multiscale measurements, and global binding of local networks. Hum. Brain Mapp. 13, 125–164.
Pizzagalli, D. A., Oakes, T. R., and Davidson, R. J. (2003). Coupling of theta activity and glucose metabolism in the human rostral anterior cingulate cortex: an EEG/PET study of normal and depressed subjects. Psychophysiology 40, 939–949.
Pogarell, O., Juckel, G., Mavrogiorgou, P., Mulert, C., Folkerts, M., Hauke, W., Zaudig, M., Moller, H. J., and Hegerl, U. (2006). Symptom-specific EEG power correlations in patients with obsessive-compulsive disorder. Int. J. Psychophysiol. 62, 87–92.
Rotge, J. Y., Aouizerate, B., Tignol, J., Bioulac, B., Burbaud, P., and Guehl, D. (2010a). The glutamate-based genetic immune hypothesis in obsessive-compulsive disorder. An integrative approach from genes to symptoms. Neuroscience 165, 408–417.
Rotge, J. Y., Langbour, N., Jaafari, N., Guehl, D., Bioulac, B., Aouizerate, B., Allard, M., and Burbaud, P. (2010b). Anatomical alterations and symptom-related functional activity in obsessive-compulsive disorder are correlated in the lateral orbitofrontal cortex. Biol. Psychiatry 67, e37–e38.
Sadock, B., Sadock, V., and Riuiz, P. (2009). Kaplan and Sadock’s Comprehensive Textbook of Psychiatry. Philadephia: Lippincott Williams & Wilkins.
Saxena, S., and Rauch, S. L. (2000). Functional neuroimaging and the neuroanatomy of obsessive-compulsive disorder. Psychiatr. Clin. North Am. 23, 563–586.
Schulman, J. J., Zonenshayn, M., Ramirez, R. R., Ribary, U., and Llinas, R. (2005). Thalamocortical dysrhythmia syndrome: MEG imaging of neuropathic pain. Thalamus Relat. Syst. 3, 33–39.
Seeman, P. (2010). All roads to schizophrenia lead to dopamine supersensitivity and elevated dopamine D2 receptors. CNS Neurosci. Ther. 17, 118–132.
Segall, J. M., Turner, J. A., van Erp, T. G., White, T., Bockholt, H. J., Gollub, R. L., Ho, B. C., Magnotta, V., Jung, R. E., McCarley, R. W., Schulz, S. C., Lauriello, J., Clark, V. P., Voyvodic, J. T., Diaz, M. T., and Calhoun, V. D. (2009). Voxel-based morphometric multisite collaborative study on schizophrenia. Schizophr. Bull. 35, 82–95.
Siekmeier, P. J., and Stufflebeam, S. M. (2010). Patterns of spontaneous magnetoencephalographic activity in patients with schizophrenia. J. Clin. Neurophysiol. 27, 179–190.
Skudlarski, P., Jagannathan, K., Anderson, K., Stevens, M. C., Calhoun, V. D., Skudlarska, B. A., and Pearlson, G. (2010). Brain connectivity is not only lower but different in schizophrenia: a combined anatomical and functional approach. Biol. Psychiatry 68, 61–69.
Steriade, M., and Llinas, R. R. (1988). The functional states of the thalamus and the associated neuronal interplay. Physiol. Rev. 68, 649–742.
Stewart, J. L., Coan, J. A., Towers, D. N., and Allen, J. J. (2010). Frontal EEG asymmetry during emotional challenge differentiates individuals with and without lifetime major depressive disorder. J. Affect. Disord. 129, 167–174.
Szeszko, P. R., Christian, C., Macmaster, F., Lencz, T., Mirza, Y., Taormina, S. P., Easter, P., Rose, M., Michalopoulou, G. A., and Rosenberg, D. R. (2008). Gray matter structural alterations in psychotropic drug-naive pediatric obsessive-compulsive disorder: an optimized voxel-based morphometry study. Am. J. Psychiatry 165, 1299–1307. [see comment].
Tot, S., Ozge, A., Comelekoglu, U., Yazici, K., and Bal, N. (2002). Association of QEEG findings with clinical characteristics of OCD: evidence of left frontotemporal dysfunction. Can. J. Psychiatry 47, 538–545.
Tsai, G., and Coyle, J. T. (2002). Glutamatergic mechanisms in schizophrenia. Annu. Rev. Pharmacol. Toxicol. 42, 165–179.
Uhlhaas, P. J., and Singer, W. (2010). Abnormal neural oscillations and synchrony in schizophrenia. Nat. Rev. Neurosci. 11, 100–113.
Velikova, S., Locatelli, M., Insacco, C., Smeraldi, E., Comi, G., and Leocani, L. (2010). Dysfunctional brain circuitry in obsessive-compulsive disorder: source and coherence analysis of EEG rhythms. Neuroimage 49, 977–983.
Walton, K. D., Dubois, M., and Llinas, R. R. (2010). Abnormal thalamocortical activity in patients with complex regional pain syndrome (CRPS) type I. Pain 150, 41–51.
White, T., Magnotta, V. A., Bockholt, H. J., Williams, S., Wallace, S., Ehrlich, S., Mueller, B. A., Ho, B. C., Jung, R. E., Clark, V. P., Lauriello, J., Bustillo, J. R., Schulz, S. C., Gollub, R. L., Andreasen, N. C., Calhoun, V. D., and Lim, K. O. (2011). Global white matter abnormalities in schizophrenia: a multisite diffusion tensor imaging study. Schizophr. Bull. 37, 222–232.
Wobrock, T., Gruber, O., McIntosh, A. M., Kraft, S., Klinghardt, A., Scherk, H., Reith, W., Schneider-Axmann, T., Lawrie, S. M., Falkai, P., and Moorhead, T. W. (2010). Reduced prefrontal gyrification in obsessive-compulsive disorder. Eur. Arch. Psychiatry Clin. Neurosci. 260, 455–464.
Woo, T. U., Spencer, K., and McCarley, R. W. (2010). Gamma oscillation deficits and the onset and early progression of schizophrenia. Harv. Rev. Psychiatry 18, 173–189.
Keywords: schizophrenia, depression, obsessive–compulsive disorder, theta, gamma, magnetoencephalography
Citation: Schulman JJ, Cancro R, Lowe S, Lu F, Walton KD and Llinás RR (2011) Imaging of thalamocortical dysrhythmia in neuropsychiatry. Front. Hum. Neurosci. 5:69. doi: 10.3389/fnhum.2011.00069
Received: 24 January 2011; Accepted: 15 July 2011;
Published online: 29 July 2011.
Edited by:
Alvaro Pascual-Leone, Beth Israel Deaconess Medical Center/Harvard Medical School, USAReviewed by:
Catherine Stamoulis, Harvard Medical School/Children’s Hospital Boston, USADirk De Ridder, University Hospital Antwerp, Belgium
Copyright: © 2011 Schulman, Cancro, Lowe, Lu, Walton and Llinás. This is an open-access article subject to a non-exclusive license between the authors and Frontiers Media SA, which permits use, distribution and reproduction in other forums, provided the original authors and source are credited and other Frontiers conditions are complied with.
*Correspondence: Rodolfo R. Llinás, Department of Physiology and Neuroscience, New York University School of Medicine, 550 First Avenue, MSB-442, New York, NY 10016, USA. e-mail: llinar01@med.nyu.edu