Communication structure of cortical networks
- 1 Institute of Physics at São Carlos, University of São Paulo, São Carlos, São Paulo, Brazil
- 2 National Institute of Science and Technology of Complex Systems, Niterói, Rio de Janeiro, Brazil
- 3 Center for Neural Informatics, Structures and Plasticity, Krasnow Institute for Advanced Study, George Mason University, Fairfax, VA, USA
- 4 Molecular Neuroscience Department, Krasnow Institute for Advanced Study, George Mason University, Fairfax, VA, USA
Large-scale cortical networks exhibit characteristic topological properties that shape communication between brain regions and global cortical dynamics. Analysis of complex networks allows the description of connectedness, distance, clustering, and centrality that reveal different aspects of how the network’s nodes communicate. Here, we focus on a novel analysis of complex walks in a series of mammalian cortical networks that model potential dynamics of information flow between individual brain regions. We introduce two new measures called absorption and driftness. Absorption is the average length of random walks between any two nodes, and takes into account all paths that may diffuse activity throughout the network. Driftness is the ratio between absorption and the corresponding shortest path length. For a given node of the network, we also define four related measurements, namely in- and out-absorption as well as in- and out-driftness, as the averages of the corresponding measures from all nodes to that node, and from that node to all nodes, respectively. We find that the cat thalamo-cortical system incorporates features of two classic network topologies, Erdös–Rényi graphs with respect to in-absorption and in-driftness, and configuration models with respect to out-absorption and out-driftness. Moreover, taken together these four measures separate the network nodes based on broad functional roles (visual, auditory, somatomotor, and frontolimbic).
1 Introduction
Numerous studies have demonstrated that cortical networks, consisting of brain regions and inter-regional pathways, exhibit characteristic topological features, such as high clustering and short path lengths that support efficient wiring and complex neural dynamics (Hilgetag et al., 2000; Hilgetag and Kaiser, 2004; Sporns, 2004; Sporns and Kotter, 2004; Sporns and Zwi, 2004; Sporns et al., 2004, 2005). The link between the structural connection topology of the cortex and the pattern of information flow between its constituent regions is less extensively explored. We adopt a simple approximation of how localized signals spread across a neuronal network by focusing on the dynamics of random walks, and we demonstrate in this paper that such a simple model can provide insights into local and global patterns of information flow and communication in cortical networks. Importantly, our analysis reveals patterns of proximity and robustness that are not exclusively determined by the lengths of shortest paths.
Complex networks (Albert and Barabasi, 2002; Dorogovtsev and Mendes, 2002; Newman, 2003; Costa et al., 2007) are closely related to graph theory and Markov chain processes (Kemeny and Snell, 1976). Random walks can be understood as the sequence of nodes (in our case cortical regions) which are visited as an agent moves along the network. At each step, the agent chooses between the outgoing edges with equal probability. In one particular type of random walk, the moving agent is “absorbed” after arriving at specific nodes, naturally called absorbing nodes. A sufficiently large number of agents independently moving from an initial node to an absorbing node would explore all possible trajectories. This situation resembles the propagation of cortical activity between two regions, which generally flows through multiple paths. Thus, the average of the number of steps between two given nodes constitutes a functionally interesting parameter, which we call absorption. This measure can be computed from a structure that summarizes the thalamo-cortical connections: the adjacency matrix K, whose entry K(i, j) = 1 indicates a directed link from the element i to the element j. In strongly connected networks, i.e., in which there is at least one path between any pair of nodes, it is possible to obtain analogs of absorption times by enforcing each node as a single absorbing state (e.g., Kemeny and Snell, 1976). In related studies, Noh and Rieger (2004), considered the mean first passage time between two nodes as a subsidy for the analysis of scale free models, while Newman (2005) proposed the random walk betweenness measure as a means to quantify the influence a node has over the spread of information via random walks through the network.
Despite being relatively simple, the random walk model constitutes one of the most important references in dynamics. A straightforward physiological interpretation can be offered in the context of cortical networks: random walks approximate the signal originating at a single node and spreading via structural connections (Figure 1A). In addition to mimicking the movement of one or more agents along the network, the random walk model is intrinsically related to the general phenomenon of diffusion (Simonsen, 2005). More specifically, as time progresses during a random walk initiated at a given node, the frequency of visits to other nodes converges to the values which would be obtained by diffusion from that same node. In this sense, random walks provide a convenient means for implementing the diffusion equation in irregular structures such as complex networks (Figure 1). Because of its direct relationship with diffusion, investigations in terms of random walks bear direct implications for a wide range of important dynamics. Even most of the non-linear dynamics, such as the Gray–Scott equation for pattern formation (Pearson, 1993), frequently include an important diffusive term.
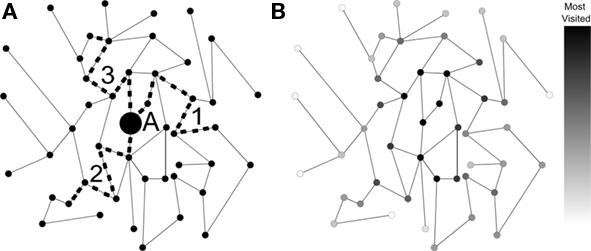
Figure 1. (A) A simple network with walks performed by three moving agents. (B) The frequency of visits by an infinite number of moving agents (shown by the gray-levels) corresponds to diffusion dynamics taking node A as source.
Generally, the signal transmission may be assumed to be more effective when the traveled distance is shorter. The shortest path length has been hypothesized to be an important indicator of functional proximity and has been found to be generally short for cortical inter-regional connections (Sporns et al., 2004). Absorption provides a measure of proximity between two neuronal units that is determined not only by the shortest path, but by all available paths between these nodes, therefore incorporating information about the existence of alternative trajectories between pairs of nodes and branching patterns within the network. A characterization of the relationship between two nodes can be derived by dividing absorption by the shortest path length between them. This ratio, which we call driftness, normalizes absorption with respect to the shortest path.
In this work, we introduce four related measurements, namely in- and out-absorption, and in- and out-driftness, all of which apply to any one individual node. In-absorption and out-absorption correspond to the average absorption from all other nodes to the given node, and from the given node to all other nodes, respectively. In- and out-driftness are analogously defined as the average driftness from all other nodes to the given node, and from the given node to all other nodes, respectively. Illustrative examples and biological interpretations are provided for each of the considered measures, which are then applied to characterize four configurations of real cortical networks. The routines implementing the measurements described in this paper were written using SCILAB and can be downloaded from http://sourceforge.net/projects/abs-drift. The Appendix provides additional information about the calculation of the measurements.
2 Absorption and Driftness: Assumptions and Interpretations
Before applying the absorption and driftness measurements to the characterization of the topology of cortical networks (Section 4), it is important first to explain why and how this analysis can provide valuable biological insights. While the architectural structure of cortical networks, i.e., its intrinsic connectivity, can provide a wealth of interesting information about the organization of those systems (Sporns et al., 2004), it is especially by considering dynamic processes running on those networks that additional insights about their operation can be obtained. Cortical networks underlie the intricate brain dynamics, but the complex relationships between structure, activity, and function are not well understood. Different types of models, including linear (Almendral and Diaz-Guilera, 2007), synchronization (Arenas et al., 2006), Ising interactions (Dorogovtsev et al., 2008), and neural networks (Bishop, 2006), can be considered to describe specific aspects of brain dynamics. This work considers average random walks as the means to induce diffusion of activity in the cortical network. In a given random walk, activity from a given area progresses with equal probability to any of the connected areas. The averaging over a large number of independent random walks is equivalent to the parallel propagation of activity through all possible paths connecting two areas. Also, from the point of view of control theory, Markov process can be seen as the dual of synchronizability, which is a key aspect for the understanding of the integration of neural activity (Mason and Verwoerd, 2007).
Although it is by no means claimed that such a relatively simple model captures all aspects of brain dynamics, it does reflect several important features, especially the influence of the adjacent nodes for the spread of activity along connections. The random walk approach was applied recently (Costa and Sporns, 2006) for the analysis of cortical regions. It was found that the activity induced by random walks (corresponding to the frequency of visits to each node) was correlated with the node degree (number of connections of each node). Interestingly, while a relatively low correlation was observed when considering only cortical areas, this correlation was substantially increased when the thalamus was incorporated into the analysis. A subsequent work investigated further the correlation between frequency of visits and local features of the network nodes (e.g., degree and clustering coefficient), also establishing the conditions necessary for full correlation between topology and induced dynamics. The present work also assumes cortical dynamics to be modeled by the above described random walk/diffusion process. However, instead of considering only the node activity and its correlations with degree, we also analyzed the complementary information of the proximity between nodes, as conveyed by the distinct concept of absorption.
Absorption is fundamentally different from other related network measures based on distances between pairs of vertices (e.g., characteristic path length; Costa et al., 2007), and the degree of centrality of individual vertices (e.g., betweenness centrality; Costa et al., 2007). In order to appreciate the unique information about network topology captured by absorption, consider the simple example of a directed five-node cyclic network (Figure 2A).
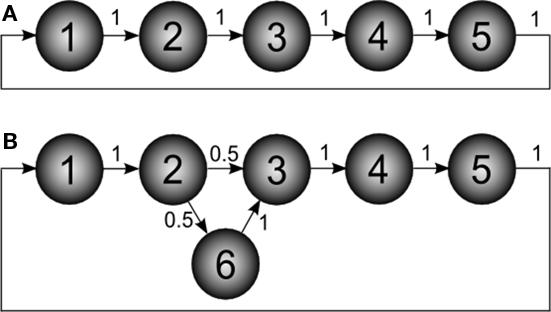
Figure 2. Example of directed networks. The numbers associated to the edges correspond to the transition probabilities. (A) Simple directed network defining a cycle with five nodes. (B) The network in (A) modified in order to include a new node (6), which defines a single network bifurcation.
By using the methodology explained in the Section “Appendix,” it is possible to calculate the respective absorption matrix A as:
The entries A(i, j) correspond to the average number of steps an agent takes to be absorbed at node j departing from node i. Since this graph is direct, walkers are allowed to move in only one direction. This is a direct consequence of the nature of this specific network, where no deviations and backward steps are allowed during any random walk. In other words, all possible random walks are intrinsically deterministic.
Now consider the slightly modified network in Figure 2B, where a new node (6) has been added in order to define a bifurcation at node 2. The absorption matrix for this modified network is:
The effect of the bifurcation on the absorption values is clear. While absorption from node 1 to 2 remains unchanged, the value from node 1 to 3 is now 2.5, not 2 as before. This is due to the possibility to deviate through node 6 between nodes 2 and 3.
In addition to pairwise absorption values (i.e., the average number of steps from a node i to a node j), it is also interesting to consider the average absorption when leaving from i and reaching any of the other N − 1 nodes, and starting at any of those nodes and arriving at i. These value, which are henceforth called out-absorption (AO) and in-absorption (AI), can be immediately calculated as:
and
The out- and in-absorption for the example of Figure 2B are:

Since in- and out-absorption are defined as averages, it is natural to compute the respective standard deviations:


Therefore, all nodes display similar out-absorption averages and standard deviations, indicating that, after leaving from any node, the moving agent will take a similar number of steps (about 4) before finding its targets. A different situation arises for the in-absorption: while nodes 1 to 5 are similarly accessible to moving agents after leaving from any node, node 6 will only be accessible, on average, after eight steps, a path more than two and a half times longer that that for all other nodes. While the variance is largest for node 6, it is actually smaller than all other nodes when divided by the corresponding average values. This example makes it clear that absorption provides a valuable indication about the accessibility of nodes to moving agents or spreading signals. For instance, if one were to hide a “treasure” (or store a dangerous memory) in the network, the in-absorption values suggest that it would be wisest to use node 6, which is the most protected node in this example.
Absorption can be interpreted as a kind of “distance,” because it counts the number of steps between nodes. However, it is important to note that this “distance” is not symmetric, in the sense that the absorption from node i to node j is not generally equal to the absorption from j to i. Therefore, absorption is capable of expressing the different possibilities while moving along each direction. This marks another important difference between absorption and the traditional “shortest path” (which in undirected networks is indeed symmetric). Figure 3 illustrates this observation with three additional examples of undirected networks involving the existence of two main alternative paths between a pair of nodes and the corresponding absorption values: while the shortest path between the nodes X–Y is equal to 4 in the three networks, absorption assumes higher values, since deviations and backward steps are possible, and depends on the starting node.
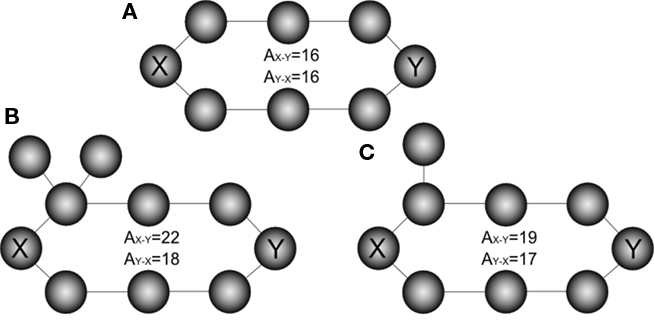
Figure 3. The effect of deviations in a ring network (A). Unlike shortest path, absorption is not symmetric, as illustrated is cases (B,C).
Though in principle distinct from the shortest path, and informative about the directional accessibility of each node, absorption is often correlated with the shortest path between network nodes. This correlation can be minimized by dividing the absorption between two nodes A(i, j) by the respective shortest path δ(i, j), yielding a new index W(i, j), which is here called driftness:
Observe that, except for the case A(i, j) = 0, W(i, j) is always larger or equal to 1, achieving unit value in the case of “equivalent paths,” when absorption equals the shortest path length, i.e., all the paths between the pair of nodes have identical length.
The driftness of the networks in Figures 2A,B are therefore respectively given as:
and
The out- and in-driftness can be now defined as:
and

While all out- and in-driftness are equal to 1 for the network in Figure 2A, for the network in Figure 2B we have:


Though normalized with respect to the shortest path length, we find that the out- and in-driftness tend to depend on the degree of the nodes, in the sense that the higher the out-degree (the number of outgoing edges) of a node, the greater its out-driftness tends to be. At the same time, higher values of node in-degree (number of incoming edges) tend to favor low in-driftness. However, because such a dependency may vary depending on the network structure, it becomes interesting to consider the correlation between the out- and in-driftness with those two types of node degrees in order to obtain additional insights about the network under analysis. Of special interest are the nodes departing substantially from such expected correlations.
After discussing how the absorption time analysis can provide valuable insight about the dynamic behavior of complex networks, we extend such conceptual interpretations to the specific case of cortical networks. Three particular aspects of brain dynamics can be related to absorption:
(i) Cortical area accessibility: in-absorption allows the identification of the (on average) most and least accessible cortical areas. This notion of accessibility is naturally related to measures of centrality. However, unlike betweenness centrality it does not rely only on shortest paths, but rather also takes into account redundancies in the paths. Less accessible brain areas, identified by higher in-absorption, may be harder to recruit and/or more seldom recruited, in cortical dynamics. More accessible areas may be more easily recruited in a greater variety of cortical processes.
(ii) Activation potential of an area: this concept is related to the out-absorption of a node. This measure may quantify the number of other areas that may be activated by a signal propagating from a given node. It is possible that a node with particularly high activation potential could play an especially important role for cortical control and processing.
(iii) Robustness of incoming and outgoing signals: A driftness value close to unity may indicate that the multiple paths connecting two areas are almost equivalent, providing a level of redundancy. In contrast, high driftness values indicate that, while multiple paths may be available, they tend to be much longer than the shortest path, possibly stressing the importance of individual paths.
Although absorption represents a more realistic measure to quantify the concepts of centrality/accessibility of nodes and the proximity between them, in the sense that it incorporates the relevant information provided by longer paths in the brain dynamics, previous studies on complex networks have established metrics that are not also based on shortest paths. Traditionally used in social and technological networks, the eigenvector centrality (Newman, 2003) estimates the score of a given node as being proportional to the values of its neighbors. In addition (Estrada and Hatano, 2008) generalized the concept of communicability between a pair of nodes by considering also non-shortest paths with decaying weights. Closer with the present study and not limited to the structural properties from the adjacency matrix, in (Pons and Latapy, 2006) a vertex similarity is proposed based on random walks with a fixed length in the context of community detection. Also, the centrality index based on random walks, proposed by Newman (2005) as an extension of the betweenness centrality, is calculated by counting the number of times, on average, a random walker visit that node while performing an absorbing walk between pairs of vertices.
3 Connectivity Data Sets
In this paper we study the cat cortico-thalamic network, whose connectivity was obtained by collating data from various tracing studies (Scannell et al., 1999). The matrix of connections used here is a binarized version extracted from Scannell et al. (1999) containing 42 thalamic nodes and 53 cortical areas clustered into four functional groups (see Appendix for abbreviations): visual (17, 18, 19, PLLS, PMLS, ALLS, AMLS, VLS, DLS, 21a, 21b, 20a, 20b, 7, AES, PS), auditory (AI, AII, AAF, P, VPc, EPp, Tem), somatomotor (31, 3b, 1, 2, SII, SIV, 4g, 4, 6l, 6m, 5Am, 5Al, 5Bm, 5Bl, SSAi, SSAo), and frontolimbic (PFCMil, PFCMd, PFCL, Ia, Ig, CGa, CGp, RS, 35, 36, pSb, Sb, Enr, Hipp). These 95 regions are linked with approximately 1500 connections divided in cortico-cortico directed edges and cortico-thalamic undirected edges (reciprocal connections). In this model data set, no connections exist between thalamic nodes.
4 Results and Discussion
We performed four types of analyses using absorption-related measures in the cat thalamo-cortical network. First, we extracted the respective absorption and driftness measurements as a function of the in- and out-degrees in the cortex alone. Second, we included the thalamic connections in the cortex network and investigated how those affected absorptions and driftness. Third, we compared the measures obtained for the cortical network, with and without thalamus, with those obtained from the two types of random controls described above, in order to assess how much the real network departed from such random references. Fourth, we analyzed the measurements at the individual cortical area level, so as to be able to identify specific trends or organization principles of cortical architecture. These investigations are respectively covered in the following sub-sections.
4.1 Absorption and Driftness in Cat Cortex without Thalamus
Figure 4 shows the in- (Figure 4A) and out-absorptions (Figure 4B) and in- (Figure 4C) and out-driftness (Figure 4D) obtained considering all 53 cat cortical regions without thalamic connections. The in-absorptions and in-driftness are plotted against the in-degree, while the out-absorption and out-driftness are plotted against the out-degree. Interestingly, in-absorptions and in-driftness correlated negatively with the in-degree (Figures 4A,C), indicating a significant tendency of those two measures to decrease with the in-degree (p < 10−6 for both). This phenomenon can be understood as a consequence of the fact that the larger the in-degree of a node, the higher the chances that that node receives afferents directly from a substantial number of other areas, therefore reducing the in-absorption and driftness regarding those nodes and their immediate neighbors. This effect is particularly pronounced for relatively small networks such as those derived from cortical connectivity. As shown in Figure 4B, the out-absorption is not significantly correlated with the out-degree (p > 0.05 after Bonferroni correction for four independent tests). The out-driftness (Figure 4D) tends to increase with the out-degree (p < 10−6) even more significantly than the correlations observed for the in-absorptions and in-driftness. This overall tendency can be explained by the fact that a node with high out-degree will potentially correspond to the branching point of several outbound paths.
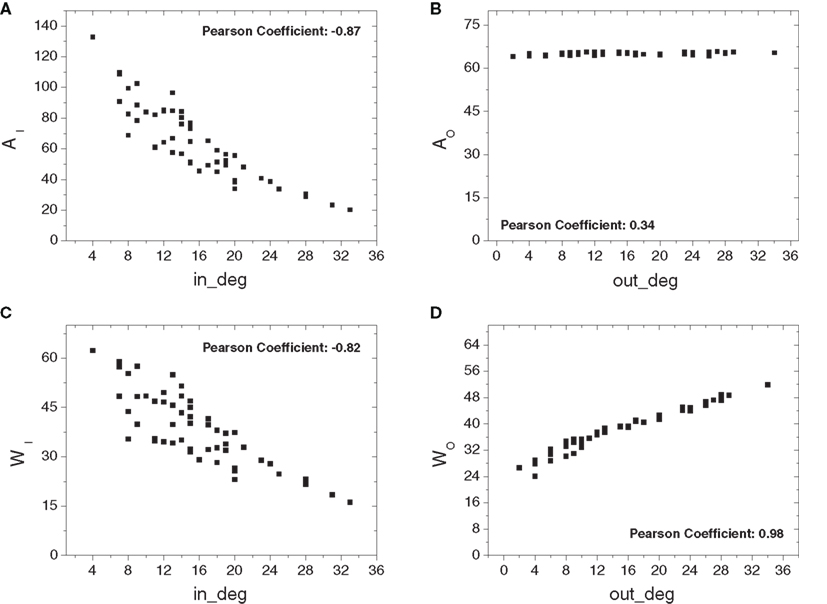
Figure 4. The four absorption-related measurements plotted against the respective in- and out- degrees considering the cortical network without thalamic nodes: in- (A) and out-absorptions (B) and in- (C) and out-driftness (D). Significant correlation was obtained for the cases (A,C and D).
4.2 Incorporation of Thalamic Connections
Figure 5 depicts the absorption-related measurements obtained for the cat cortical data including the original thalamic connections, totaling 95. Overall, the negative correlations between the in-absorption/in-driftness and the in-degree, as well as the positive correlation between the out-driftness and out-degree, were all preserved (p < 10−6 in all cases). However, compared to the observations on the cortical network alone (Figure 4), the addition of the thalamus creates a substantial non-linearity, and clearly expands the range of all measures (note different scales on Y axes). Moreover, a positive (not linear) relation is now observed between out-absorption and out-degree (p < 10−6). This effect is a consequence of the fact that a higher out-degree implies more alternative pathways to the destinations, increasing both the out-absorption and out-driftness.
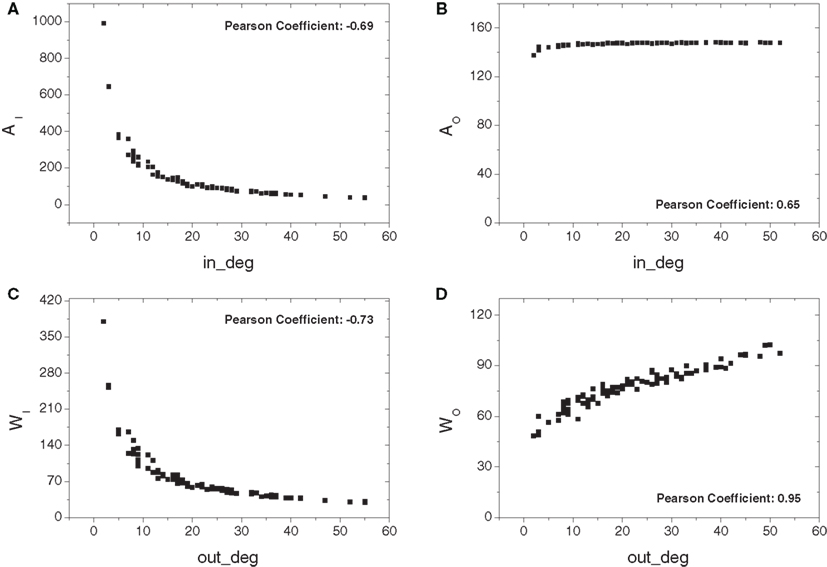
Figure 5. The absorption-related measurements obtained for the cat cortical matrix incorporating the thalamic connections against the respective degrees: in- (A) and out-absorptions (B) and in- (C) and out-driftness (D). Different from the case where cortical nodes are considered alone, a non-linear dependency is now obtained.
4.3 Comparison with Random Networks
In this section, the cat cortical networks without and with thalamus are compared with synthetic random networks. Two types of “equivalent random networks” were created and used as “control” throughout the analysis: Erdös–Rényi (E–R) graphs and configuration model (Newman, 2003). Given a reference network, it is possible to obtain a random network counterpart with the same number of nodes, called a directed E–R graph, by connecting stochastically selected node pairs until the average in- and out-degrees of the reference network are matched. Because E–R graphs are completely unspecific as far as the connectivity is concerned (the connections are independent of one another), such a graph provides an interesting control against which to compare real networks. The possibility to obtain equivalent E–R models including non-connected components is minimized by the relatively high average node degree of the cortical networks. To any extent, our current approach only considered connected equivalent models. Similarly, the configuration model is based on randomization preserving the respective degrees. This control graph is constructed starting from a given network by extensive random pairwise rewiring without altering the in- and out-degrees of each node, and thus represents a more constrained reference compared to E–R graphs.
4.3.1 Comparison with Erdös–Rényi random networks
Figure 6 compares the relations of in-absorption and in-driftness to in-degree extracted from the cat cortical data without (Figures 6A,B) and with (Figures 6C,D) thalamus with the same measures calculated for corresponding E–R networks, which have the same number of nodes and average in- and out-degrees. In all cases, the real cortical networks present a substantially wider excursion along both axes than the respective E–R counterparts. Aside from this clear difference, E–R networks reproduce the negative dependency of in-absorption and in-driftness on in-degree observed in the car cortical networks. More generally, within the range of in-degrees they cover, E–R networks display in-absorption and in-driftness values consistent with those measured from the real networks both with and without thalamus.
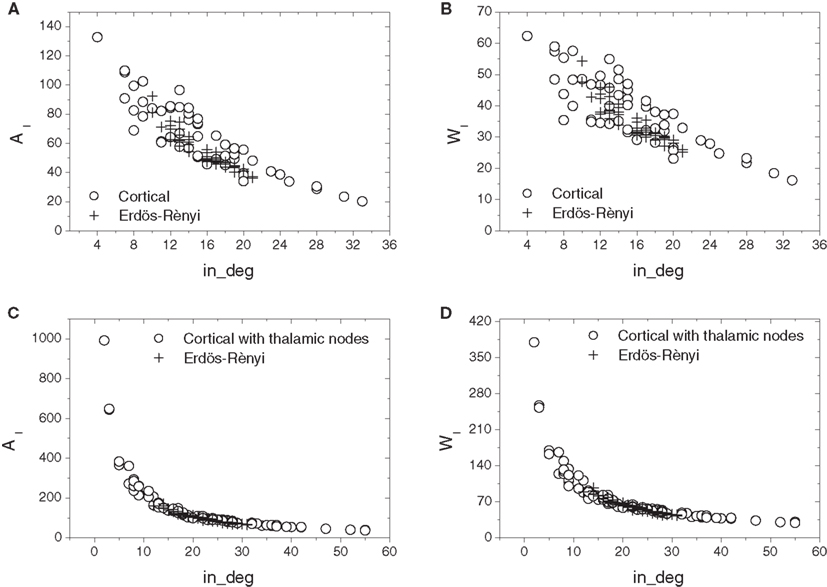
Figure 6. Scatterplot comparison of in-absorption (A,C) and in-driftness (B,D) against in-degrees between cortical networks with thalamic nodes disconnected (A,B) and connected (C,D). In all cases, the cortical networks differ from the E–R counterparts by presenting a wider dispersion along both axes.
Cortical networks with and without thalamus were compared next to their respective E–R counterparts in terms of the relation of out-absorption and out-driftness to out-degree (Figure 7). Similarly to the in-degree, the cortical networks demonstrate a much broader range of out-degrees than their corresponding E–R graphs. However, a substantial separation is now observed between the absorption and driftness measures extracted from cortical and E–R networks, even within the range of out-degrees covered by the E–R controls. This effect is especially apparent in the case of out-absorption (i.e., Figures 7A,C). Incorporation of the thalamic connections enlarges the overall distance between the cortical and E–R counterparts.
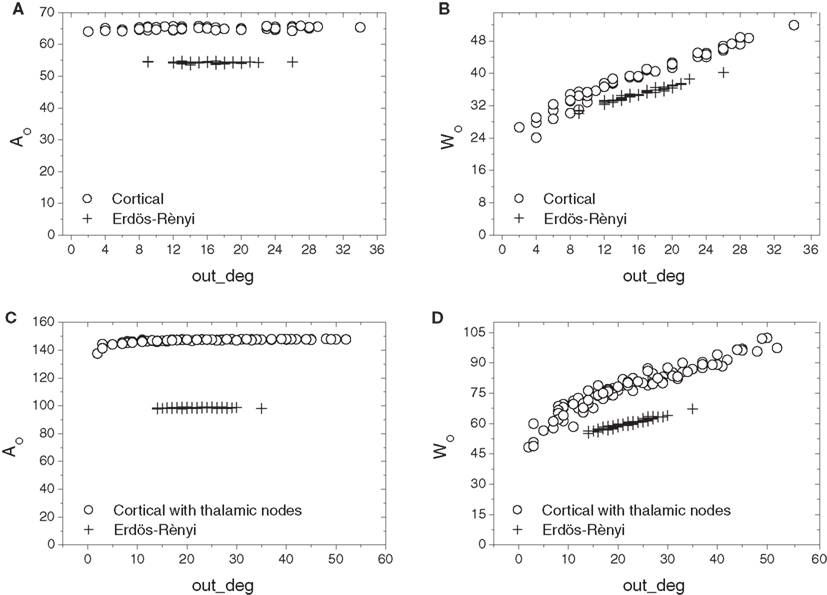
Figure 7. Scatterplot comparison of out-absorption (A,C) and out-driftness (B,D) against out-degrees between cortical networks with thalamic nodes disconnected (A,B) and connected (C,D). A much wider separation between cortical and E–R networks is now observed, especially for the out-absorption.
These results indicate that the cat cortical network without or with thalamus is markedly distinct from the E–R model with respect to out-absorption and out-driftness, but less distinct with respect to in-absorptions and in-driftness.
4.3.2 Comparison with the random configuration model
In addition to the comparison with the E–R random control reported in the previous section, it is also interesting to compare the analyzed networks with random counterparts which preserve some of the overall topological properties. Given the substantial differences between cortical networks and corresponding E–R graphs in terms of the range of in- and out-degrees, it seems especially important to employ a network model preserving the distribution of node degrees. In this section we consider the configuration model (Newman, 2003), which preserves the degrees of all nodes. In particular, we created 200 random rewiring configuration counterparts for each of the two cortical networks, with and without thalamus.
The comparison between the cortical and random networks was performed in terms of each of the four measures (in- and out-absorption/driftness) for every individual node using the one-dimensional Mahalanobis distance, also called z-score. To do so, each node in the cortical network was compared to the corresponding nodes in the 200 random counterparts by computing the absolute difference between the specific measurement (e.g., in-absorption) of that node and the average over the 200 nodes, and dividing the resulting value by the standard deviation of that measure obtained from the same 200 nodes (Figure 8). Under Gaussian approximation, the Mahalanobis distance is statistically significant (p < 0.05) above 2, and non-significant below.
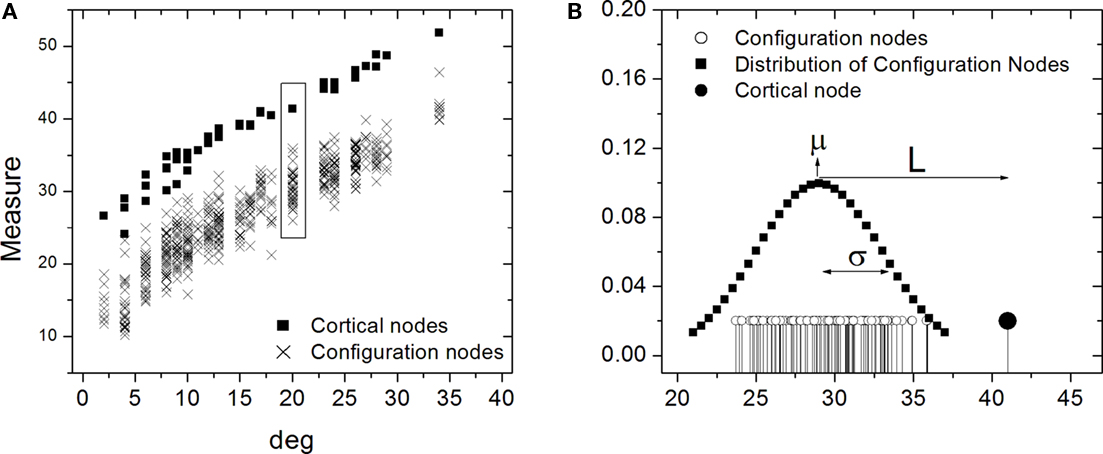
Figure 8. Illustration of the one-dimensional Mahalanobis distance, or z-score. Hypothetical measurements against the degree for the cortical nodes and respective configurations nodes are shown in (A). In (B) the distribution of the cortical node measurement (filled stem) is shown along with the configuration measurements (empty stems) with their fitted normal distribution. The Mahalanobis distance is obtained by subtracting the measurement value from the average μ of the normal distribution and dividing this difference L by the corresponding standard deviation σ.
Figure 9 presents the histogram distributions of the in- and out-absorption Mahalanobis distances between the cat cortical networks without (Figures 9A,B) or with (Figures 9C,D) thalamus and the corresponding random configuration models. Approximately half of the nodes deviate significantly from the control in terms of in-absorption whether the thalamus is disconnected or connected (58 and 45%, respectively). In contrast, a negligible proportion of nodes (8% without thalamus and 0% with) are significantly different from the random model in terms of out-absorption.
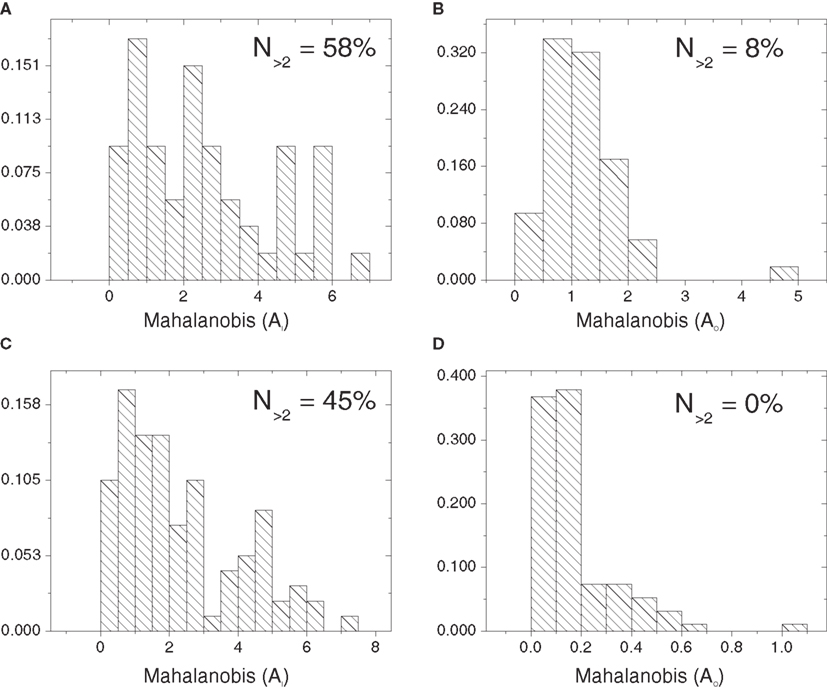
Figure 9. Histograms of the one-dimensional Mahalanobis distances obtained for the in- and out-absorptions with respect to the cat cortical network without (A,B) and with (C,D) thalamus and the percentages of nodes with Mahalanobis distance above 2.
In the cortical network without thalamus, the in-driftness was also much farther from the random control than the out-driftness (15 vs. 57% of significantly different nodes). However, both in- and out-driftness were poorly described by the random model when the thalamus was included (Table 1).
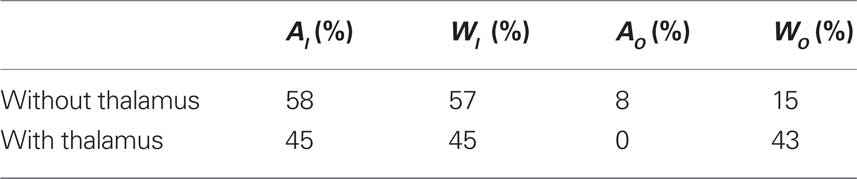
Table 1. The percentage of nodes with statistically significant Mahalanobis distance between cortical networks and random configuration models.
Overall, the results obtained from the comparisons of the cat cortical networks with the E–R and random configuration models revealed an interesting “double dissociation”: the cortical networks are most distinct from the E–R case in terms of out-absorption and out-driftness, but are most markedly different from the random configuration model in terms of in-absorption and in-driftness. Conversely, with respect to the four measurements (i.e., in-absorption, in-driftness, out-absorption, and out-driftness) investigated in the present work, the cat cortical network has in-absorptions and in-driftness similar to the E–R counterparts and out-absorptions and out-driftness similar to the random configuration counterparts. In other words, as far as absorption and driftness are concerned, the cat cortical network can be understood as incorporating hybrid random features of the two models.
4.4 Individual Cortical Areas
Further insights about the organization of the cat cortical network can be obtained by analyzing the absorption and driftness of individual cortical regions. In particular, in-absorption, out-absorption, in-driftness, and out-driftness can be measured for each individual node and related to the functional groups to which each node belongs (i.e., visual, auditory, somatomotor, and frontolimbic).
Figure 10 presents the scatterplot obtained by principal component analysis (PCA; Duda et al., 2000) considering the four measurements defined for the nodes (in-absorption, out-absorption, in-driftness, and out-driftness) of the cat cortical network without (Figure 10A) and with (Figure 10B) thalamus. In the first case, as shown in Figure 10A, significant clustering has been obtained with respect to the four functional groups, except for the frontolimbic case, which tended to split into two groups (left- and right-hand sides). The case of the cat cortical network with thalamus did not lead marked clustering (Figure 10B).
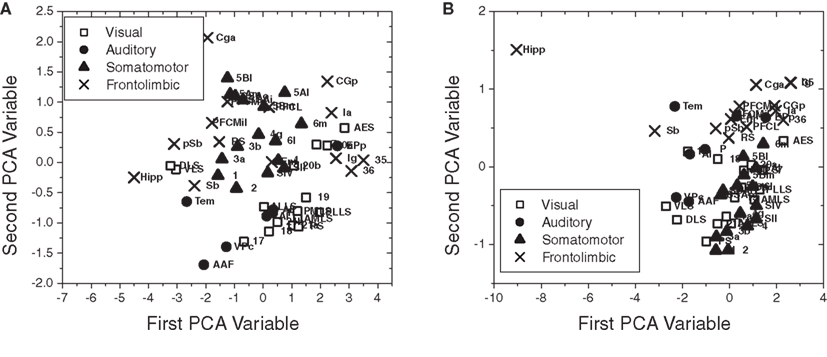
Figure 10. The scatterplot obtained after PCA projection of the four measurements considered for the cat cortical network without (A) and with (B) thalamus. Well-defined clusters were obtained for the visual, auditory, and somatomotor functional groups for the cortical network without thalamus (A).
In Figure 11, we also considered PCA projection of the one-dimensional Mahalanobis distances (Section 4.3.2) with respect to all four measurements (i.e., in-absorption, out-absorption, in-driftness, and out-driftness) for the cat cortical network without (Figure 11A) and with (Figure 11B) thalamus. Although in the case without thalamus less separated clusters were obtained (Figure 11A), the incorporation of thalamus provide a clustering structure (Figure 11B), which is even more well-defined than that obtained for the four topological measurements considered in Figure 10. Now, when the thalamic areas are included, all the four functional groups are mostly separated.
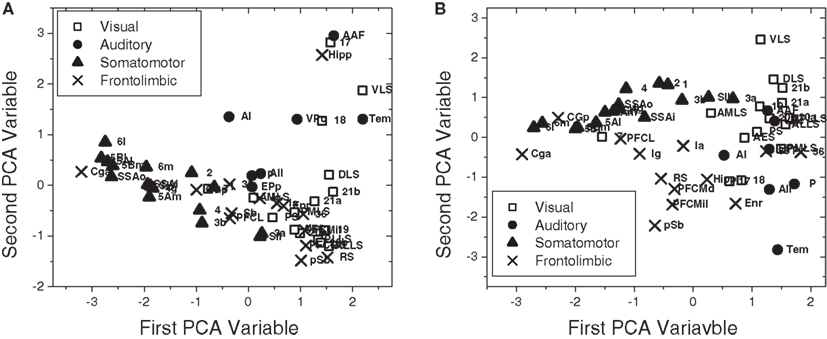
Figure 11. The scatterplot obtained after PCA projection considering the one-dimensional Mahalanobis distances with respect to all four measurements for the cat cortical network without (A) and with (B) thalamus.
The clustering observed by a visual inspection of the PCA projections in the Figures 10 and 11 can be verified quantitatively by calculating the so-called Rayleigh coefficient κ (Li et al., 2006), which characterizes the overall separation between the classes (i.e., the functional groups). The explicit value of κ can be obtained by
where ΣW is the intra-class-scatter matrix and ΣB is the inter-class-scatter matrix, which provide the dispersion inside each class and between the classes, respectively. Thus, the value of k increases with the level of clustering. For a set of N samples, each one characterized by a vector of measurements  , and divided into n classes, the matrices are given by
and
where Ni is number of samples in each class  is the mean vector for the samples in the class ci, and
  is the total mean vector.
Denoting by κ53 and κ95 the values of the Rayleigh coefficients for the cat cortical network without and with thalamus, respectively, we can verify the effect of the inclusion of the thalamic nodes to discriminate the cortical areas. For the case considering the four measurements defined for the nodes (in-absorption, out-absorption, in-driftness, and out-driftness) we have κ53 = 9.915 × 10⁻² and κ95 = 1.586 × 10⁻³ (ratio κ95/κ53 = 0.016) with p-values equal to 0.006 and 0.540, respectively. In the second case, considering the one-dimensional Mahalanobis distances with respect to all four measurements, we found κ53 = 0.2985 and κ95 = 3.4581 (ratio κ95/κ53 = 11.584) with p < 0.001 to the both cases. p-Values were estimated from 20000 bootstrap replications (Auffermann et al., 2002). Results are in agreement with the previous visual inspection.
5 Conclusion
Understanding brain information processing in terms of the underlying network structure is one of the ultimate goals in neuroscience (Sporns et al., 2005; Kasthuri and Lichtman, 2007). Many projects are rising to the challenge, and soon complete connectivity data could be expected at various scales, from non-invasive brain imaging (Biswal et al., 2010), to rodent tractography (Bohland et al., 2009), to the complete synaptic circuit blueprint (Kasthuri and Lichtman, 2010). This revolutionary prospect raises the acute need of methods to characterize these graphs quantitatively while fostering intuition about their emergent function (Bullmore and Sporns, 2009).
The two new measures introduced in this work, absorption and driftness, have simple analytical expressions and are easy to compute, yet provide information not produced by other established metrics (Hilgetag et al., 2000; Hilgetag and Kaiser, 2004; Sporns, 2004; Sporns and Kotter, 2004; Sporns and Zwi, 2004; Sporns et al., 2004, 2005). At the same time, by relating network dynamics to random walk diffusion, these measures offer a unique opportunity to capture a basic aspect of network topology related to information transmission, as illustrated in the examples.
Focusing on the obtained results, we have analyzed the intrinsic dependency between the defined measures applied to the nodes with their degrees. Interestingly, this relationship is enhanced in a power-law form when the thalamic nodes were included. It was also verified how random features are incorporated in the cortical networks, establishing the closeness with random models: cortical networks (both with and without thalamus) are most markedly distinct from the E–R with respect to out-absorption and out-driftness while they are most different from the configuration model in terms of in-absorption and in-driftness. Extending our analysis, we also have shown, based on the absorption and driftness measurements, suggestive evidence that the nodes are clustered in this phase space coinciding with the functional division of the cortical areas.
The application of absorption and driftness to an available connectivity data set of the cat cortex demonstrates that they can be useful additions in the modern neuroinformatics toolbox. Most importantly, being applicable across scales, they can help shed light on detailed circuit diagrams based on neuron class connections (Ascoli, 2010) and, in the not-so-distant future, complete synaptic connectomes. Further related investigations could consider the role of some other topological features, besides the degree, exploring the dependency between structure and dynamics. Additionally, the absorption and driftness matrices can be used to develop new macroscopic measurements describing entire networks. As a consequence, one can verify the microscopic influence of specific vertices and edges. Other applications can extend the analysis to the available connectivity datasets of other species using different kind of walks.
Conflict of Interest Statement
The authors declare that the research was conducted in the absence of any commercial or financial relationships that could be construed as a potential conflict of interest.
Acknowledgments
Luciano da Fontoura Costa is grateful to FAPESP (05/00587-5) and CNPq (301303/06-1 and 573583/2008-0) for sponsorship. Giorgio A. Ascoli was supported in part by ONR MURI grant NOOO14-10-1-0198, NIH R01 grant NS39600, and NIH R21 grant NS58816. João Luiz B. Batista thanks CNPq (131309/2009-9) for sponsorship.
References
Albert, R., and Barabasi, A. L. (2002). Statistical mechanics of complex networks. Rev. Mod. Phys. 74, 47–97.
Almendral, J. A., and Diaz-Guilera, A. (2007). Dynamical and spectral properties of complex networks. New J. Phys. 9.
Arenas, A., Diaz-Guilera, A., and Perez-Vicente, C. J. (2006). Synchronization processes in complex networks. Physica D 224, 27–34.
Auffermann, W. F., Ngan, S.-C., and Hu, X. (2002). Cluster significance testing using bootstrap. Neuroimage 17, 581–591.
Biswal, B. B., Mennes, M., Zuo, X. N., Gohel, S., Kelly, C., Smith, S. M., Beckmann, C. F., Adelstein, J. S., Buckner, R. L., Colcombe, S., Dogonowski, A. M., Ernst, M., Fair, D., Hampson, M., Hoptman, M. J., Hyde, J. S., Kiviniemi, V. J., Kotter, R., Li, S. J., Lin, C. P., Lowe, M. J., Mackay, C., Madden, D. J., Madsen, K. H., Margulies, D. S., Mayberg, H. S., McMahon, K., Monk, C. S., Mostofsky, S. H., Nagel, B. J., Pekar, J. J., Peltier, S. J., Petersen, S. E., Riedl, V., Rombouts, S., Rypma, B., Schlaggar, B. L., Schmidt, S., Seidler, R. D., Siegle, G. J., Sorg, C., Teng, G. J., Veijola, J., Villringer, A., Walter, M., Wang, L. H., Weng, X. C., Whitfield-Gabrieli, S., Williamson, P., Windischberger, C., Zang, Y. F., Zhang, H. Y., Castellanos, F. X., and Milham, M. P. (2010). Toward discovery science of human brain function. Proc. Natl. Acad. Sci. U.S.A. 107, 4734–4739.
Bohland, J. W., Wu, C. Z., Barbas, H., Bokil, H., Bota, M., Breiter, H. C., Cline, H. T., Doyle, J. C., Freed, P. J., Greenspan, R. J., Haber, S. N., Hawrylycz, M., Herrera, D. G., Hilgetag, C. C., Huang, Z. J., Jones, A., Jones, E. G., Karten, H. J., Kleinfeld, D., Kotter, R., Lester, H. A., Lin, J. M., Mensh, B. D., Mikula, S., Panksepp, J., Price, J. L., Safdieh, J., Saper, C. B., Schiff, N. D., Schmahmann, J. D., Stillman, B. W., Svoboda, K., Swanson, L. W., Toga, A. W., Van Essen, D. C., Watson, J. D., and Mitra, P. P. (2009). A proposal for a coordinated effort for the determination of brainwide neuroanatomical connectivity in model organisms at a mesoscopic scale. PLoS Comput. Biol. 5, e1000334. doi: 10.1371/journal.pcbi.1000334
Bullmore, E., and Sporns, O. (2009). Complex brain networks: graph theoretical analysis of structural and functional systems. Nat. Rev. Neurosci. 10, 186–198.
Costa, L. D., Rodrigues, F. A., Travieso, G., and Boas, P. R. V. (2007). Characterization of complex networks: a survey of measurements. Adv. Phys. 56, 167–242.
Costa, L. D., and Sporns, O. (2006). Correlating thalamocortical connectivity and activity. Appl. Phys. Lett. 89, 013903.
Dorogovtsev, S. N., Goltsev, A. V., and Mendes, J. F. F. (2008). Critical phenomena in complex networks. Rev. Mod. Phys. 80, 1275–1335.
Duda, R. O., Hart, P. E., and Stork, D. G. (2000). Pattern Classification. New York, NY: Wiley-Interscience.
Hilgetag, C. C., Burns, G., O’Neill, M. A., Scannell, J. W., and Young, M. P. (2000). Anatomical connectivity defines the organization of clusters of cortical areas in the macaque monkey and the cat. Philos. Trans. R. Soc. Lond. B Biol. Sci. 355, 91–110.
Hilgetag, C. C., and Kaiser, M. (2004). Clustered organization of cortical connectivity. Neuroinformatics 2, 353–360.
Li, T., Zhu, S. H., and Ogihara, M. (2006). Using discriminant analysis for multi-class classification: an experimental investigation. Knowl. Inf. Syst. 10, 453–472.
Mason, O., and Verwoerd, M. (2007). Graph theory and networks in biology. IET Syst. Biol. 1, 89–119.
Newman, M. E. J. (2005). A measure of betweenness centrality based on random walks. Soc. Networks 27, 39–54.
Pons, P., and Latapy, M. (2006). Computing communities in large networks using random walks. JGAA 10, 191–218.
Scannell, J. W., Burns, G., Hilgetag, C. C., O’Neil, M. A., and Young, M. P. (1999). The connectional organization of the cortico-thalamic system of the cat. Cereb. Cortex 9, 277–299.
Sporns, O. (2004). “Complex neural dynamics,” in Coordination Dynamics: Issues and Trends, eds V. K. Jirsa and J. A. S. Kelso (Berlin: Springer-Verlag), 197–215.
Sporns, O., Chialvo, D. R., Kaiser, M., and Hilgetag, C. C. (2004). Organization, development and function of complex brain networks. Trends Cogn. Sci. 8, 418–425.
Sporns, O., and Kotter, R. (2004). Motifs in brain networks. PLoS Biol. 2, 1910–1918. doi: 10.1371/journal.pbio.0020369
Sporns, O., Tononi, G., and Kotter, R. (2005). The human connectome: a structural description of the human brain. PLoS Comput. Biol. 1, 245–251. doi: 10.1371/journal.pcbi.0010042
Keywords: complex networks, cortical networks, Markov chains, accessibility
Citation: Costa LD, Batista JLB and Ascoli GA (2011) Communication structure of cortical networks. Front. Comput. Neurosci. 5:6. doi: 10.3389/fncom.2011.00006
Received: 10 September 2010;
Accepted: 25 January 2011;
Published online: 03 March 2011.
Edited by:
Jaap Van Pelt, VU University Amsterdam, NetherlandsReviewed by:
Renaud Lambiotte, Imperial College London, UKJaap Van Pelt, VU University Amsterdam, Netherlands
Copyright: © 2011 Costa, Batista and Ascoli. This is an open-access article subject to an exclusive license agreement between the authors and Frontiers Media SA, which permits unrestricted use, distribution, and reproduction in any medium, provided the original authors and source are credited.
*Correspondence: Luciano da Fontoura Costa, Institute of Physics at São Carlos, University of São Paulo, PO Box 369, São Carlos, São Paulo, CEP 13560-970, Brazil. e-mail: luciano@ifsc.usp.br