Characterization of type I and type II nNOS-expressing interneurons in the barrel cortex of mouse
- 1 Laboratoire de Neurobiologie, CNRS UMR 7637, ESPCI ParisTech, Paris, France
- 2 Wolfson Institute for Biomedical Research, University College London, London, UK
- 3 Department of Cell and Developmental Biology, University College London, London, UK
In the neocortex, neuronal nitric oxide (NO) synthase (nNOS) is essentially expressed in two classes of GABAergic neurons: type I neurons displaying high levels of expression and type II neurons displaying weaker expression. Using immunocytochemistry in mice expressing GFP under the control of the glutamic acid decarboxylase 67k (GAD67) promoter, we studied the distribution of type I and type II neurons in the barrel cortex and their expression of parvalbumin (PV), somatostatin (SOM), and vasoactive intestinal peptide (VIP). We found that type I neurons were predominantly located in deeper layers and expressed SOM (91.5%) while type II neurons were concentrated in layer II/III and VI and expressed PV (17.7%), SOM (18.7%), and VIP (10.2%). We then characterized neurons expressing nNOS mRNA (n = 42 cells) ex vivo, using whole-cell recordings coupled to single-cell reverse transcription-PCR and biocytin labeling. Unsupervised cluster analysis of this sample disclosed four classes. One cluster (n = 7) corresponded to large, deep layer neurons, displaying a high expression of SOM (85.7%) and was thus very likely to correspond to type I neurons. The three other clusters were identified as putative type II cells and corresponded to neurogliaform-like interneurons (n = 19), deep layer neurons expressing PV or SOM (n = 9), and neurons expressing VIP (n = 7). Finally, we performed nNOS immunohistochemistry on mouse lines in which GFP labeling revealed the expression of two specific developmental genes (Lhx6 and 5-HT3A). We found that type I neurons expressed Lhx6 but never 5-HT3A, indicating that they originate in the medial ganglionic eminence (MGE). Type II neurons expressed Lhx6 (63%) and 5-HT3A (34.4%) supporting their derivation either from the MGE or from the caudal ganglionic eminence (CGE) and the entopeduncular and dorsal preoptic areas. Together, our results in the barrel cortex of mouse support the view that type I neurons form a specific class of SOM-expressing neurons while type II neurons comprise at least three classes.
Introduction
The neuronal nitric oxide (NO) synthase (nNOS) isoform is expressed by distinct populations of neocortical neurons (Karagiannis et al., 2009; Kubota et al., 2011). NO is well known to play crucial roles in the induction or regulation of neuronal plasticity (Garthwaite and Boulton, 1995) and is involved in various neuronal functions such as learning and memory (Rancillac and Crepel, 2004; Garthwaite, 2008), neuronal death (Dawson and Dawson, 1998; Kiss, 2000), and cerebral blood flow control (Iadecola et al., 1993; Moro et al., 1995; Rancillac et al., 2006). Despite these pleiotropic effects of prime importance, cortical nNOS-expressing neurons are still poorly understood. Characterizing these neurons is thus an important step toward understanding their physiological functions.
In the neocortex nitrergic neurons are mainly GABAergic (Valtschanoff et al., 1993) and are generally divided in type I and type II neurons according to the intensity of NADPH diaphorase activity and/or nNOS immunoreactivity (Yan et al., 1996; Yan and Garey, 1997; Judas et al., 1999; Smiley et al., 2000; Lee and Jeon, 2005). Type I cells usually exhibit large somata, are intensely stained and represent about 2% of total GABAergic interneurons in the rat primary sensorimotor cortex (Kubota et al., 1994). In rodents, they are found in all cortical layers (Oermann et al., 1999), although they are more frequently observed in infragranular layers (Vercelli et al., 2000; Wiencken and Casagrande, 2000; Garbossa et al., 2001; Lee and Jeon, 2005). Immunohistochemical studies indicate that type I cells frequently co-express neuropeptide Y (NPY) and somatostatin (SOM; Dawson et al., 1991; Kubota et al., 1994; Gonchar and Burkhalter, 1997; Estrada and Defelipe, 1998; Smiley et al., 2000).
Type II cells, for their part, are much smaller and weakly stained (Yan et al., 1996). First described in the primate and human cortex (Aoki et al., 1993; Hashikawa et al., 1994; Gabbott and Bacon, 1995; Yan et al., 1996), they were recently reported in rodents (Lee and Jeon, 2005). Because of the technical limitations in identifying type II neurons, they have largely been neglected and their neurochemical characteristics are not well studied. In addition, little information is available regarding the morphological and electrophysiological characteristics of type I and type II nNOS-expressing neurons (Kilduff et al., 2011).
In the present study, we characterized cortical nitrergic interneurons with immunohistochemical labeling of distinct chemical markers in GAD67:GFP knock-in mice (Tamamaki et al., 2003). Furthermore, a multiparametric analysis of neurons expressing nNOS mRNA was performed using whole-cell current-clamp recordings coupled to single-cell reverse transcription (scRT)-PCR in acute slices of mouse somatosensory barrel cortex. Unsupervised clustering revealed the presence of four major classes of nitrergic neurons whose properties correlated to type I and type II nNOS immunoreactivity. Finally, we assessed the embryonic origins of type I and type II interneurons by using immunohistochemistry on mouse lines co-expressing GFP/YFP and two specific precursors expressed in distinct embryonic territories; medial ganglionic eminence (MGE; Lhx6) and caudal ganglionic eminence (CGE)-entopeduncular and dorsal preoptic areas (AEP/PO; 5-HT3A).
Materials and Methods
All experimental procedures were performed as described previously (Perrenoud et al., 2012) and were in accordance with the guidelines of the European Community Council Directive of November 24, 1986 (86/609/EEC).
Immunohistochemistry
Seven P17 GAD67:GFP knock-in (Δneo) transgenic mice (Tamamaki et al., 2003), three offspring of Lhx6-CRE and Rosa26R-YFP mice (Fogarty et al., 2007), and three 5-HT3A:GFP mice (GENSAT, Vucurovic et al., 2010) were used. Mice were deeply anesthetized with an intraperitoneal (IP) injection of pentobarbital (150 mg/kg body weight) and perfused transcardially with 4% paraformaldehyde in 0.1 M phosphate buffered saline (PBS), pH 7.4 (PFA). Brains were dissected, embedded in 3% agarose diluted in PBS, and cut coronally on a vibratome (Leica; VT1000S). Free-floating 45 μm thick coronal sections were collected serially. Alternate sections were incubated for 48–72 h at 4°C with one of the following antibodies diluted in PBS containing triton (0.2%; PBST): rabbit anti-nNOS antibody (1:500; Santa-Cruz sc-648), rabbit anti-PV (1:800; Swant PV28), rat anti-SOM (1:500; Millipore MAB354), or rabbit anti-vasoactive intestinal peptide (VIP; 1:500, ImmunoStar 20077). After washing in PBST, sections were incubated with AlexaFluor 568 goat anti-rabbit antibody or AlexaFluor 568 goat anti-rat antibody (1:300; Invitrogen). Sections were rinsed in PBST, mounted in Vectashield (Vector) containing DAPI. Confocal images were acquired with an SP5 confocal microscope (Nikon).
Counting of GABAergic Immunostained Neurons
Counting was performed using the method described in Perrenoud et al. (2012). Briefly, immunostained slices of GAD67:GFP knock-in (Δneo) transgenic mice were observed with a fluorescent microscope (Zeiss, Axio Imager M1) equipped with an AxioCam MRm CCD camera (Zeiss). Mosaics were constructed from images spanning the region of the posteromedial barrel subfield (PMBSF; approximately between −0.94 and −2.06 mm from Bregma (Paxinos and Franklin, 2001), acquired using a 10× objective, with the AxioVision 4.7 software (Zeiss) and stored as gray scale bitmaps. Counts were performed using a procedure written in IGOR PRO 6 (WaveMetrics) with a custom made algorithm dividing the radial extent of the neocortex into 30 bins while following its curvature and adapting to variations in its thickness. Layer boundaries matched closely with edges of particular bins: layer I corresponded to bin 1 and 2; layer II/III to bin 3–9; layer IV to bin 10–13; layer V to bin 14–21; and layer VI to bin 22–30. Counts were repeated at least on three slices per animal. For each animal, final values of densities were computed, normalizing the sum of counted cells by the corresponding counted area.
Slice Preparation for Electrophysiological Recordings
Juvenile C57BL/6 mice (Janvier) aged P14–P17 were deeply anesthetized with halothane and decapitated. Brains were quickly removed and cut into 300 μm thick slices with a 30–40° inclination from the sagittal plane into an ice cold (approximately 4°C) slicing solution continuously aerated with carbogen (95% O2/5% CO2; Air Liquide), containing (in mM): 110 choline chloride, 11.6 sodium ascorbate, 7 MgCl2, 2.5 KCl, 1.25 NaH2PO4, 25 glucose, 25 NaHCO3, and 3.1 sodium pyruvate (Bureau et al., 2006). Prior to recording, slices were maintained at room temperature in a holding chamber containing artificial cerebrospinal fluid (aCSF) aerated with carbogen, containing (in mM): 126 NaCl, 2.5 KCl, 2 CaCl2, 1 MgCl2, 1.25 NaH2PO4, 20 glucose, and 26 NaHCO3. In order to avoid excitotoxicity 1 mM of kynurenic acid (Sigma) was added to the solution.
Whole-Cell Patch-Clamp Recordings
Slices were submerged in thermostat controlled recording chamber (Luigs and Neuman), placed on the stage of an Axioskop 2FS microscope (Carl Zeiss), equipped with Dodt gradient contrast optics (Luigs and Neuman), and a CoolSnap FX CCD camera (Roper scientific) and visualized under infrared (IR) illumination. The preparation was continuously superfused (1–2 ml/min) with oxygenated aCSF. Barrels were visualized in the absence of the light condenser and recordings were performed within the barrel cortex. Pipettes (4–6 MΩ) were pulled from borosilicate capillaries and filled with 8 μl of autoclaved internal solution containing 144 mM K-gluconate, 3 mM MgCl2, 0.5 mM EGTA, 10 mM HEPES, pH 7.2 (285/295 mOsm), and 3 mg/ml biocytin (Sigma). Whole-cell recordings were performed at 30 ± 1°C in the current-clamp mode of a MultiClamp 700B amplifier (Molecular Devices). Signals were filtered at 4 kHz and digitized at 50 kHz with an analog signal converter (Digidata 1322A; Molecular Devices), and analyzed using pClamp 9.2 software (Molecular Devices). The sole criterion for selection of recorded cells was the absence of an apical dendrite. Junction potentials were not corrected.
Single-Cell RT-PCR Protocol
At the end of recordings, cytoplasms were aspirated into the patch pipette, expelled into a test tube in which reverse transcription was performed as described previously (Lambolez et al., 1992) and stored at −80°C. The scRT-PCR protocol was designed to detect the presence of messenger mRNAs coding for the vesicular glutamate transporter 1 (VGluT1), the two isoforms of glutamic acid decarboxylase (GAD65 and GAD67), nNOS, the calcium binding proteins calbindin (CB) 28k, calretinin (CR), and parvalbumin (PV), and the neuropeptides SOM, NPY, VIP, and cholecystokinin (CCK; Table 1). Two successive rounds of amplification were performed using nested primer pairs (Cauli et al., 1997). All primer pairs (Table 1) were designed to target two different exons so as to differentiate transcripts from genomic DNA. Amplification products were detected on 2% agarose gels in presence of a standard molecular weight marker (100 bp Ladder; Promega).
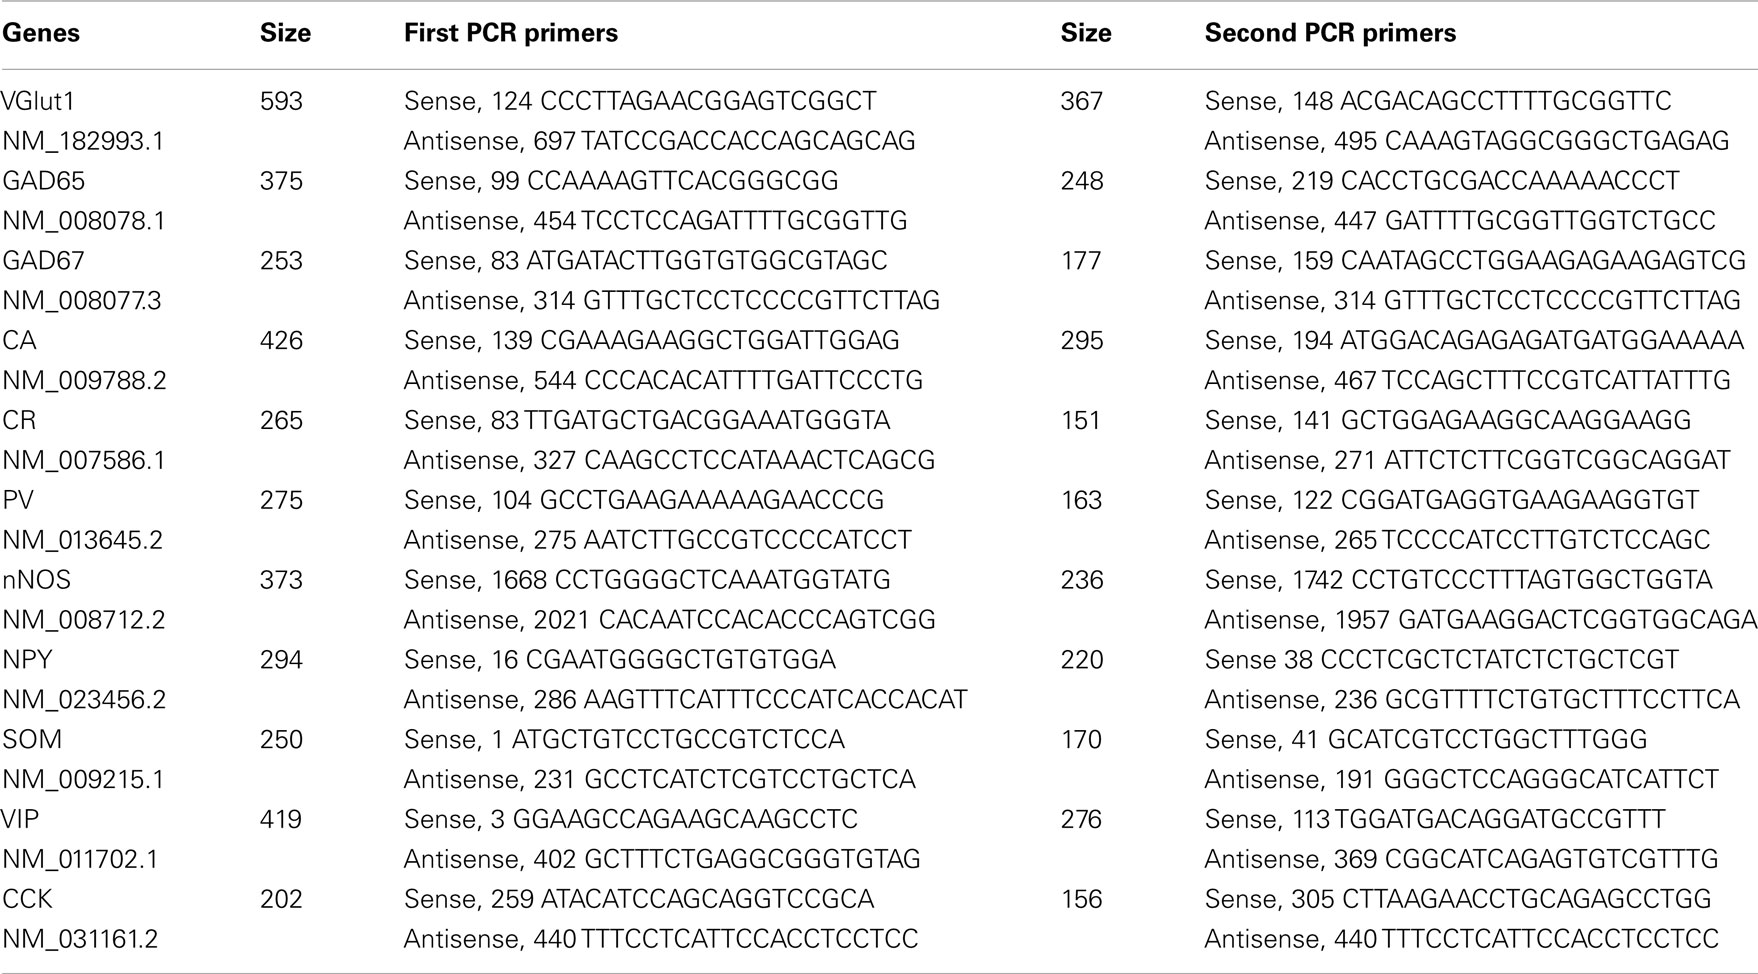
Table 1. PCR primer.
Histochemical Labeling and Morphological Reconstruction of Recorded Neurons
Recorded slices were fixed overnight at 4°C with 4% paraformaldehyde in 0.1 M phosphate buffer (PB) pH 7.4 and kept in PB at 4°C until further processed. Slices were then sequentially incubated in PB containing 1% H2O2 in order to quench endogenous peroxidases, and in PB containing Avidin Biotin Complex (Vector; 1:200) and Triton X-100 (0.5%). Neuronal morphology was visualized using diaminobenzidine nickel (DAB elite kit, Vector). Between each step slices were thoroughly rinsed in PB. Tissue sections were mounted in Mowiol (Calbiochem). For recorded cells with clearly visible dendritic arborizations, morphology was analyzed using a DMR microscope (Leica), equipped with a 100× objective together with a standard Neurolucida system (MBF Bioscience).
Electrophysiological Analysis
Voltage responses of neurons induced by 800 ms hyperpolarizing and depolarizing current pulses were measured as described previously (Vucurovic et al., 2010; Perrenoud et al., 2012). In order to characterize the behavior of recorded neurons, 22 electrophysiological parameters were measured: (1) resting potential (RMP), (2) input resistance (Rm), (3) membrane time constant (τm), (4) membrane capacitance (Cm), (5) Sag index, (6) rheobase, (7) first spike latency, (8) adaptation (mthreshold), (9) minimal steady-state frequency (Fmin; slope and y-intercept of a linear fit to the firing frequency at threshold, respectively), (10) amplitude accommodation (Hump), (11) amplitude of early adaptation (Asat), (12) time constant of early adaptation (τsat), (13) maximal steady-state frequency (msat), and (14) late adaptation (Fmax; defined such that the function F = Asat × exp(−t/τsat) + msat × t + Fmax), was fitted to the firing frequency in the trace just prior to saturation (15) amplitude (A1), (16) duration (D1), (18) AHP maximum (AHP1m), (17) ADP, (19) AHP latencies (tAHP2m), and (20) ADP latencies of the first action potential, (21) amplitude reduction (Amp.Red), and (22) duration increase (Dur.Inc) of the second action potential relative to the first.
Morphological Analysis
Eighteen parameters related to features of the soma and dendrites of reconstructed neurons were extracted as described previously (Perrenoud et al., 2012). In order to describe somata of reconstructed neurons, (1) the area, (2) perimeter, (3) maximal, and (4) minimal diameters of the soma were computed from IR pictures acquired prior to whole-cell recording. (5) Elongation was defined as the ratio between the maximal and minimal diameters (Karagiannis et al., 2009). The dendritic properties of vectorized neurons were extracted using Neurolucida explorer (MBF Bioscience) and analyzed using Excel (Microsoft). The following parameters were quantified: (6) number of primary dendrites, (7) total dendritic length, (8) average length of segments, (9) ratio of the total dendritic length to the total dendritic surface, (10) average tortuosity of dendritic segments, (11) number of dendritic nodes, and (12) fractal index (calculated using the box counting method; Douketis et al., 1995). According to the Sholl procedure (Sholl, 1953): (13) The length of the dendritic arborization enclosed within a radius of 100 μm around the cell body, (14) between 100 and 200 μm radii, (15) between 200 and 300 μm radii, (16) and outside a 300-μm radius were extracted and expressed as a fraction of the total dendritic length. Finally, a wedge analysis was performed where the volume around each reconstructed neuron was divided into 12 wedges centered on the soma (Dumitriu et al., 2007; Vucurovic et al., 2010). (17) Vertical extent and (18) horizontal extent were defined as the fraction of the dendritic arborization, respectively, enclosed in the four wedges closest to the radial cortical axis or to the tangential cortical axis.
Unsupervised Clustering
Using Ward’s (1963) method, cells are grouped in clusters so as to minimize the Euclidean distances between cells and cluster-centroids in multiparametric space. An advantage of this unsupervised clustering algorithm is that definition of the number of classes to be characterized is not required prior to analysis. However, a drawback of Ward’s method is that miss-assigned cells are not corrected during the iterative process. Clusters generated with Ward’s method were thus corrected using the K-means algorithm. This method initiates with k arbitrarily assigned cluster centers and assigns each observation to one of k corresponding clusters by minimizing the distance of the observation to the centers. The actual cluster-centroids are subsequently computed and the process is repeated until an optimum solution is reached whereby observations are allocated into k non-overlapping groups. Here, initial cluster centers were chosen so as to correspond to the centroids of the clusters generated with Ward’s methods. This combination allowed the generation of non-overlapping clusters without making prior assumptions about the number of groups into which neurons should be separated. The threshold defining the number of clusters on Ward’s dendrogram was set to the value maximizing the mean silhouette value of classified neurons after K-means correction. In silhouette analysis (Karagiannis et al., 2009), the value S(i) is computed for each data point as: S(i) = [b(i) − a(i)]/max[a(i), b(i)] where, for a data point i, a(i) corresponds to the average distance between i and the points belonging to the same cluster and b(i) corresponds to the average distance between i and the points of the closest cluster. In our case, a positive silhouette value indicates that on average, the neuron is closer to the neurons of its own cluster than from the neurons belonging to other clusters in the parameter space. By contrast, a negative value indicates a potential misclassification. Thus, a decrease of the mean silhouette value of the cells following randomization was interpreted as a lower quality of clustering. In order to maximize the consistency of the clustering results, parameters were not used for clustering (i) if they were dependent upon other parameters, (ii) if they were subjected to excessive variability from trial to trial, or (iii) if they were invariant in all observed cells. Based on these criteria, electrophysiological parameters used for clustering analysis were RMP, Rm, τm, Cm, Sag index, Hump, Asat, tsat, Csat, msat, A1, D1, AHP1max, tADP1, tAHP1max, Amp.Red, and Dur.Inc. Molecular parameters included in the clustering analysis were computed, as binary variables set to 1 if the marker was present and 0 if absent and corresponded to CB, PV, CR, NPY, VIP, and SOM. For all parameters, distributions were centered and reduced prior to clustering in order to eliminate any weighting effects induced by differences of scaling. This appeared sufficient to ensure that binary and continuous parameters had a similar effect on clustering analysis (Perrenoud et al., 2012).
Statistical Analysis
For electrophysiological and morphological variables, differences were tested using Kruskal–Wallis non-parametric ANOVAs followed by Mann–Whitney U-tests for pair comparisons. In order to test differences in the occurrence of molecular markers, we computed the statistic │ε│ = │pa − pb│/√[(pq/na) + (pq/nb)] where pa and pb represent the percentages of occurrence of the marker, and na and nb the number of individuals in cluster a and b. The percentages of occurrence and of absence of the marker in the overall population were represented by p and q = 1 − p, respectively. p-Values of the difference of expression were computed by plotting this statistic against a standard normal distribution (Karagiannis et al., 2009). Variations in the density of labeled GABAergic cells between neocortical layers were tested using a one-way ANOVA on repeated measures test, followed by Student Newman–Keuls tests for pair comparisons. Kruskal–Wallis ANOVA, one-way ANOVA on repeated measures, and Student Newman–Keuls test were performed using Sigma Stat (LogiLabo). Mann–Whitney U-tests were performed within the Matlab environment (MathWorks) and statistical tests for molecular expression were performed in Excel (Microsoft).
Results
Laminar Distribution of Type I and Type II nNOS Immunolabeled Neurons
The aim of this study was to characterize the populations of neocortical interneurons defined by nNOS immunoreactivity. In order to fulfill this goal we examined the density and the laminar distribution of these cells using immunohistochemistry. Cells defined by nNOS immunolabeling were counted in each layer of the barrel cortex from juvenile mice (P17; PMBSF; approximately between −0.94 and −2.06 mm from Bregma; Paxinos and Franklin, 2001). In order to ensure that all counted neurons were GABAergic, counts were performed on a strain of GAD67:GFP mice where GFP is thought to be restricted to and expressed in all GABAergic cells. Counts were normalized by the area of the counted region so as to provide a measure of density and were repeated on three animals. Counts were averaged between barrels and septa.
In agreement with previous reports (Yan et al., 1996; Yan and Garey, 1997; Smiley et al., 2000; Lee and Jeon, 2005) we found that two types of cells are defined on the basis of nNOS immunoreactivity. Type I cells corresponded to strongly labeled cells displaying large somata (Figure 1A2). By contrast, type II cells corresponded to smaller interneurons displaying weaker labeling, typically restricted to the perikaryon. The densities of these types of cell were assessed separately and each appeared to adopt a specific distribution and to concentrate in particular neocortical layers. Type I neurons were sparse (9.4 ± 2.7 cells/mm2 overall) and accumulated preferentially in layer VI where they had a density of 21.1 ± 7 cells/mm2. Type I neurons could be found at more moderate densities in layer V and layer II/III but were almost absent from layer I to IV (Figure 1B1). The overall density of type II neurons was higher than the density of type I neurons (18.3 ± 2.5 cells/mm2 overall). Type II neurons populated all neocortical layers but accumulated preferentially in layer II/III and layer VI (Figure 1B2).
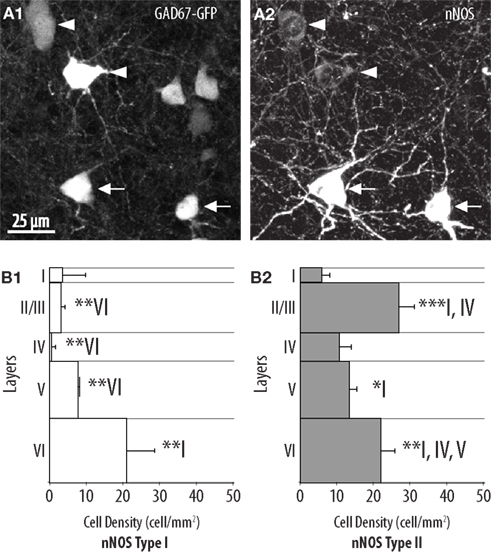
Figure 1. Distribution of type I and type II nNOS-expressing GABAergic interneurons in the mouse barrel cortex. (A) Colocalization of GFP (1) with nNOS immunolabeling (2) in GAD67:GFP mice. Arrows point to examples of type I (heavily labeled) nNOS-expressing GABAergic neurons and arrowheads point to examples of type II (weakly labeled) nNOS-expressing GABAergic cells. (B) Histogram of the density of type I (1) and type II (2) nNOS immunolabeled GFP-expressing cells in cortical layers I–VI (n = 3 mice; error bars: standard deviation; *, **, and *** indicate statistically significant differences with p ≤ 0.05, p ≤ 0.01, and p ≤ 0.001, respectively; roman numerals refer to neocortical layers).
Immunodetection of PV, SOM, and VIP in Type I and Type II nNOS Interneurons
PV, SOM, and VIP immunoreactivity profiles define three well-characterized non-overlapping populations of interneurons in the cerebral cortex (Kubota et al., 1994; Gonchar and Burkhalter, 1997; Gonchar et al., 2007; Xu et al., 2010). In order to further characterize type I and type II nNOS-expressing interneurons, we investigated the expression of SOM, PV, and VIP using triple immunofluorescent labeling performed on GAD67:GFP knock-in mice. As apparent in Figures 2A,D1, 91.5 ± 4.0% of type I neurons expressed SOM. These results are consistent with previous reports indicating that SOM is a distinctive marker of type I neurons (Smiley et al., 2000). In agreement, only 11.0 ± 6.9% of type I neurons expressed PV and none expressed VIP (Figures 2E1,F1). By contrast, type II cells did not display a distinct immunoreactivity profile since PV, SOM, and VIP were expressed by 17.8 ± 5.0, 18.7 ± 6.9, and 10.2 ± 5.5% of type II interneurons, respectively. Interestingly, PV and SOM immunoreactive type II neurons were preferentially concentrated in deep neocortical layers while VIP immunoreactive type II neurons were located at the highest density in layers II/III (Figures 2D2,E2,F2). Thus, our results suggest that type II interneurons represent a heterogeneous population of interneurons.
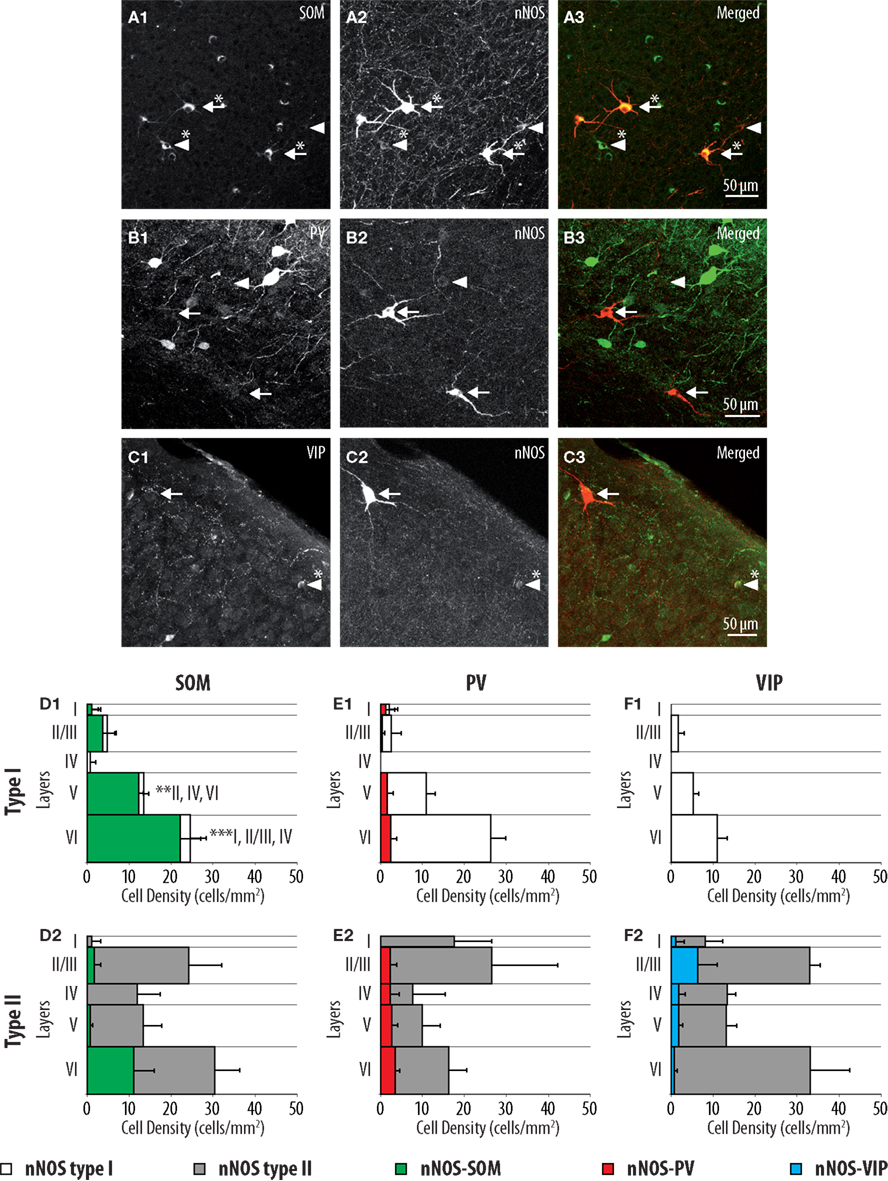
Figure 2. Distributions of SOM, PV, and VIP expressing cells within type I and type II nNOS immunolabeled GABAergic interneurons. (A–C) Colocalization of SOM, PV, and VIP (1) with nNOS immunolabeling (2) in GAD67:GFP knock-in mice. Arrows point to examples of type I (heavily labeled) nNOS-expressing neurons, arrowheads point to examples of type II nNOS (weakly labeled) expressing neurons. Double-labeled cells are marked by an asterisk. (D–F) Histograms reflecting the densities of SOM (green), PV (red), and VIP (blue) expressing neurons within type I (1) and type II (2) nNOS-GFP-expressing interneuron classes in cortical layers I–VI. The densities of doubled labeled cells are superimposed on the overall densities of nNOS type I (white) and nNOS type II (gray) interneurons (n = 3 mice; error bars: standard deviation; *, **, and *** indicate significant differences with p ≤ 0.05, p ≤ 0.01, and p ≤ 0.001, respectively; roman numerals refer to neocortical layers).
Characterization of Interneurons Expressing nNOS mRNA
To further characterize nNOS-expressing interneurons, a sample of 42 cells expressing nNOS mRNA were selected from a large database of neocortical interneurons characterized ex vivo using whole-cell patch-clamp recordings coupled to scRT-PCR and biocytin labeling on juvenile mice (P17-P14). The properties of these neurons were quantified using a set of 49 defined parameters. Twenty-two electrophysiological parameters (Tables 2–5) were measured from neuronal responses to hyperpolarizing and depolarizing current pulses. In accordance with the Petilla terminology (Ascoli et al., 2008), these parameters took into account passive membrane properties (five parameters, Table 2), the properties of the discharges at threshold (four parameters, Table 3), and saturation (five parameters, Table 4), in addition to properties of action potentials (eight parameters, Table 5). Nine molecular markers were detected by scRT-PCR alongside with nNOS: VGluT1, GAD [i.e., expression of either glutamic acid decarboxylase 65K or glutamic acid decarboxylase 67K (GAD65 and GAD67)], the calcium binding proteins CB, PV, and CR, and the neuropeptides NPY, VIP, SOM, and CCK (Figure 3). Finally, for a subset of 29 GABAergic neurons, morphological variables were measured from IR images of somata and from Neurolucida reconstructions of the dendritic trees. Eighteen morphometric parameters describing the soma (five parameters; Table 6), the local features of the dendrites (seven parameters; Table 7), and the spatial organization of the dendritic arborization (six parameters; Table 8) were extracted for each cell. Due to the fact that high scRT-PCR efficiency requires that up to one third of the cytoplasmic content is harvested (Tsuzuki et al., 2001); a procedure which has a negative effect on biocytin labeling (Karagiannis et al., 2009; Vucurovic et al., 2010), characterization of the axon was not possible for every neuron analyzed for gene expression and electrophysiological behavior. Nevertheless, representative examples of axons were obtained cells in each identified population.
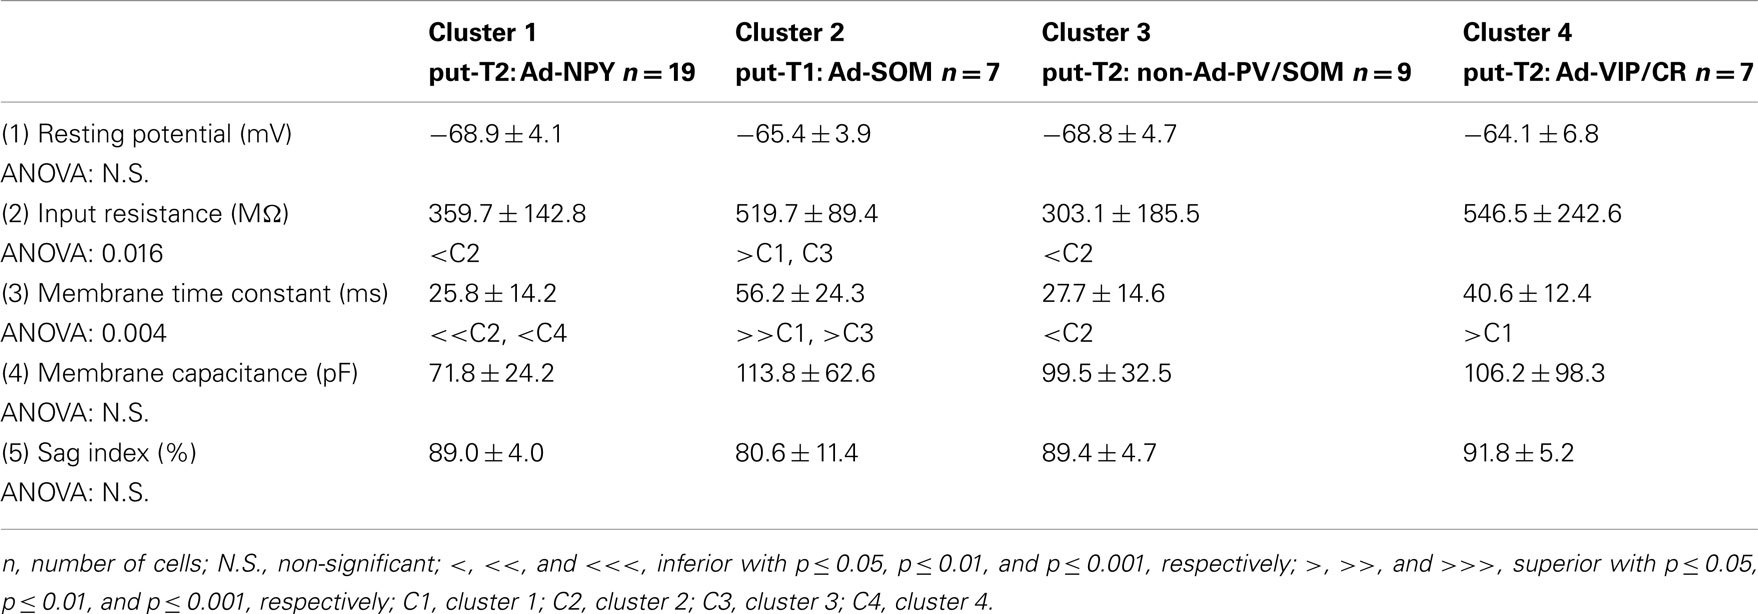
Table 2. Passive membrane properties.
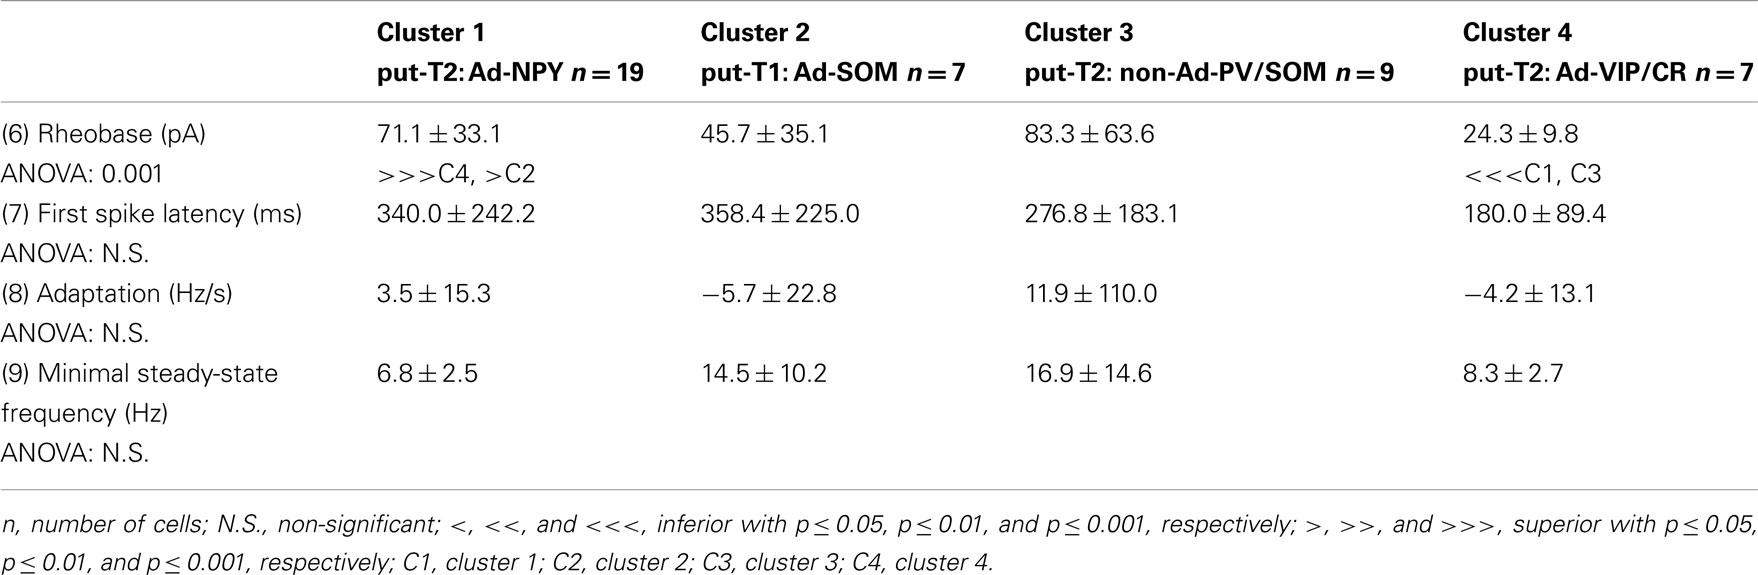
Table 3. Just above threshold properties.
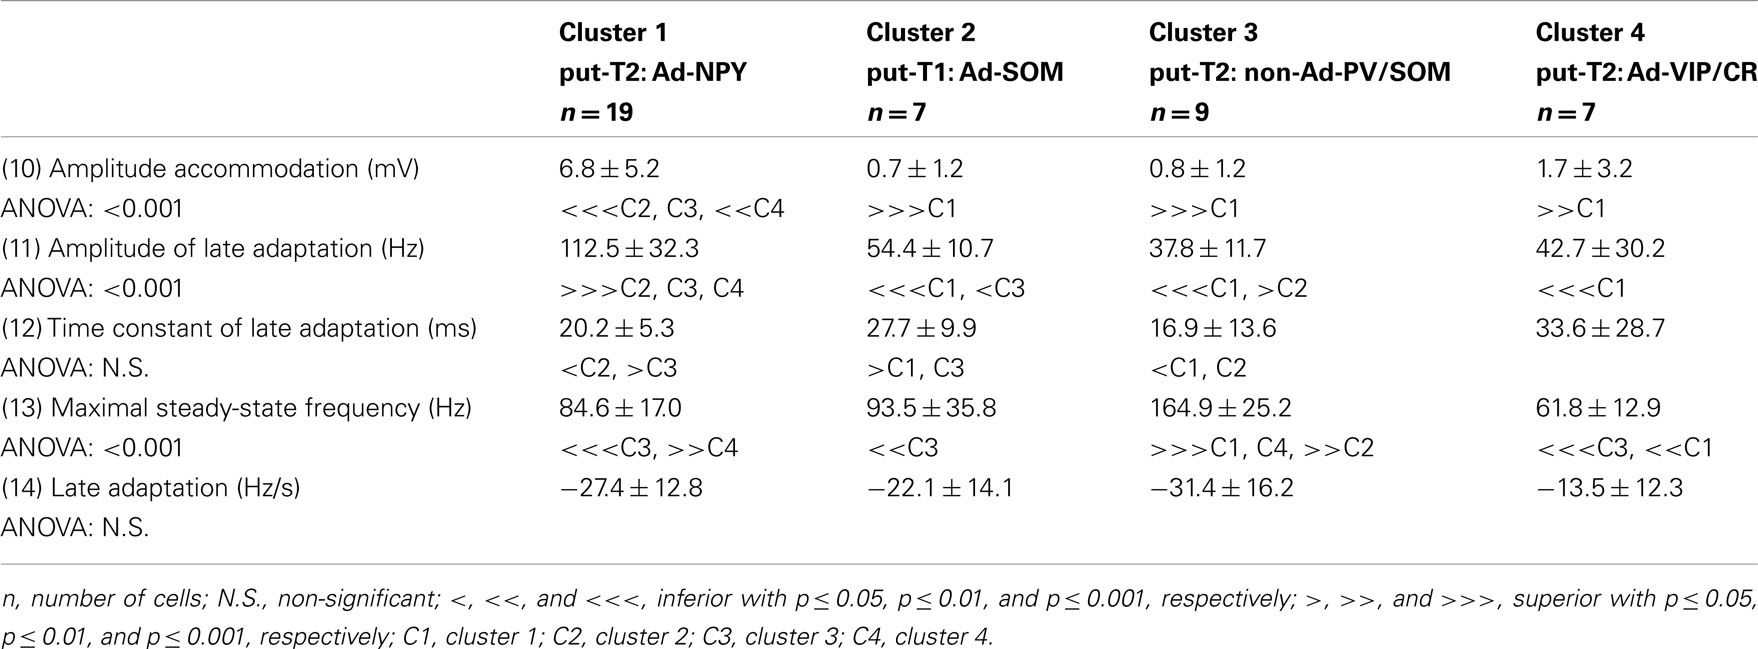
Table 4. Firing properties.
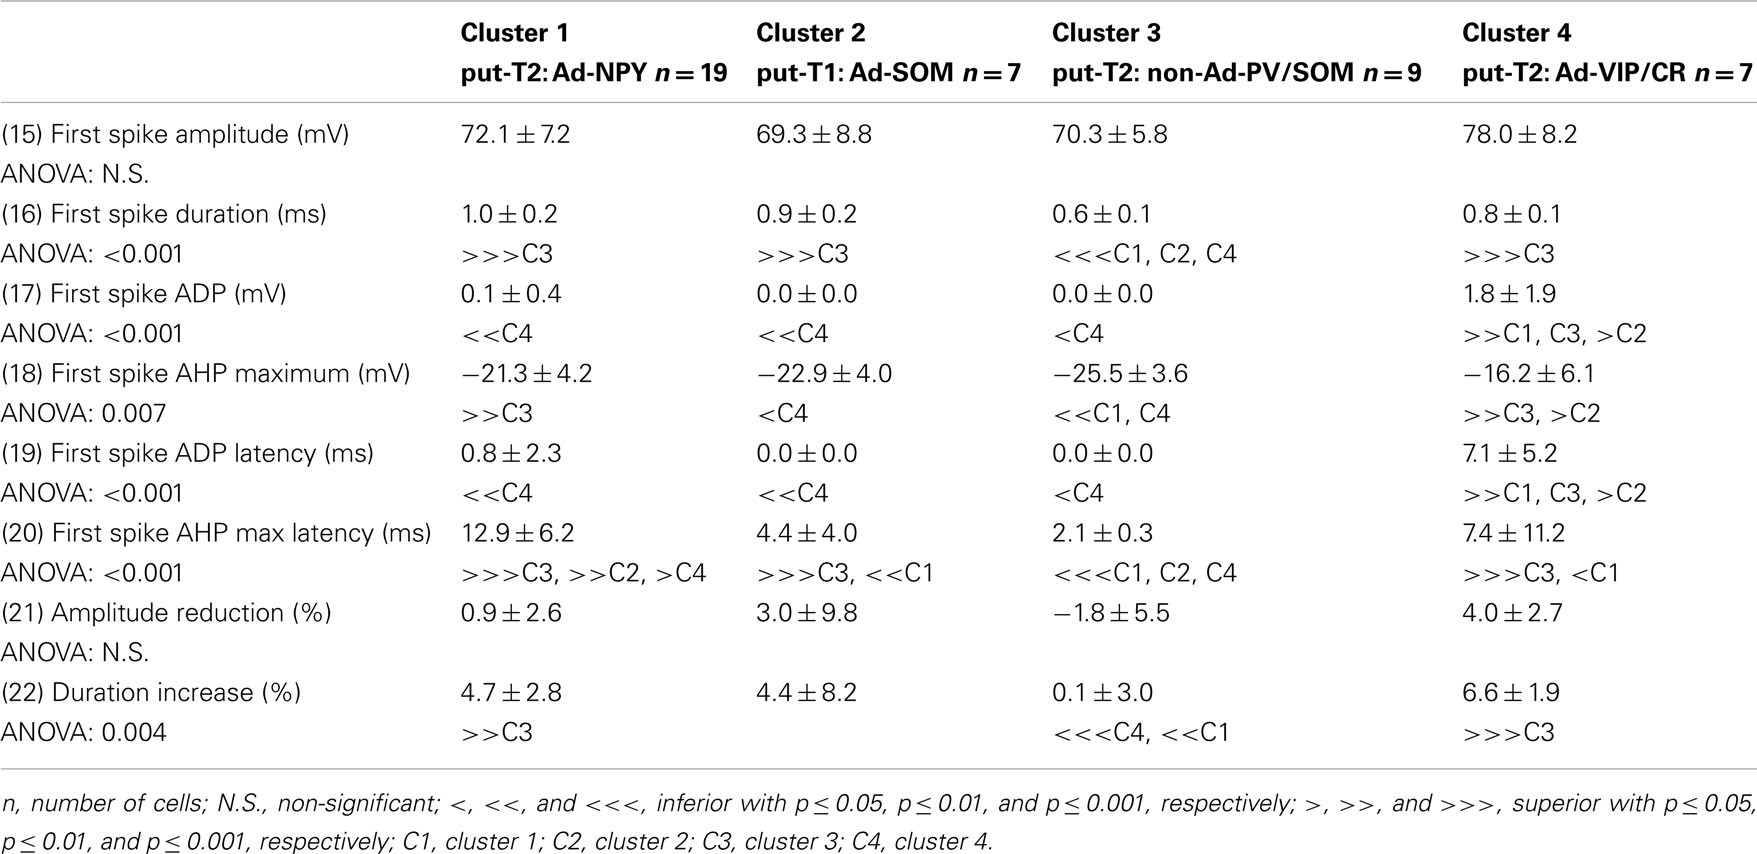
Table 5. Action potential properties.
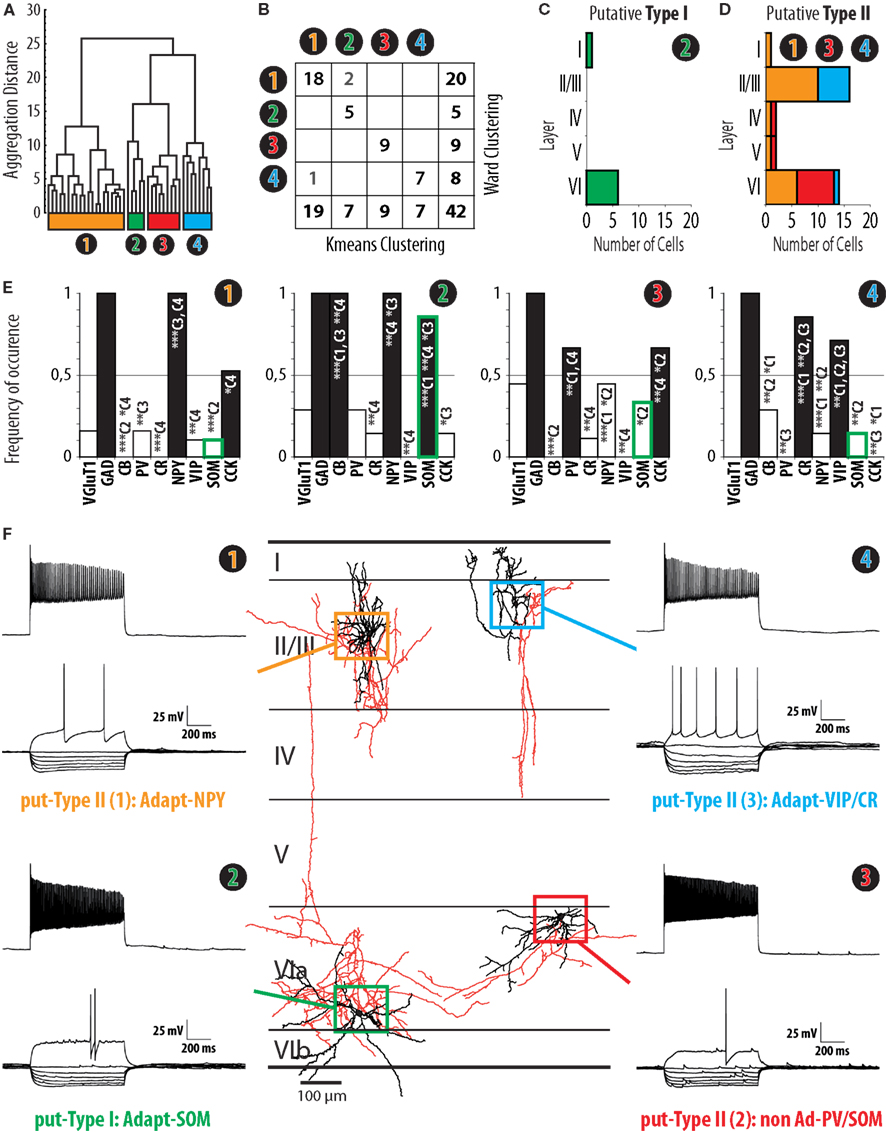
Figure 3. Clustering of interneurons expressing nNOS mRNA. (A) Ward’s clustering of 42 nNOS interneurons sampled from slices of the barrel cortex of juvenile (P14–P17) mice. Individual cells are represented along the x-axis. The y-axis represents the distance of aggregation in a space of 17 electrophysiological variables and 6 molecular markers. Four clusters, termed Adapt-NPY (cluster 1, yellow), Adapt-SOM (cluster 2, green), non-Ad-PV/SOM (cluster 3, red), and Adapt-VIP/CR (cluster 4, blue) were identified. (B) Table corresponding to Ward’s clustering in (A) and a clustering output generated by the K-means algorithm with the same sample and parameters with non-overlapping components in gray font. Note that the clusters are mostly overlapping. (C) Laminar distribution of cluster 2. Note that the distribution is consistent with the distribution of type I nNOS immunolabeled neurons (Figure 1). (D) Cumulated laminar distribution of clusters 1 (yellow), 3 (red), and 4 (blue). Note that the distribution is consistent with the distribution of type II nNOS immunolabeled neurons (Figure 1). (E) Histograms of the expression of Vglut1, GAD, CB, PV, CR, NPY, VIP, SOM, and CCK in clusters 1, 2, 3, and 4. Note that the expression of SOM mRNA in cluster 2 closely resembles the profile of SOM expression in type I nNOS immunolabeled neurons (Figure 2) while this is not the case for other clusters (green contour on histogram bars; C1: cluster 1; C2 cluster 2; C3: cluster 3; C4: cluster 4; *, **, and *** indicate significant differences with p ≤ 0.05, p ≤ 0.01, and p ≤ 0.001, respectively). (F) Representative examples of electrophysiological properties (left and right panels) and morphology (central panel) from neurons from clusters 1 (yellow, upper left), 2 (green, lower left), 3 (red, lower right), and 4 (blue, upper right). Electrophysiological traces correspond to voltage responses induced by current injections (bottom traces: −100 to 0 pA by increments of 10 pA and rheobase; top trace: last step of current before saturation). For the morphological reconstructions of corresponding neurons, somatodendritic trees are illustrated in black, axons in red. Neurons are represented at their respective laminar positions.
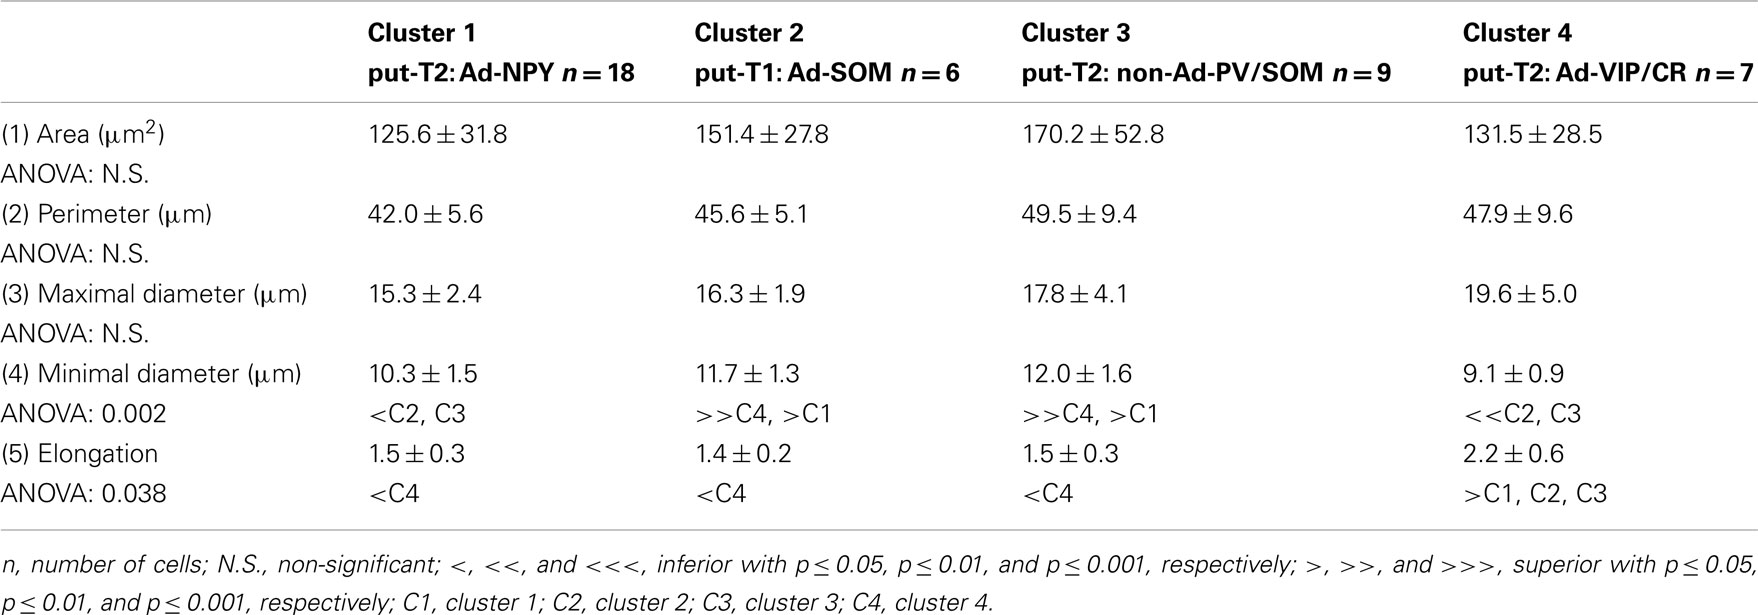
Table 6. Soma under infrared microscopy.
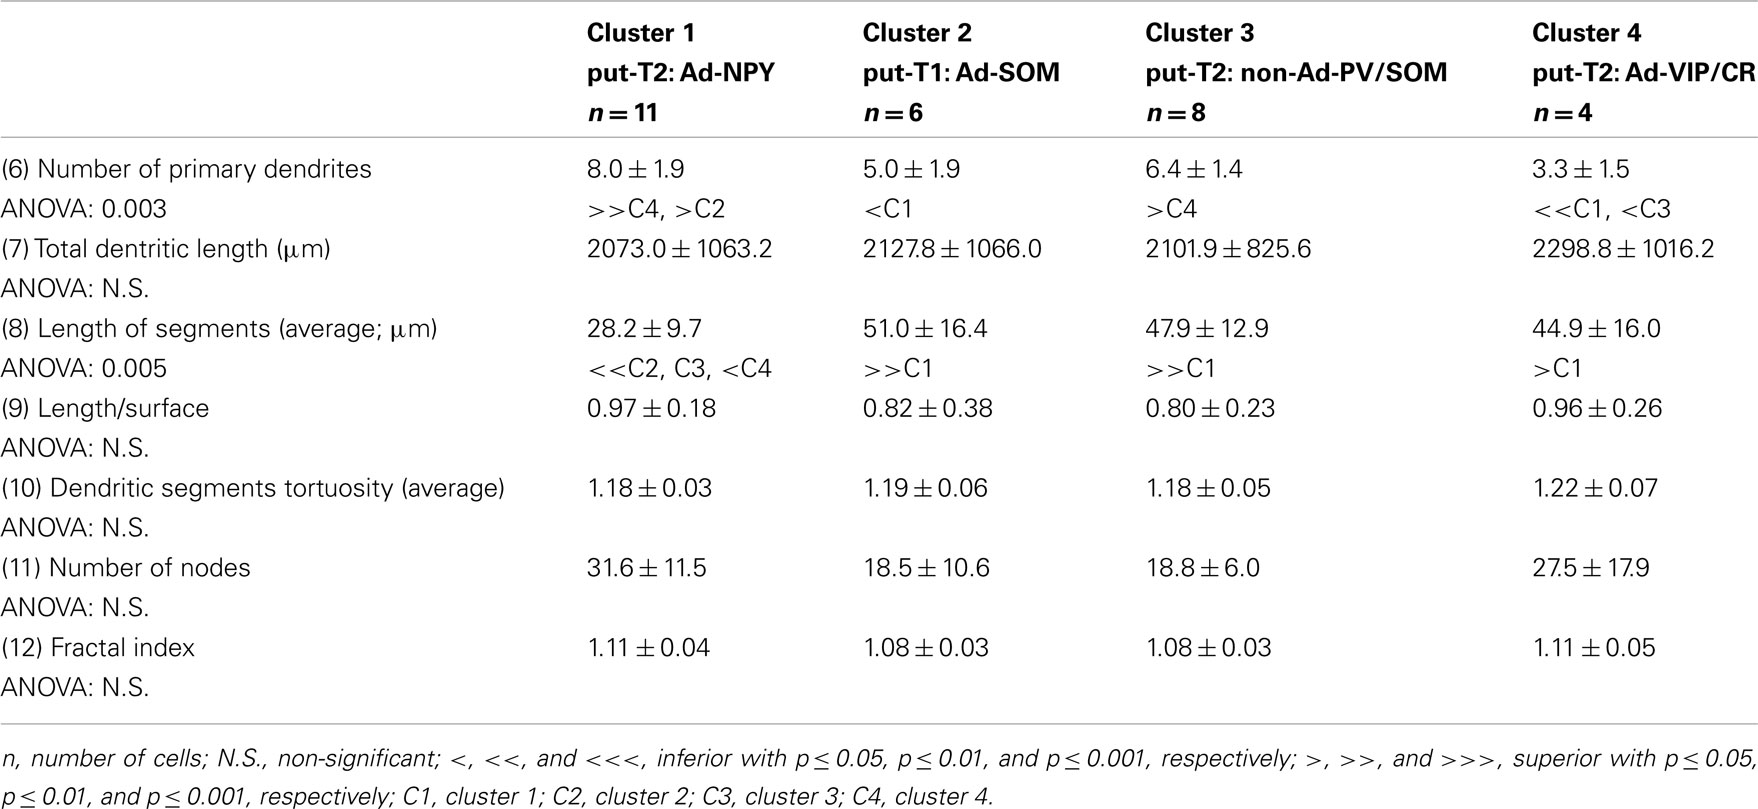
Table 7. Local metric of dendrites.
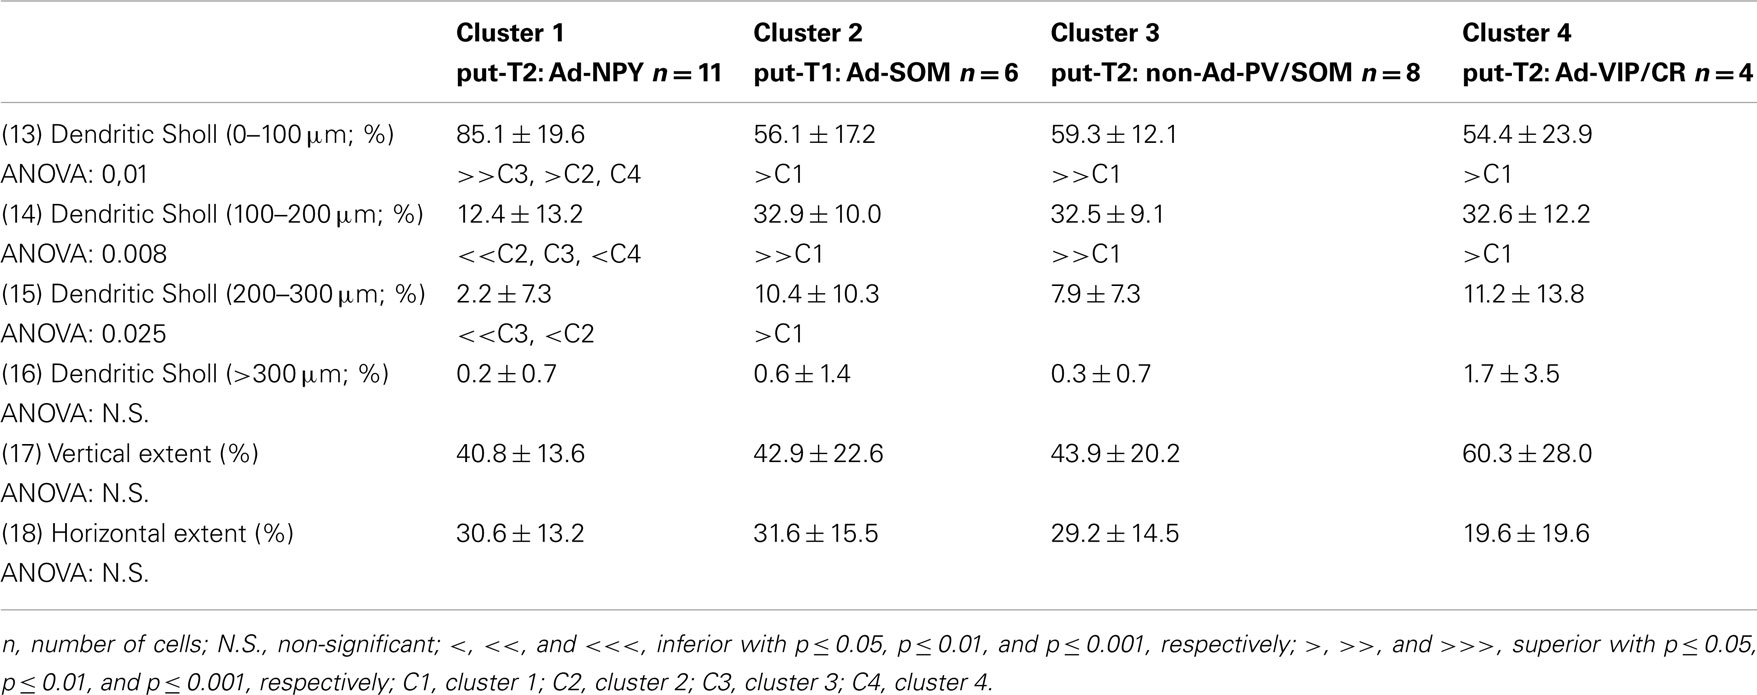
Table 8. Spatial distribution of the dendritic arbor.
Unsupervised Classification of Interneurons Expressing nNOS mRNA
In order to determine whether interneurons expressing nNOS mRNA can be divided into subgroups based on functional and molecular parameters, we applied Ward’s method; an algorithm which has been widely used in the categorization of interneurons (Tamas et al., 1997; Cauli et al., 2000; Gallopin et al., 2006). Ward’s clustering was applied on the basis of 17 electrophysiological variables and 6 molecular parameters representing the properties of sampled neurons (see Materials and Methods). As illustrated in the resulting aggregation dendrogram (Figure 3A), four groups of cells could be identified in our sample of nNOS transcribing neurons. These groups were designated as clusters 1, 2, 3, and 4 and represented 20, 5, 9, and 8 neurons, respectively. As outlined previously (see Materials and Methods), due to its iterative nature, Ward’s method has the advantage that no assumptions are required regarding the number of groups into which observations should be classified. However, a drawback of this method is that miss-assigned cells are not corrected through the iterative process. So as to eliminate potential mistakes occurring, Ward’s clusters were corrected using the K-means algorithm (see Materials and Methods, Karagiannis et al., 2009; McGarry et al., 2010; Perrenoud et al., 2012). Following correction, two cells of cluster 1 were reassigned to cluster 2, and one neuron of cluster 4 was reassigned to cluster 1 (Figure 3B). In order to determine whether the allocation of neurons into four groups based on these parameters was the optimal outcome of the clustering process, our results were compared with clustering trials whereby thresholds were set to define fewer or higher numbers of groups. After K-means correction, the mean silhouette value for cluster analysis yielding four groups was 0.3014 (see Materials and Methods; Karagiannis et al., 2009; McGarry et al., 2010; Perrenoud et al., 2012). By comparison, clusterings obtained after correction for three or five groups resulted in smaller mean silhouette values (0.2879 and 0.2023, respectively), indicating a loss of clustering quality. Thus, the subdivision of neurons into four groups was retained for further analysis. The neurons of clusters 1, 2, and 3 displayed adapting action potential discharges and were characterized by a high expression of NPY, SOM, and VIP/CR, respectively. These clusters were thus named adapting NPY (Adapt-NPY), adapting SOM (Adapt-SOM), and adapting VIP/CR (Adapt-VIP/CR). By contrast, cluster 4 neurons showed little adaptation of firing frequencies and expressed PV or SOM. Cluster 4 was thus termed non-adapting PV/SOM (non-Ad-PV/SOM).
Identification of Putative Type I and Type II Cells within Interneurons Expressing nNOS mRNA
To determine whether identified clusters of cells expressing nNOS mRNA could correspond to type I or type II nNOS immunoreactivity, we examined the laminar distribution of nNOS neurons (Figures 3C,D) and their expression of the molecular markers PV, SOM, and VIP (Figure 3E). Particular attention was paid to the level of transcription of SOM as the expression of this marker was a distinctive feature of type I neurons at the protein level (Figure 2C2). As apparent in Figure 3E, SOM was present in 85.7% of the neurons in cluster 2 (Adapt-SOM), a proportion highly consistent with the level of expression of SOM in type I interneurons. The laminar distribution of neurons within cluster 2 (Figure 3C) also appeared to replicate the distribution of type I neurons as assessed by immunohistochemistry (Figure 1B1). The cumulated laminar distribution (Figure 3D) and levels of PV, SOM, and VIP expression for neurons in clusters 1, 3, and 4 (Figure 3F) also appeared to be in strong agreement with results obtained at the protein level for type II neurons (Figures 1 and 2). Consistent with the expression of PV and SOM in deep layer type II neurons (Figures 2C2,D2), these mRNAs were highly expressed in neurons within cluster 3 (non-Ad-PV/SOM) which were preferentially found in layer VI (Figures 3D,E). In addition, the expression of VIP in superficial type II neurons (Figure 2E2) corresponded reasonably well with the high levels of VIP expression (Figure 3E) and the preferential localization in layers II/III of cluster 4 neurons (Adapt-VIP/CR; Figure 3D). Thus, based on the striking agreement of our multiparametric results with the distribution and marker expression of type I and type II nNOS-expressing neurons, cluster 2 cells were identified as putative type I interneurons, while neurons within clusters 1, 3, and 4 were identified as putative type II cells. To further investigate this hypothesis, we next undertook a multiparametric characterization of putative type I and type II nNOS-expressing neurons.
Multiparametric Characteristics of Putative Type I Interneurons
Putative type I neurons belonging to the Adapt-SOM cluster (n = 7) displayed distinctive properties. Electrophysiological data showed that putative type I neurons were characterized by medium to high input resistances and significantly higher membrane time constants than the neurons of other clusters (Table 2). They displayed a marked adaptation of frequency at threshold (Table 3) and saturation (Table 4) and fired long duration spikes followed by fast AHPs (Table 5; Figure 3F). Alongside their previously mentioned high expression of SOM, putative type I neurons displayed significantly higher levels of CB (100%) and NPY (100%) than neurons in other clusters (Figure 3E). Putative type I neurons typically displayed large somata (Table 6), exhibiting an average of five primary dendrites (Table 7), which ramified to form a wide dendritic arbor extending up to 300 μm away from the cell body (Table 8). The axon of two putative type I cells could be reconstructed to a length in excess of 1 mm and appeared to ramify extensively within the layer of origin (illustrated in Figure 3F). Finally, concurring with immunohistochemical results, putative type I neurons were principally sampled in layer VI (six of seven neurons) but also occurred in layer II/III (one of seven neurons; Figure 3D).
Multiparametric Characteristics of Putative Type II Interneurons
Our results suggest that type II neurons comprise three populations of neurons, each with distinct characteristics: Adapt-NPY (cluster 1), non-Ad-PV/SOM (cluster 3), and Adapt-VIP/CR (cluster 4). Adapt-NPY neurons (n = 19) populated all neocortical layers but were most abundant in layers II/III and VI (Figure 3D). Electrophysiological data showed that Adapt-NPY were characterized by medium range input resistances (Table 2). Their action potential discharges were accelerating at threshold (Table 3), adapting at saturation and displayed a significantly larger accommodation of spike amplitude than for neurons in other clusters (Table 4). Adapt-NPY neurons displayed long duration action potential spikes and were characterized by significantly slower AHP duration than other neurons (Table 5). Interestingly, Adapt-NPY neurons did not show a notable expression of calcium binding proteins such as PV, CB, or CR (Figure 3E). Alongside NPY (100%), they mostly expressed CCK (52.6%). Finally, Adapt-NPY neurons showed a highly distinctive morphological profile. They had small somata (Table 6) and exhibited a significantly higher number of primary dendrites than other neurons (Table 7). Their dendrites ramified extensively (Table 7) and tended to stay confined within a radius of 200 μm around the soma (Table 8). The axons of three cells could be reconstructed extending in excess of 1 mm and also appeared to ramify extensively around the cell body. These characteristics suggest that Adapt-NPY very likely correspond to neurogliaform cells (Kawaguchi, 1995).
Non-Ad-PV/SOM neurons (n = 9) were principally sampled in layer VI (seven of nine neurons) and displayed the most distinctive electrophysiological characteristic of our sample. They had depolarized membrane potentials and short time constants (Table 2). They showed little or no adaptation at threshold (Table 3), fired at a significantly higher maximal rate (Table 4), with significantly faster spike durations and AHP dynamics than other neurons (Table 5). Non-Ad-PV/SOM expressed either PV (66.7%) or SOM (33.3%) but never co-expressed both markers. They were also characterized by a high occurrence of CCK expression (66.7%). Finally, on a morphological basis, non-Ad-PV/SOM neurons appeared as multipolar cells with large somata. The axon of one non-Ad-PV/SOM was reconstructed extending in excess of 1 mm from the soma and appeared to ramify within its layer of origin (Figure 3F).
Adapt-VIP/CR neurons (n = 7) appeared to concentrate preferentially in superficial layers (Figure 3D). They were characterized by high input resistances (Table 2), low rheobases, adapting discharges at threshold (Table 3) and saturation, and fired at significantly lower maximal frequencies than other neurons (Table 4). Some of them displayed double AHPs (Table 5). They mostly expressed CR (85.7%) and VIP (71.4%; Figure 3E). On a morphological basis, they appeared as fusiform neurons, having significantly higher soma aspect ratio than other neurons (Table 6). Most of them were of bipolar morphology resulting in a significantly lower number of dendrites than other cells (Table 7). The axon of one Adapt-VIP/CR was reconstructed in excess of 1 mm and appeared to be descending (Figure 3F).
Embryonic Origin of Type I and Type II nNOS-Expressing Interneurons
Most neocortical interneurons originate in the embryonic subpallium (Wonders and Anderson, 2006). This region is subdivided into several progenitor domains each giving rise to specific populations of interneurons (Gelman and Marin, 2010). In order to complement the characterization of nNOS-expressing interneurons, we attempted to obtain insight about their embryonic origins. To achieve this goal, we performed nNOS immunostaining in two transgenic mouse lines where specific and non-overlapping regions of the subpallium are labeled with fluorescent proteins (Flames et al., 2007; Fogarty et al., 2007; Lee et al., 2010; Vucurovic et al., 2010; Vitalis and Rossier, 2011): Lhx6-Cre/R26R-YFP mice (Figure 4A) where fluorescence is found in neurons originating from the MGE and 5-HT3A:GFP mice (Figure 4B) where labeled neurons originate in the CGE, and in the AEP/PO. Nearly all type I neurons (98.6 ± 2.5%) expressed GFP in Lhx6-Cre/R26R-YFP (Figure 4C1) indicating that all originate in the MGE. Accordingly type I neurons never expressed GFP in 5-HT3A:GFP mice (Figure 4D1). By contrast 63.0 ± 6.8% of type II neurons expressed GFP in Lhx6-Cre/R26R-YFP mice while 34.4 ± 0.9% were labeled in 5-HT3A:GFP mice (Figures 4C2,D2). This indicated that type II neurons comprise neurons originating both in the CGE-AEP/PO and the MGE, reinforcing the idea that they form a heterogeneous population. Interestingly, GFP-expressing type II neurons appeared to accumulate in deeper layers in Lhx6-Cre/R26R-YFP mice while they accumulated in upper neocortical layers in 5-HT3A:GFP.
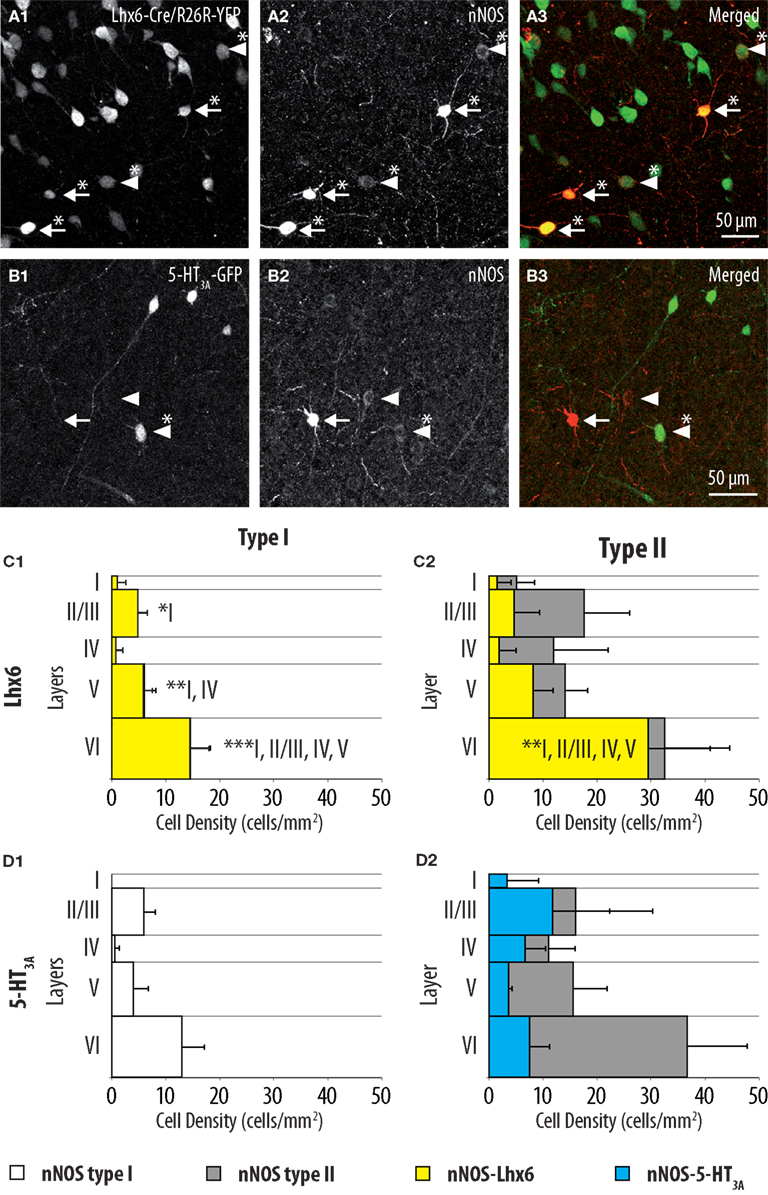
Figure 4. Distributions of GFP-expressing cells among type I and type II nNOS immunolabeled neurons in Lhx6-Cre/R26R-YFP and 5-HT3A:GFP mice. (A) Colocalization of GFP (1) with nNOS immunolabeling (2) in Lhx6-Cre/R26R-YFP. (B) Colocalization of GFP (1) with nNOS immunolabeling (2) in 5-HT3A:GFP mice. Arrows point to examples of type I (heavily labeled) nNOS-expressing neurons, arrowheads point to examples of type II nNOS (weakly labeled) expressing neurons. Double-labeled cells are marked by an asterisk. (C) Histograms reflecting the density of GFP-expressing type I (1) and type II (2) nNOS immunolabeled cells in cortical layer I–VI of Lhx6-Cre/R26R-YFP mice (yellow). (D) Histograms reflecting the density of GFP-expressing type I (1) and type II (2) nNOS immunolabeled cells in cortical layer I–VI of 5-HT3A:GFP mice (blue). In (C) and (D) the densities of nNOS type I (white) and nNOS type II (gray) neurons are superimposed (n = 3 mice; error bars: standard deviation; *, **, and *** indicate significant differences with p ≤ 0.05, p ≤ 0.01, and p ≤ 0.001, respectively; roman numerals refer to neocortical layers).
Discussion
In this study, we characterized neocortical nitrergic neurons using a multi-disciplinary approach combining immunohistochemical labeling of nNOS-expressing neurons and multiparametric analysis of nNOS transcribing neurons in acute slices of mouse somatosensory barrel cortex. We found that type I cells constitute a relatively homogeneous population of interneurons originating from MGE as a specific embryonic territory. In contrast, type II cells are divided into three interneuron subtypes originating from the MGE as well as the CGE-AEP/PO.
Characterization of Neocortical Nitrergic Interneurons
In the neocortex, as is apparent using immunohistochemistry or NADPH diaphorase immunoreactivity, nNOS concentrates in a sparse population of GABAergic neurons which subdivide in two subtypes: heavily labeled type I cells and lightly labeled type II cells (Yan et al., 1996; Yan and Garey, 1997; Smiley et al., 2000; Lee and Jeon, 2005). However, these nitrergic neurons remain poorly characterized (Kilduff et al., 2011). Although the molecular identity of types I nitrergic neurons has been well investigated in primate and rodents (Estrada and Defelipe, 1998), very few studies have characterized the expression of markers of interneurons in type II cells (Kubota et al., 2011). In addition, due to their paucity, electrophysiological recordings of nitrergic interneurons have rarely been achieved in brain slices (Cauli et al., 2004; Karagiannis et al., 2009). Therefore, our understanding of the neocortical mechanisms underlying NO release as a response to neuronal activity remains elusive.
In this study, the properties of type I and type II neocortical nitrergic interneurons were extensively characterized in the barrel cortex of juvenile (P14–17) mouse. Firstly, using nNOS immunohistochemistry in GAD67:GFP knock-in mice (Tamamaki et al., 2003), we described the laminar distribution of type I and type II nitrergic interneurons. Using double labeling immunohistochemistry, the molecular properties of the two classes of neurons was investigated by assessing their expression of PV, SOM, and VIP which constitute non-overlapping markers whose expression is restricted to specific interneuron populations (Kubota et al., 1994, 2011; Gonchar and Burkhalter, 1997; Gonchar et al., 2007; Xu et al., 2010). Secondly, we analyzed the properties of 42 interneurons expressing nNOS mRNA and characterized with patch-clamp recordings combined with biocytin labeling and scRT-PCR. This sample of cells was extracted from a dataset of more than 300 interneurons harvested in all layers of the barrel cortex (20 of the cells used in this study were also used in a previous report; Perrenoud et al., 2012). Unsupervised cluster analysis (see Materials and Methods and Perrenoud et al., 2012), disclosed four groups of nitrergic neurons exhibiting distinct electrophysiological, molecular, and morphological properties. Interestingly, by analyzing the laminar distribution and the molecular markers transcribed in these groups, each could be putatively related to type I or type II immunoreactivity. Finally, we provided insights into the embryonic origin of type I and type II nitrergic interneurons by using immunohistochemistry on two mouse strains (Lhx6-Cre/R26R-YFP and 5-HT3A:GFP) in which interneurons originating from specific regions of the embryonic subpallium are identified by GFP fluorescence (Du et al., 2008; Lee et al., 2010; Vucurovic et al., 2010).
Together these data provide a comprehensive characterization of neocortical nitrergic neurons. As detailed in the following section, the results generated using different approaches in this study were strikingly coherent and resulted in a consistent picture of the properties of type I and type II nNOS-expressing cells. Thus, we are confident that our results constitute an accurate description of the properties of nitrergic neurons in the barrel cortex of juvenile mouse.
Type I Interneurons are SOM-Expressing Cells Originating from the MGE
Type I nitrergic neurons are the object of considerable attention because of their unique properties. Firstly, though they are GABAergic (Valtschanoff et al., 1993), they differ from other neocortical inhibitory neurons in that they send long distance horizontal projections to remote neocortical areas (Tomioka et al., 2005; Higo et al., 2007, 2009; Tomioka and Rockland, 2007). Thus, although they constitute a subset of the so-called “neocortical interneurons,” type I nitrergic cells are not interneurons per se. Interestingly, it has also been recently demonstrated that type I neurons are specifically activated during a long period of slow wave sleep obtained after sleep deprivation (Gerashchenko et al., 2008; Kilduff et al., 2011).
Our study confirms and significantly improves current descriptions of type I nitrergic neocortical neurons. As reported in other studies, type I interneurons displayed intense nNOS immunoreactivities (Yan et al., 1996; Yan and Garey, 1997; Smiley et al., 2000; Lee and Jeon, 2005) and preferentially populated layer VI and V (Vercelli et al., 2000; Wiencken and Casagrande, 2000; Garbossa et al., 2001; Lee and Jeon, 2005). By comparison, they were less frequent in layer II/III and relatively infrequent in layers I and IV. Combined immunofluorescent labeling revealed that type I interneurons predominantly expressed SOM, confirming that they constitute a subset of SOM-expressing interneurons (Kubota et al., 1994, 2011; Smiley et al., 2000; Karagiannis et al., 2009). However, although rarely, PV immunoreactivity was detected in some type I cells, as reported in the mouse visual cortex (Lee and Jeon, 2005).
The electrophysiological properties of type I cells have been largely neglected due to the scarcity of these cells in the cortex (Kilduff et al., 2011). Here we performed unsupervised cluster analysis on a sample of interneurons expressing nNOS mRNA, disclosing a cluster of cells (Adapt-SOM) that likely correspond to type I interneurons. Indeed, these neurons were mainly recorded in deep layers and co-expressed SOM and NPY mRNAs well-matching with the features of type I cells (Kubota et al., 1994, 2011; Karagiannis et al., 2009). Putative type I cells displayed adapting discharges, fired long duration action potential spikes followed by fast AHPs and had significantly slower membrane time constant than other interneurons (Table 2). Type I cells had large somas (Table 6) and displayed an average of five primary dendrites (Table 7) which ramified into a wide arbor (Table 8). The axon of one putative type I cell could be satisfactorily reconstructed and appeared to ramify extensively within its layer of origin (Figure 3).
Finally, our study is, to our knowledge, the first attempt to provide indications about the embryonic origin of type I neurons. We found that all type I neurons were GFP labeled in Lhx6-Cre/R26R-YFP mice. As Lhx6 is a distinctive marker of the neurons originating from the MGE (Fogarty et al., 2007; Du et al., 2008), our results strongly suggest that type I neurons originate in this embryonic region. In agreement, we found that no type I nitrergic neurons expressed GFP in a 5-HT3A:GFP strain where fluorescence is found in neurons originating from the adjacent CGE and AEP/PO (Lee et al., 2010; Vucurovic et al., 2010). This finding is also in strong agreement with the notion that type I neurons constitute a subset of SOM-expressing GABAergic interneurons, since most originate in the MGE (Butt et al., 2005; Xu et al., 2005; Miyoshi et al., 2007; Wonders et al., 2008).
The features of type I interneurons appear well conserved across mammalian species (Yan and Garey, 1997; Franca et al., 2000). The morphology and the laminar distribution of type I neurons is consistent in rat (Gabbott and Bacon, 1995; Gabbott et al., 1997; Kubota et al., 2011), mouse (Lee and Jeon, 2005; present study), rabbit (Lee and Jeon, 2005), cat (Higo et al., 2007), monkey (Sandell, 1986; Smiley et al., 2000), and human (Judas et al., 1999). Similarly, SOM expression is a signature of type I nitrergic cells in rat (Vruwink et al., 2001; Kubota et al., 2011), monkey (Smiley et al., 2000), and human (Judas et al., 1999). Interestingly, type I nitrergic neurons also occur in substantial numbers in the subcortical white matter (Franca et al., 2000; Clancy et al., 2001). Thus, type I nitrergic neurons seem to be a ubiquitous and conserved feature of the mammalian cerebral cortex.
The consistent and comprehensive description of the properties of type I nitrergic cells provided in this study might prove useful to study the function of these neurons in the future. However, one should keep in mind that the features of type I neurons reported here might vary according to experimental conditions. Firstly, in rodents and primates, variations in neuronal density (Franca et al., 2000) and morphology (Freire et al., 2012) of type I neurons can occur between neocortical areas. Secondly, the features of type I neurons seem to be subjected to inter-species variations. For instance, type I cells do not express CB in rat (Gabbott et al., 1997) and human (Judas et al., 1999), while they express this marker in rabbit and mouse (Lee and Jeon, 2005; present study). More importantly, the modest expression of PV in type I cells which occurs in mouse (Lee and Jeon, 2005; present study) contrasts with data obtained in rat (Gabbott et al., 1997; Vruwink et al., 2001; Kubota et al., 2011), monkey (Smiley et al., 2000), and human (Judas et al., 1999) where type I cells only express SOM. This can give the impression that type I interneurons form two distinct classes in mouse. However, in our multiparametric analysis, the properties of PV expressing putative type I neurons were consistent with those of the other neurons of this cluster. Thus, we suggest that PV expression in mouse type I neurons is more likely to reflect intra-class variability. Further studies will be needed to explore whether variations in the properties of type I neurons translate functionally.
Type II Interneurons Represent a Heterogeneous Group of Cells
Type II cells have initially been described in the neocortex of many mammalian species especially in primate and human neocortex (Aoki et al., 1993; Hashikawa et al., 1994; Yan et al., 1996). Although early studies failed to detect type II neurons in rodents (Gabbott and Bacon, 1995; Yan and Garey, 1997; Oermann et al., 1999) recent reports have evidenced that they were also present in these species (Freire et al., 2005; Lee and Jeon, 2005). Studies have illustrated the functional importance of this class in the modulation of the vascular tone (Cauli et al., 2004). However, because of the difficulties of visualizing type II interneurons, the characterization of these cells has been neglected.
In this study, we characterized type II cells in the somatosensory cortex of mouse. With double immunolabeling, we found that a significant proportion of these cells were immunoreactive either for PV, SOM, or VIP. PV has previously been observed in some faintly stained nNOS-expressing cells in rat (Kubota et al., 2011). However, to our knowledge this is the first report of expression of SOM and VIP in type II nitrergic interneurons. Interestingly, PV and SOM immunoreactive type II cells were preferentially aggregated in deep neocortical layers while VIP immunoreactive type II neurons accumulated in layer II/III. Since PV, SOM, and VIP reportedly never co-express in the cortex of mouse (Xu et al., 2010), and their expression did not sum to the total density of type II nitrergic cells, our data also indicated that a substantial part of type II neurons do not express either of these markers. Therefore, our immunological data strongly suggested that in the barrel cortex of mouse, type II interneurons corresponded to a heterogeneous population comprised of distinct subgroups exhibiting particular laminar preferences.
Agreeing with this hypothesis, our multiparametric analysis disclosed three groups of cells that putatively corresponded to type II cells. The laminar distributions and the expression of PV, SOM, and VIP mRNAs of these three clusters appeared in strong agreement with results obtained at the protein level for type II neurons. The most prominent group; Adapt-NPY (n = 19) populated all layers and corresponded to small, neurogliaform-like interneurons which did not express PV, SOM, or VIP. Our data are thus consistent with previous findings indicating that neurogliaform cells constitute the main subset of type II cells (Karagiannis et al., 2009; Kubota et al., 2011). Consistent with immunohistochemical data, the two other groups corresponded to non-adapting neurons accumulating in deep layers and expressing PV or SOM (non-Ad-PV/SOM; n = 9), and to adapting bipolar neurons expressing VIP and CR, which were preferentially found in layer II/III (Adapt-VIP/CR; n = 7).
The relevance of these three groups of type II neurons was further strengthened by our developmental study. Consistent with the known origin of VIP/CR neurons in the CGE (Butt et al., 2005; Lee et al., 2010; Vucurovic et al., 2010), our data indicate that type II cells preferentially express the CGE-AEP/PO specific marker 5-HT3A in superficial layers. Conversely, in deep layers, type II neurons preferentially expressed Lhx6, consistent with the notion that PV and SOM-expressing neurons originate in the MGE (Butt et al., 2005; Xu et al., 2005; Miyoshi et al., 2007; Wonders et al., 2008). Finally, our data are consistent with the finding that neurogliaform cells can arise both in the MGE (Butt et al., 2005) and in the CGE (Lee et al., 2010; Vucurovic et al., 2010).
Thus, our study strongly suggests that type II neurons constitute a heterogeneous population of interneurons comprised of three classes: neurogliaforms expressing NPY, deep layers non-adapting cells expressing PV, or SOM and superficial bipolar cells expressing VIP/CR. Because of the consistency of our results, we are confident that the strategies employed here successfully disclosed the diversity of type II nitrergic interneurons in the neocortex of juvenile mouse. However, our data regarding type II interneurons display inconsistencies with data obtained in other cortical areas and animal models. Firstly, while we report that the densities of type I and type II cells are approximately equal in layer VI, another study performed in the visual cortex of mouse and rabbit found that type II cells were half as concentrated as type I cells in this layer (Lee and Jeon, 2005). Secondly, two previous studies performed in rat did not identify type II nitrergic interneurons expressing VIP or SOM at the histochemical level (Kubota et al., 2011) or in a similar multiparametric sample of interneurons (Karagiannis et al., 2009). Our finding regarding type II cells highlights further discrepancies with data obtained in primates. Indeed, we found that type II were about twofold more numerous than type I cells and populated all neocortical layers. By contrast, type II cells appeared about 20-fold more abundant than type I cells and exclusively located in supragranular layers in monkey (Yan et al., 1996; Yan and Garey, 1997; Smiley et al., 2000) and human (Judas et al., 1999). The molecular signature of type II cells also varies markedly in primates where they are characterized by the expression of CB but never express SOM or NPY (Smiley et al., 2000). Thus, this raises the intriguing possibility that type II cells might correspond to distinct cell types in different species.
Conclusion
In the CNS, NO modulates a wealth of functions ranging from synaptic plasticity and neuronal excitability to blood perfusion (Garthwaite, 2008). Among the three isoforms of NO synthase, nNOS is specifically expressed in neurons and thus provides a specific substrate enabling NO signaling to integrate changes of neuronal activity (Zhou and Zhu, 2009). The present study provides a comprehensive characterization of the properties of nNOS-expressing neurons in the barrel cortex of juvenile mouse. Our results indicate that nNOS is expressed in several classes of interneurons. These groups are likely to be differentially recruited by oncoming signals underlying specific epochs of neocortical processing (Burkhalter, 2008). Thus, our study indicates that NO signaling is coupled, in a complex manner, to a wide array of processes performed in the neocortical network.
Conflict of Interest Statement
The authors declare that the research was conducted in the absence of any commercial or financial relationships that could be construed as a potential conflict of interest.
Acknowledgments
This work was supported by ESPCI ParisTech, CNRS, and INSERM. Research in Nicoletta Kessaris’s laboratory is supported by the European Research Council (Grant 207807). We warmly thank Dr. Elisa L. Hill for her help with the writing of the manuscript, as well as Bastien Fournié for his precious help in the project.
References
Aoki, C., Fenstemaker, S., Lubin, M., and Go, C. G. (1993). Nitric oxide synthase in the visual cortex of monocular monkeys as revealed by light and electron microscopic immunocytochemistry. Brain Res. 620, 97–113.
Ascoli, G. A., Alonso-Nanclares, L., Anderson, S. A., Barrionuevo, G., Benavides-Piccione, R., Burkhalter, A., Buzsáki, G., Cauli, B., Defelipe, J., Fairén, A., Feldmeyer, D., Fishell, G., Fregnac, Y., Freund, T. F., Gardner, D., Gardner, E. P., Goldberg, J. H., Helmstaedter, M., Hestrin, S., Karube, F., Kisvárday, Z. F., Lambolez, B., Lewis, D. A., Marin, O., Markram, H., Muñoz, A., Packer, A., Petersen, C. C., Rockland, K. S., Rossier, J., Rudy, B., Somogyi, P., Staiger, J. F., Tamas, G., Thomson, A. M., Toledo-Rodriguez, M., Wang, Y., West, D. C., and Yuste, R. (2008). Petilla terminology: nomenclature of features of GABAergic interneurons of the cerebral cortex. Nat. Rev. Neurosci. 9, 557–568.
Bureau, I., von Saint, P. F., and Svoboda, K. (2006). Interdigitated paralemniscal and lemniscal pathways in the mouse barrel cortex. PLoS Biol. 4, e382. doi:10.1371/journal.pbio.0040382
Burkhalter, A. (2008). Many specialists for suppressing cortical excitation. Front. Neurosci. 2:2. doi:10.3389/neuro.01.026.2008
Butt, S. J., Fuccillo, M., Nery, S., Noctor, S., Kriegstein, A., Corbin, J. G., and Fishell, G. (2005). The temporal and spatial origins of cortical interneurons predict their physiological subtype. Neuron 48, 591–604.
Cauli, B., Audinat, E., Lambolez, B., Angulo, M. C., Ropert, N., Tsuzuki, K., Hestrin, S., and Rossier, J. (1997). Molecular and physiological diversity of cortical nonpyramidal cells. J. Neurosci. 17, 3894–3906.
Cauli, B., Porter, J. T., Tsuzuki, K., Lambolez, B., Rossier, J., Quenet, B., and Audinat, E. (2000). Classification of fusiform neocortical interneurons based on unsupervised clustering. Proc. Natl. Acad. Sci. U.S.A. 97, 6144–6149.
Cauli, B., Tong, X. K., Rancillac, A., Serluca, N., Lambolez, B., Rossier, J., and Hamel, E. (2004). Cortical GABA interneurons in neurovascular coupling: relays for subcortical vasoactive pathways. J. Neurosci. 24, 8940–8949.
Clancy, B., Silva-Filho, M., and Friedlander, M. J. (2001). Structure and projections of white matter neurons in the postnatal rat visual cortex. J. Comp. Neurol. 434, 233–252.
Dawson, T. M., Bredt, D. S., Fotuhi, M., Hwang, P. M., and Snyder, S. H. (1991). Nitric oxide synthase and neuronal NADPH diaphorase are identical in brain and peripheral tissues. Proc. Natl. Acad. Sci. U.S.A. 88, 7797–7801.
Dawson, V. L., and Dawson, T. M. (1998). Nitric oxide in neurodegeneration. Prog. Brain Res. 118, 215–229.
Douketis, C., Wang, Z., Haslett, T. L., and Moskovits, M. (1995). Fractal character of cold-deposited silver films determined by low-temperature scanning tunneling microscopy. Phys. Rev. B Condens. Matter 51, 11022–11031.
Du, T., Xu, Q., Ocbina, P. J., and Anderson, S. A. (2008). NKX2.1 specifies cortical interneuron fate by activating Lhx6. Development 135, 1559–1567.
Dumitriu, D., Cossart, R., Huang, J., and Yuste, R. (2007). Correlation between axonal morphologies and synaptic input kinetics of interneurons from mouse visual cortex. Cereb. Cortex 17, 81–91.
Estrada, C., and Defelipe, J. (1998). Nitric oxide-producing neurons in the neocortex: morphological and functional relationship with intraparenchymal microvasculature. Cereb. Cortex 8, 193–203. doi:10.3389/neuro.05.003.2007
Flames, N., Pla, R., Gelman, D. M., Rubenstein, J. L., Puelles, L., and Marin, O. (2007). Delineation of multiple subpallial progenitor domains by the combinatorial expression of transcriptional codes. J. Neurosci. 27, 9682–9695.
Fogarty, M., Grist, M., Gelman, D., Marin, O., Pachnis, V., and Kessaris, N. (2007). Spatial genetic patterning of the embryonic neuroepithelium generates GABAergic interneuron diversity in the adult cortex. J. Neurosci. 27, 10935–10946.
Franca, J. G., Volchan, E., Jain, N., Catania, K. C., Oliveira, R. L., Hess, F. F., Jablonka, M., Rocha-Miranda, C. E., and Kaas, J. H. (2000). Distribution of NADPH-diaphorase cells in visual and somatosensory cortex in four mammalian species. Brain Res. 864, 163–175.
Freire, M. A., Faber, J., Picanco-Diniz, C. W., Franca, J. G., and Pereira, A. (2012). Morphometric variability of nicotinamide adenine dinucleotide phosphate diaphorase neurons in the primary sensory areas of the rat. Neuroscience 205, 140–153.
Freire, M. A., Franca, J. G., Picanco-Diniz, C. W., and Pereira, A. Jr. (2005). Neuropil reactivity, distribution and morphology of NADPH diaphorase type I neurons in the barrel cortex of the adult mouse. J. Chem. Neuroanat. 30, 71–81.
Gabbott, P. L., and Bacon, S. J. (1995). Co-localisation of NADPH diaphorase activity and GABA immunoreactivity in local circuit neurones in the medial prefrontal cortex (mPFC) of the rat. Brain Res. 699, 321–328.
Gabbott, P. L., Dickie, B. G., Vaid, R. R., Headlam, A. J., and Bacon, S. J. (1997). Local-circuit neurones in the medial prefrontal cortex (areas 25, 32 and 24b) in the rat: morphology and quantitative distribution. J. Comp. Neurol. 377, 465–499.
Gallopin, T., Geoffroy, H., Rossier, J., and Lambolez, B. (2006). Cortical sources of CRF, NKB, and CCK and their effects on pyramidal cells in the neocortex. Cereb. Cortex 16, 1440–1452.
Garbossa, D., Fontanella, M., Pagni, C. A., and Vercelli, A. (2001). Nitric oxide synthase and cytochrome c oxidase changes in the tumoural and peritumoural cerebral cortex. Acta Neurochir. (Wien) 143, 897–908.
Garthwaite, J. (2008). Concepts of neural nitric oxide-mediated transmission. Eur. J. Neurosci. 27, 2783–2802.
Garthwaite, J., and Boulton, C. L. (1995). Nitric oxide signaling in the central nervous system. Annu. Rev. Physiol. 57, 683–706.
Gelman, D. M., and Marin, O. (2010). Generation of interneuron diversity in the mouse cerebral cortex. Eur. J. Neurosci. 31, 2136–2141.
Gerashchenko, D., Wisor, J. P., Burns, D., Reh, R. K., Shiromani, P. J., Sakurai, T., de la Iglesia, H. O., and Kilduff, T. S. (2008). Identification of a population of sleep-active cerebral cortex neurons. Proc. Natl. Acad. Sci. U.S.A. 105, 10227–10232.
Gonchar, Y., and Burkhalter, A. (1997). Three distinct families of GABAergic neurons in rat visual cortex. Cereb. Cortex 7, 347–358.
Gonchar, Y., Wang, Q., and Burkhalter, A. (2007). Multiple distinct subtypes of GABAergic neurons in mouse visual cortex identified by triple immunostaining. Front. Neuroanat. 1:3.
Hashikawa, T., Leggio, M. G., Hattori, R., and Yui, Y. (1994). Nitric oxide synthase immunoreactivity colocalized with NADPH-diaphorase histochemistry in monkey cerebral cortex. Brain Res. 641, 341–349.
Higo, S., Akashi, K., Sakimura, K., and Tamamaki, N. (2009). Subtypes of GABAergic neurons project axons in the neocortex. Front. Neuroanat. 3:25. doi:10.3389/neuro.05.025.2009
Higo, S., Udaka, N., and Tamamaki, N. (2007). Long-range GABAergic projection neurons in the cat neocortex. J. Comp. Neurol. 503, 421–431.
Iadecola, C., Beitz, A. J., Renno, W., Xu, X., Mayer, B., and Zhang, F. (1993). Nitric oxide synthase-containing neural processes on large cerebral arteries and cerebral microvessels. Brain Res. 606, 148–155.
Judas, M., Sestan, N., and Kostovic, I. (1999). Nitrinergic neurons in the developing and adult human telencephalon: transient and permanent patterns of expression in comparison to other mammals. Microsc. Res. Tech. 45, 401–419.
Karagiannis, A., Gallopin, T., David, C., Battaglia, D., Geoffroy, H., Rossier, J., Hillman, E. M. C., Staiger, J. F., and Cauli, B. (2009). Classification of NPY-expressing neocortical interneurons. J. Neurosci. 29, 3642–3659.
Kilduff, T. S., Cauli, B., and Gerashchenko, D. (2011). Activation of cortical interneurons during sleep: an anatomical link to homeostatic sleep regulation? Trends Neurosci. 34, 10–19.
Kiss, J. P. (2000). Role of nitric oxide in the regulation of monoaminergic neurotransmission. Brain Res. Bull. 52, 459–466.
Kawaguchi, Y. (1995). Physiological subgroups of nonpyramidal cells with specific morphological-characteristics in layer II/III of rat frontal cortex. J. Neurosci. 15, 2638–2655.
Kubota, Y., Hattori, R., and Yui, Y. (1994). Three distinct subpopulations of GABAergic neurons in rat frontal agranular cortex. Brain Res. 649, 159–173.
Kubota, Y., Shigematsu, N., Karube, F., Sekigawa, A., Kato, S., Yamaguchi, N., Hirai, Y., Morishima, M., and Kawaguchi, Y. (2011). Selective coexpression of multiple chemical markers defines discrete populations of neocortical GABAergic neurons. Cereb. Cortex 21, 1803–1817.
Lambolez, B., Audinat, E., Bochet, P., Crepel, F., and Rossier, J. (1992). AMPA receptor subunits expressed by single Purkinje cells. Neuron 9, 247–258.
Lee, J. E., and Jeon, C. J. (2005). Immunocytochemical localization of nitric oxide synthase-containing neurons in mouse and rabbit visual cortex and co-localization with calcium-binding proteins. Mol. Cells 19, 408–417.
Lee, S., Hjerling-Leffler, J., Zagha, E., Fishell, G., and Rudy, B. (2010). The largest group of superficial neocortical GABAergic interneurons expresses ionotropic serotonin receptors. J. Neurosci. 30, 16796–16808.
McGarry, L. M., Packer, A. M., Fino, E., Nikolenko, V., Sippy, T., and Yuste, R. (2010). Quantitative classification of somatostatin-positive neocortical interneurons identifies three interneuron subtypes. Front. Neural Circuits 4:12. doi:10.3389/fncir.2010.00012
Miyoshi, G., Butt, S. J., Takebayashi, H., and Fishell, G. (2007). Physiologically distinct temporal cohorts of cortical interneurons arise from telencephalic Olig2-expressing precursors. J. Neurosci. 27, 7786–7798.
Moro, V., Badaut, J., Springhetti, V., Edvinsson, L., Seylaz, J., and Lasbennes, F. (1995). Regional study of the co-localization of neuronal nitric oxide synthase with muscarinic receptors in the rat cerebral cortex. Neuroscience 69, 797–805.
Oermann, E., Bidmon, H. J., Mayer, B., and Zilles, K. (1999). Differential maturational patterns of nitric oxide synthase-I and NADPH diaphorase in functionally distinct cortical areas of the mouse cerebral cortex. Anat. Embryol. 200, 27–41.
Paxinos, G., and Franklin, K. B. J. (2001). The Mouse Brain in Stereotaxic Coordinates. San Diego: Elsevier.
Perrenoud, Q., Rossier, J., Geoffroy, H., Vitalis, T., and Gallopin, T. (2012). Diversity of GABAergic interneurons in layer VIa and VIb of mouse barrel cortex. Cereb. Cortex. PMID:22357664, [Epub ahead of print].
Rancillac, A., and Crepel, F. (2004). Synapses between parallel fibres and stellate cells express long-term changes in synaptic efficacy in rat cerebellum. J. Physiol. (Lond.) 554, 707–720.
Rancillac, A., Rossier, J., Guille, M., Tong, X. K., Geoffroy, H., Amatore, C., Arbault, S., Hamel, E., and Cauli, B. (2006). Glutamatergic control of microvascular tone by distinct GABA neurons in the cerebellum. J. Neurosci. 26, 6997–7006.
Sandell, J. H. (1986). NADPH diaphorase histochemistry in the macaque striate cortex. J. Comp. Neurol. 251, 388–397.
Sholl, D. A. (1953). Dendritic organization in the neurons of the visual and motor cortices of the cat. J. Anat. 87, 387–406.
Smiley, J. F., McGinnis, J. P., and Javitt, D. C. (2000). Nitric oxide synthase interneurons in the monkey cerebral cortex are subsets of the somatostatin, neuropeptide Y, and calbindin cells. Brain Res. 863, 205–212.
Tamamaki, N., Yanagawa, Y., Tomioka, R., Miyazaki, J., Obata, K., and Kaneko, T. (2003). Green fluorescent protein expression and colocalization with calretinin, parvalbumin, and somatostatin in the GAD67-GFP knock-in mouse. J. Comp. Neurol. 467, 60–79.
Tamas, G., Buhl, E. H., and Somogyi, P. (1997). Fast IPSPs elicited via multiple synaptic release sites by different types of GABAergic neurone in the cat visual cortex. J. Physiol. (Lond.) 500(Pt 3), 715–738.
Tomioka, R., Okamoto, K., Furuta, T., Fujiyama, F., Iwasato, T., Yanagawa, Y., Obata, K., Kaneko, T., and Tamamaki, N. (2005). Demonstration of long-range GABAergic connections distributed throughout the mouse neocortex. Eur. J. Neurosci. 21, 1587–1600.
Tomioka, R., and Rockland, K. S. (2007). Long-distance corticocortical GABAergic neurons in the adult monkey white and gray matter. J. Comp. Neurol. 505, 526–538.
Tsuzuki, K., Lambolez, B., Rossier, J., and Ozawa, S. (2001). Absolute quantification of AMPA receptor subunit mRNAs in single hippocampal neurons. J. Neurochem. 77, 1650–1659.
Valtschanoff, J. G., Weinberg, R. J., Kharazia, V. N., Schmidt, H. H., Nakane, M., and Rustioni, A. (1993). Neurons in rat cerebral cortex that synthesize nitric oxide: NADPH diaphorase histochemistry, NOS immunocytochemistry, and colocalization with GABA. Neurosci. Lett. 157, 157–161.
Vercelli, A., Garbossa, D., Biasiol, S., Repici, M., and Jhaveri, S. (2000). NOS inhibition during postnatal development leads to increased ipsilateral retinocollicular and retinogeniculate projections in rats. Eur. J. Neurosci. 12, 473–490.
Vitalis, T., and Rossier, J. (2011). New insights into cortical interneurons development and classification: contribution of developmental studies. Dev. Neurobiol. 71, 34–44.
Vruwink, M., Schmidt, H. H., Weinberg, R. J., and Burette, A. (2001). Substance P and nitric oxide signaling in cerebral cortex: anatomical evidence for reciprocal signaling between two classes of interneurons. J. Comp. Neurol. 441, 288–301.
Vucurovic, K., Gallopin, T., Ferezou, I., Rancillac, A., Chameau, P., van Hooft, J. A., Geoffroy, H., Monyer, H., Rossier, J., and Vitalis, T. (2010). Serotonin 3A receptor subtype as an early and protracted marker of cortical interneuron subpopulations. Cereb. Cortex 20, 2333–2347.
Ward, J. H. (1963). Hierarchical grouping to optimize an objective function. J. Am. Stat. Assoc. 58, 236–244.
Wiencken, A. E., and Casagrande, V. A. (2000). The distribution of NADPH diaphorase and nitric oxide synthetase (NOS) in relation to the functional compartments of areas V1 and V2 of primate visual cortex. Cereb. Cortex 10, 499–511.
Wonders, C. P., and Anderson, S. A. (2006). The origin and specification of cortical interneurons. Nat. Rev. Neurosci. 7, 687–696.
Wonders, C. P., Taylor, L., Welagen, J., Mbata, I. C., Xiang, J. Z., and Anderson, S. A. (2008). A spatial bias for the origins of interneuron subgroups within the medial ganglionic eminence. Dev. Biol. 314, 127–136.
Xu, Q., Wonders, C. P., and Anderson, S. A. (2005). Sonic hedgehog maintains the identity of cortical interneuron progenitors in the ventral telencephalon. Development 132, 4987–4998.
Xu, X., Roby, K. D., and Callaway, E. M. (2010). Immunochemical characterization of inhibitory mouse cortical neurons: three chemically distinct classes of inhibitory cells. J. Comp. Neurol. 518, 389–404.
Yan, X. X., and Garey, L. J. (1997). Morphological diversity of nitric oxide synthesising neurons in mammalian cerebral cortex. J. Hirnforsch. 38, 165–172.
Yan, X. X., Jen, L. S., and Garey, L. J. (1996). NADPH-diaphorase-positive neurons in primate cerebral cortex colocalize with GABA and calcium-binding proteins. Cereb. Cortex 6, 524–529.
Keywords: Immunohistochemistry, patch-clamp, development, nitric oxide, parvalbumin, somatostatin, vasointestinal peptide, neuropeptide Y
Citation: Perrenoud Q, Geoffroy H, Gauthier B, Rancillac A, Alfonsi F, Kessaris N, Rossier J, Vitalis T and Gallopin T (2012) Characterization of type I and type II nNOS-expressing interneurons in the barrel cortex of mouse. Front. Neural Circuits 6:36. doi: 10.3389/fncir.2012.00036
Received: 28 March 2012; Paper pending published: 16 April 2012;
Accepted: 31 May 2012; Published online: 29 June 2012.
Edited by:
Bruno Cauli, University Pierre et Marie Curie, FranceReviewed by:
Kathleen S. Rockland, Massachusetts Institute of Technology, USAThomas Kilduff, Stanford Research Institute International, USA
Copyright: © 2012 Perrenoud, Geoffroy, Gauthier, Rancillac, Alfonsi, Kessaris, Rossier, Vitalis and Gallopin. This is an open-access article distributed under the terms of the Creative Commons Attribution Non Commercial License, which permits non-commercial use, distribution, and reproduction in other forums, provided the original authors and source are credited.
*Correspondence: Thierry Gallopin, Laboratoire de Neurobiologie, CNRS UMR 7637, ESPCI ParisTech, University Pierre et Marie Curie, 10 rue Vauquelin, 75005 Paris, France. e-mail: thierry.gallopin@espci.fr
†Tania Vitalis and Thierry Gallopin have contributed equally to this work.