


Abstract
The Allen Brain Atlas (http://www.brain-map.org) provides a unique online public resource integrating extensive gene expression data, connectivity data and neuroanatomical information with powerful search and viewing tools for the adult and developing brain in mouse, human and non-human primate. Here, we review the resources available at the Allen Brain Atlas, describing each product and data type [such as in situ hybridization (ISH) and supporting histology, microarray, RNA sequencing, reference atlases, projection mapping and magnetic resonance imaging]. In addition, standardized and unique features in the web applications are described that enable users to search and mine the various data sets. Features include both simple and sophisticated methods for gene searches, colorimetric and fluorescent ISH image viewers, graphical displays of ISH, microarray and RNA sequencing data, Brain Explorer software for 3D navigation of anatomy and gene expression, and an interactive reference atlas viewer. In addition, cross data set searches enable users to query multiple Allen Brain Atlas data sets simultaneously. All of the Allen Brain Atlas resources can be accessed through the Allen Brain Atlas data portal.
INTRODUCTION
At the intersection of modern neuroscience and genetics, the underlying molecular architecture of cell type or disease-associated changes in gene regulation is key to developing and testing new hypotheses for understanding normal brain function and ultimately developing therapies for neurological disorders and disease. The genome sequences of the mouse (1) and human (2) provide a strong foundation to identify key genes for brain development and function. An important and obvious next step is to characterize the transcriptome to identify genes active in different tissues or cell types. The brain is the most complex organ in the body, consisting of a carefully structured arrangement of hundreds of cell types, and thus, the simple characterization of a whole-brain transcriptome provides limited utility. Instead, understanding the transcriptomic profile of specific neuroanatomic regions with as much cellular resolution as possible is essential to dissect the molecular underpinnings of brain function.
The compendium of related resources known collectively as the Allen Brain Atlas began initially with the Allen Institute for Brain Science’s inaugural project, the Allen Mouse Brain Atlas, which was completed in 2006 (3). This genome-wide survey of gene expression in the adult mouse brain consisted of high-resolution image data of in situ hybridization (ISH) for ∼20 000 genes, with an accompanying powerful informatics pipeline to provide automated registration of the images to a 3D model of the adult mouse brain and allowing quantification and analysis of gene expression in a comprehensive neuroanatomical framework. The Allen Mouse Brain Atlas provides an initial transcriptomic profile with cellular resolution for the adult mouse brain, an important foundation for research using the popular mouse model. Since then, additional data sets have been added to include multiple species and stages of development, working toward the same mission to provide a foundation for neuroscience discovery, integrating this data for ease of access and navigability. Toward this end, we have continued to provide upgrades and standardization of the user interface, translating the utility of tools developed for one atlas into functionally equivalent tools for other atlases, and working toward integration of the data for more sophisticated data mining across time, species and projects.
RESULTS
Resource overview
The Allen Brain Atlas resources are a growing collection of online public data sets integrating extensive gene expression, connectivity and neuroanatomical data complete with a novel suite of search and viewing tools (Table 1). The Allen Brain Atlas data portal (http://www.brain-map.org) provides access to each of these data sets. Key features of the data portal include Announcements (latest updates, upcoming events and training, and how to connect with us), Tutorials (library of short video tutorials demonstrating different aspects of using the Allen Brain Atlas resources), Data Highlights (a new image displayed daily to highlight interesting data from the entire data set) and a Site Search (a way to search across the entire data set suite).
Major public resources of Allen Brain Atlas data portal
| Public resource | Species | Age | Key features | Histology | AGEA | NeuroBlast, Find Correlates | Brain Explorer | Microarray | RNA sequencing | Reference atlas | Imaging | Connectivity |
|---|---|---|---|---|---|---|---|---|---|---|---|---|
| Allen Mouse Brain Atlas | Mouse | P56 | Image-based ISH data with genome-wide coverage. Anatomic coverage across the entire brain. Spatially mapped and quantified expression to enable search and visualization. | CISH Nissl | Y | Y | Y | Y | ||||
| Allen Developing Mouse Brain Atlas | Mouse | E11.5, E13.5, E15.5, E18.5, P4, P14, P28, >18 months | Image-based ISH data for ∼2000 genes. Anatomic coverage across the entire brain. Spatially mapped and quantified expression to enable search and visualization. | CISH Nissl | Y | Y | Y | Y | ||||
| Allen Mouse Brain Connectivity Atlas | Mouse | P56a | Projection mapping image data detailing axonal projections labeled by viral tracers and visualized using serial two-photon tomography. BDA versus AAV for comparing conventional and viral tracing methods. Transgenic characterization data detailing transgene expression in Cre or other driver lines. Anatomic Reference with histological and IHC stains. | CISH DFISH Nissl | Y | Y | ||||||
| Allen Spinal Cord Atlas | Mouse | P4, P56 | Image-based ISH data with genome-wide coverage. Anatomic coverage across full length of the spinal cord. Search by gene, age or expression categories. Nissl and AChE reference stains for P4 and P56. | CISH Nissl AChE | Y | |||||||
| Allen Human Brain Atlas | Human | 18–60 years | Spatially mapped microarray data from multiple adult control brains. Approximately 500 samples per hemisphere (cerebrum, CB, and BS). Integrated MRI, histology, and microarray data. Anatomic and gene-based search. ISH for selected genes in specific brain regions | CISH Nissl SMI-32 | Y | Y | Y | MRI | ||||
| BrainSpan Atlas of the Developing Human Brain | Human | 4 pcw to 60 years | Developmental gene expression survey in specific brain regions using RNA-sequencing and exon microarray. Transcriptional profiling spanning the entire prenatal human brain from laser microdissection-based sample isolation and microarrays. ISH in specific brain regions in developing and adult brain. Neuroimaging and histological reference atlases for some developmental stages. | CISH Nissl AChE Parv SMI-32 | Y | Y | Y | Y | MRI, DWI | |||
| Ivy Glioblastoma Atlas | Human tumor | NA | ISH data across anatomic structures inherent in glioblastoma. Histological data suitable for neuropathological examination. | CISH H & E | MRI | |||||||
| NIH Blueprint NHP Atlas | Macaque | 0, 3, 12 and 48 months | Cellular resolution distributions of functionally important and anatomically restricted mRNA transcripts using ISH. Genome-wide transcriptional profiling of specific brain regions and functional subdivisions of these regions using laser microdissection. Developmental reference series consisting of MRI and Nissl histology. | CISH Nissl AChE SMI-32 | Y | Y | MRI |
aVariable ages close to P56.
AAV, adeno-associated virus; AChE, acetylcholinesterase; AGEA, Anatomic Gene Expression Atlas; BDA, biotinylated dextran amine; BS, brain stem; CB, cerebellum; DFISH, double fluorescent in situ hybridization; DTI, diffusion tensor imaging; DWI, diffusion weighted MRI; E, embryonic; H & E, hematoxylin and eosin; IHC, immunohistochemical; NA, not applicable; P, postnatal; Parv, parvalbumin; pcw (post conception weeks), Y, yes.
Accessible from the data portal are the major mouse resources: the Allen Mouse Brain Atlas, the Allen Developing Mouse Brain Atlas and the Allen Mouse Brain Connectivity Atlas. The Allen Mouse Brain Atlas (3,4), the original Allen Brain Atlas resource, is a genome-wide 3D map of gene expression throughout the adult mouse brain that comprises high-resolution images that reveal where each gene is expressed in the adult mouse brain, as well as an integrated suite of sophisticated data search and visualization tools (5–8). The Allen Developing Mouse Brain Atlas provides a detailed map of how genes change during the development of the brain and provides a framework to explore both when and where genes are activated in the mouse brain across the life span, from embryo through old age. The Allen Mouse Brain Connectivity Atlas is a high-resolution map of neural connections in the mouse brain. Built on an array of transgenic mice genetically engineered to target specific cell types (9), the Allen Mouse Brain Connectivity Atlas comprises a unique compendium of projections from selected neuronal populations throughout the brain. Featuring projection mapping and transgenic characterization, along with anatomic reference data, the Allen Mouse Brain Connectivity Atlas complements the Allen Institute’s gene expression atlases and thus provides opportunities to help understand how genes contribute to connectivity formation and function.
In addition to the mouse model, human and non-human primate data sets are available via the Allen Brain Atlas portal. The Allen Human Brain Atlas is a unique multi-modal atlas that maps gene expression across the adult human brain (10). Integrating anatomic and genomic information, available data modalities include magnetic resonance imaging (MRI), diffusion tensor imaging, histology and gene expression data derived from both microarray and ISH approaches. The BrainSpan Atlas of the Developing Human Brain is a unique resource for studying human brain development, providing a broad and detailed anatomical analysis of gene expression across human brain development, comprising ISH, RNA sequencing and microarray data, along with supporting neuroanatomical reference content. This data set is accessible via the Allen Brain Atlas data portal or directly at http://www.developinghumanbrain.org/ or http://www.brainspan.org. The National Institutes of Health (NIH) Blueprint Non-Human Primate Atlas offers gene expression in the developing rhesus macaque brain. This atlas aims to create a developmental neuroanatomical framework for exploring the cellular and molecular architecture of the developing non-human primate brain, with direct relevance for human brain development. This resource is accessible via the Allen Brain Atlas data portal or directly at http://www.blueprintnhpatlas.org.
Related resources available from the portal include additional tissues, mouse strains and behavioral conditions. The Allen Spinal Cord Atlas is a unique genome-wide map of gene expression across all anatomic segments of the mouse spinal cord from neonate to adult. This comprehensive application detailing gene activity in the normal spinal cord provides an essential baseline for understanding how the spinal cord is altered in disease or injury. The Ivy Glioblastoma Atlas Project is a unique platform for exploring the anatomic and genetic basis of glioblastoma at cellular and molecular levels, and includes cellular resolution ISH data mapping gene expression across pathologically defined structures inherent in glioblastoma, as well as associated histological data suitable for neuropathological examination. A companion database, available at http://www.ivygap.org, developed by project partners at the Ben and Catherine Ivy Center for Advanced Brain Tumor Treatment, provides additional clinical and genomic data. The Mouse Diversity Study characterizes gene expression across genetic backgrounds and sex, expanding beyond the adult male C57BL/6J reference brain comprising the Allen Mouse Brain Atlas to include seven strains of male mice and female C57BL/6J mice at three stages of estrus (11). This Mouse Diversity Study allows for simultaneous navigation and comparison of different mouse brains at high resolution, providing users with a data set to probe for possible differences in gene regulation. The Sleep Study has generated a collection of cellular resolution and microarray data for gene expression in the mouse brain in response to sleep deprivation and time-of-day examining five experimental conditions in mice (12).
Even though there are a diversity of data sets available transcending development across different species (mouse, human and rhesus macaque), commonalities in the systematic data generation and data types (particularly ISH, microarray and reference atlases) have enabled the usage of standardized user interfaces and visualization tools across these resources.
Feature standardization
With a diverse portfolio of data sources within the Allen Brain Atlas, providing the user with a standardized framework and user interface is essential to streamline the user experience between Allen Brain Atlas resources. Atlases with similar data modalities use equivalent interfaces to navigate, mine and display the data (Table 1). Furthermore, features developed to serve a particular purpose in one atlas may be applicable to increase the usability of another atlas. The next section discusses some of the standardized features that are available in the different atlases. This standardization enables the projects to be readily interconnected, searched and mined.
Searching the data
Search functionalities form the foundation to mine the Allen Brain Atlas data. In the major mouse and human data sets, there are two main search entry points—gene and anatomy based. The Gene Search allows searching for specific gene(s) of interest, while the anatomy-based searches (Differential and Anatomic) provide the ability to search based on structure(s) of interest. Once the gene with the expression pattern of interest is found, a third advanced Correlative Search allows mining for additional genes with similar expression patterns.
Gene Search
The core search available for every data set is a direct Gene Search for ISH, microarray and RNA sequencing data. For ISH data and transcriptome data (microarray and RNA sequencing), gene expression data can be searched using specific gene symbols, gene names or Entrez Gene IDs (13). In the Gene Search, a list of suggestions is displayed showing all genes with expression data that match the query. There are slight variations on this basic search option in the different Allen Brain Atlas data sets, as some allow the user to search using NCBI accession numbers. Genes can also be navigated through a browse feature, organized either alphabetically or by gene ontology or class.
Differential Search
A Differential Search is one method that enables users to identify relevant genes for a particular brain structure or area. Differential Search finds genes with enhanced expression in one or more brain regions in contrast to one or more different brain regions. The target structure(s) and contrast structure(s) are entered, and a list of genes with enhanced expression in the regions that match the query is displayed. Various metadata are displayed with the search return, including fold change, gene information [gene symbol, gene name, probe name and expression summary (where applicable)] and links to the primary data. Differential Search is an on-the-fly search service. For ISH Differential Search, calculations over all experiments for a particular atlas are computed as fold change using expression data from one hemisphere. The ISH Differential Search service is derived from a fully automated processing pipeline, the results of which have been subjected to manual curation to remove major processing artifacts. For microarray or RNA sequencing data, Differential Search results are sorted either by P-value or fold change, depending on the user selection.
Correlate Gene Search
In mining gene expression databases, a ‘search by example’ feature is highly desirable, as genes with similar expression patterns may be related in function (14). This type of search is available for ISH data and transcriptome data (microarray or RNA sequencing). For ISH data, this search is referred to as a NeuroBlast search, a name chosen in reference to the Basic Local Alignment Search Tool available for analysis of sequence homology (15). In NeuroBlast, expression data for each gene is quantified across a voxel grid representing the 3D brain, and the Pearson’s correlation between pairs of genes is computed to identify genes with the highest similarity by spatial expression profile, such that a user can enter a seed gene to find genes with similar expression profiles across a selected subset of voxels (5). Similarly, the Find Correlates search utility for microarray and RNA sequencing data is also a ‘search by example’. Once a gene of interest has been identified, to find other genes with spatial expression profiles similar to the gene of interest, brain structure(s) are selected in which one would like to see a similar expression pattern, and Find Correlates is selected. This action returns probes with a similar expression profile in the selected brain region(s). ‘Anti-correlated’ returns can also be visualized, which include genes with the opposite expression pattern. For example in BrainSpan Atlas of the Developing Human Brain, if Find Correlates with the gene PVALB (parvalbumin) is selected in the Developmental Transcriptome data, the returns show genes with high expression post birth and low expression during prenatal development. By toggling the search results in column r, the ‘anti-correlated’ results are displayed, in which genes have high expression during prenatal development and lower expression post birth (the opposite expression pattern of PVALB).
Heat map presentation of transcriptome data
Products with microarray and RNA sequencing data (Table 1) have three types of searches to allow a user to: (i) obtain gene expression data for specific genes (or probes) of interest (Gene Search); (ii) compare expression between different anatomic regions (Differential Search); and (iii) use a ‘seed’ gene to find other genes with similar expression patterns (Find Correlates). Each of these types of searches has been described earlier.
For microarray data with the Gene Search, the resulting microarray data sets are presented as a matrix with brain structure (by individual donor) on the horizontal x-axis and gene probes on the vertical y-axis. Because multiple probes are used to measure gene expression for an individual gene, search returns are reported by probe rather than by gene. The microarray data is presented in a ‘heat map’ format, where the colors of the heat map correspond either to log2 or z-score expression level of a probe. Brain structures are organized such that moving left to right on the x-axis is analogous to moving from anterior to posterior first in the cortical areas, followed by subcortical areas, cerebellum and then brain stem.
The heat map is a visualization of the microarray values for the returned probes of interest. Each row of the heat map represents a probe. Each column of the heat map either represents a tissue sample or an anatomical brain structure, depending on the selected resolution. The colors of the heat map are normalized expression values. Default heat map colors are in the green-red scale, where the color green should be interpreted as relatively low expression and red as relatively high expression within the scope of each probe. The color scheme for the heat map can be changed to display different normalized (z-score) color representations of the heat map data (i.e. blue-red versus green-red) or a log2 normalized expression map. Clicking on a cell of the heat map brings up detailed information in the area above the heat map about the sampled anatomical structure, gene symbol, gene name, probe name, the log2 expression value and z-score and links to related data in other Allen Brain Atlas resources. Data from multiple brains may be viewed in two ways. By default, columns are grouped first by donors and then by structures, allowing one to compare the full expression profiles of individual brains side-by-side. Grouping the columns by structures and then by donors allows one to view the data for each brain structure with data from all donors grouped together under that structure.
Additional functionality in the heat map is available for the Allen Human Brain Atlas. Three resolution options to view microarray gene expression data with the heat map are available: Coarse, Structures and Samples. If ‘Samples’ is selected, there is a one-to-one correspondence between a column and a physical tissue sample. In the Allen Human Brain Atlas, there are typically multiple samples for each structure of interest. This oversampling may provide information on variability and spatial gradients. In ‘Structures’ mode, all samples belonging to the same designated structure are combined and averaged together. In ‘Coarse’ mode, the brain is divided into ∼20 large neuroanatomical divisions or regions (e.g. frontal lobe, occipital lobe, striatum, dorsal thalamus and ventral thalamus). Samples within each partition are averaged together to provide a summary value for the partition.
Other features in the heat map available for the Allen Human Brain Atlas include a link to the Brain Explorer® software for viewing the Allen Human Brain Atlas gene expression data in 3D. Also, a multi-planar viewer shows the expression profile for the selected probe in the context of the donor brain. The multi-planar viewer illustrates sampling sites for microarray data and indicates gene expression levels for a single probe in coronal, sagittal and horizontal sections of MRI space for a given specimen. Additional viewing frames show spatially correspondent histological data at the tissue slab and tissue block levels with anatomic annotations and specific delineations of sampling sites for microarray data generation. Points from which microarray tissue samples are taken are colored to show expression level, according to the active color map.
For the Allen Human Brain Atlas, the microarray gene detail page presents information about the gene, including the gene name, aliases, organism, related data from other Allen Brain Atlas resources, Entrez Gene ID and chromosome. A gene expression heat map listing every probe for this gene is also included. Clicking on a specific probe in the heat map will bring up probe metadata, including the probe name, NCBI accession number, sequence length, probe sequence, probe type, transcript GenInfo Identifier (GI) and guanine-cytosine (GC) percentage.
For RNA sequencing data search and presentation, Gene Search results are returned in a heat map format, with the genes on the y-axis (vertical) and the donors/structures on the x-axis (horizontal) (Figure 1). The heat map represents the normalized gene level RNA sequencing expression data in RPKM (reads per kilobase of exon model per million mapped reads). By default, the columns in the heat map are sorted first by donor, and then by structure. The results can also be displayed by structure, and then by donor. Clicking on a data point in the heat map retrieves more information in the panel above the heat map. This information includes gene name and symbol, gene expression (in log2 RPKM), donor, brain structure, Ensembl ID (16) and a link to related data in other Allen Brain Atlas resources. As previously described, a Differential Search and Correlate Gene Search are also available using the temporal component of the BrainSpan data.
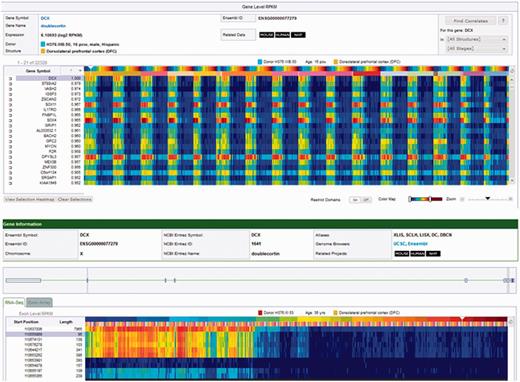
Transcriptome RNA sequencing heat maps. The transcriptome heat map is a visualization of the expression values for the returned gene of interest (top panel). In this example, the Find Correlates search returns (search by example) are shown for DCX (doublecortin), which has high expression during prenatal development. The heat map data is presented as a matrix with brain structure (by developmental stage) on the x-axis and genes on the y-axis. Brain structures are organized in ontological order. Clicking on the toggle button will change the initial sorting parameter from structure to developmental stage. In this example, data is sorted by structure, and then by the youngest to oldest developmental stage within each structure. Each column of the heat map represents a tissue sample. The colors of the heat map are expression values, transformed to a log2 scale. The color scale ranges from dark blue, representing low expression, and passes through cyan, yellow and orange and finally to dark red, representing high expression. The lower panel presents the exon heat map view of the RNA sequencing data for DCX. Each row of the heat map in the RNA sequencing data represents an exon. Exons in the RNA sequencing data are labeled by the chromosome start position and exon length. Positioning the mouse over an exon highlights the corresponding exon in the schematic composite gene model.
RNA sequencing transcriptome visualization is divided into four sections: (i) gene information; (ii) a composite gene model; (iii) a RNA sequencing tab with a heat map of the exon-level expression data in RPKM and an Exon Array tab with a heat map of the exon probeset level expression data in log2-transformed normalized expression intensity values; and (iv) links to external sources of gene information.
The RNA sequencing exon-level RPKM transcriptome heat map is a visualization of the exon expression values for the returned gene of interest. The heat map data are presented as a matrix with brain structure (by developmental stage) on the x-axis and gene exons on the y-axis. Brain structures are organized in ontological order. Clicking on the toggle button changes the initial sorting parameter from structure to developmental stage enabling the visualization of any structural [expression restricted to a particular structure(s)] or temporal (gene expression predominantly before or after birth or increasing expression over time) components of the data. Each row of the heat map in the RNA sequencing exon-level RPKM data represents an exon, which is labeled by the start position on the chromosome and the exon length.
For the exon microarray data, each row of the heat map represents an exon probeset. Approximately four probes are selected for each putative exon region and called a probeset. Each row in the exon microarray data is labeled with the chromosome start and the length of the probeset. Positioning the mouse over the exon in either heat map (RNA sequencing or exon array) highlights the corresponding exon in the composite gene model over the data. Each column of the heat map represents a tissue sample. The colors of the heat map are expression values, transformed to a log2 scale. The color scale ranges from dark blue, representing low expression, and passes through cyan, yellow and orange and finally to dark red, representing high expression. Positioning the mouse over a cell of the heat map reveals donor and structure information in the area above the heat map.
ISH image viewer
The first Allen Brain Atlas data set, the Allen Mouse Brain Atlas, consists predominantly of ISH data (3). Thus, the ISH image viewer is at the fundamental core of analyzing and viewing this data. ISH data is a central part of many Allen Brain Atlas resources, ranging from a highly targeted gene set on a subset of brain regions to a genome survey across the entire brain. The ISH Experiment Images Viewer presents images for each selected experiment in a Zoom and Pan Image Viewer. This view makes it easy to compare experiments with each other and with the integrated reference atlases (where applicable). An infinite number of experiments can be selected for simultaneous viewing, and different experiments viewed in the same window can be reordered by drag-and-drop to facilitate comparison and analysis. The image viewer also presents appropriate metadata and displays thumbnails across the bottom of the viewer. A thumbnail can be clicked for viewing. The main part of the viewer is an interactive window, where an image can be repositioned and zoomed in or out, or other images in the experiment can be selected. Controls on the toolbar enable the contrast or color to be intensified, along with other functionality. The image viewer enables a high-resolution image in its own re-sizable window to be viewed. It is possible to open multiple images by opening multiple windows. Features and functionality of the high-resolution image viewer include different ways to manipulate the image, moving between images and sharing image views.
Viewing ISH data in a high-resolution image viewer enables one to view side-by-side ISH data and associated Nissl histological images. The left-hand viewer shows the ISH image series, and the right-hand viewer reveals the Nissl image series from the same specimen. An image series is an indexed set of images spanning a single specimen, where sections are treated with the same stain, such as ISH for a particular gene, or a histological stain such as Nissl. To show the nearest Nissl section for a particular ISH image the ‘Sync’ feature can be used. Clicking on another ISH image automatically portrays its nearest Nissl section. Clicking on an image thumbnail in the Nissl image series automatically takes one to the nearest ISH image. When the ‘Sync’ box is checked, the Zoom and Pan functions affect both ISH and Nissl images. It is beneficial to simultaneously view experimental ISH images and the histological Nissl images, as Nissl images provide some overall neuroanatomical context to the location of the expressed gene.
Image synchronization
With numerous mouse ISH data sets with various gene coverage (ranging from a subset of selected genes to genome-wide coverage), as well as the temporal aspect of this data (numerous time points), to facilitate the analysis and interpretation of the ISH data, it is essential for the user to be able to simultaneously view similar neuroanatomical regions across different ISH experiments. A cross-plane and cross-time point-based ‘Synchronize’ feature in the Zoom and Pan Image Viewer allows multiple image series to be synchronized to the same approximate position in the brain based on a linear alignment of the images to a set of 3D reference models. This feature enables users to rapidly compare different experiments at a desired anatomic location.
The ‘Synchronize’ feature is available because of standardized experimental design and informatics data processing. The informatics data processing pipeline consists of a set of 3D reference models, an Alignment module, an Expression Gridding module and a Structure Unionizer module (6). The cornerstone of the automated pipeline is a set of 3D reference models. For each time point, a specimen is sectioned to span a nearly complete specimen, and the slides are either Nissl or Feulgen-HP yellow stained to form one high-density image series. Images are reassembled to form a consistent 3D volume. Structural delineation from the 2D reference atlas images is inserted into the 3D model and interpolated to create 3D structural delineations. The 3D reference spaces are then co-registered and scaled into a common space, such that brains of different ages or the same age can be roughly compared for the purpose of the ‘Synchronize’ feature.
The Alignment module operates on a per-specimen basis, where all image series from a specimen are combined as one super image series. Based on maximization of image correlation, the module interleaves the sections from different gene image series, reconstructing the specimen as a consistent 3D volume with co-registration to the 3D reference model. Once registration is achieved, information from the 3D reference model can be transferred to the reconstructed specimen and vice versa. The resulting transform information is saved in the database to support the image synchronization feature in the Zoom and Pan Image Viewer. Thus, multiple image series in the Zoom and Pan Image Viewer can be synchronized to the same approximate location within and across time points. The image synchronization feature is only applicable to products that have a 3D reference model.
Fluorescent image viewing
Similar to viewing colorimetric ISH (CISH) or other histological stains, viewing fluorescent image data builds on the existing CISH image viewer platform. Fluorescent image data includes double fluorescent ISH data, in which the co-localization of two different hybridization probes (genes) is assessed. In addition, fluorescent protein data derived from native fluorescence from fluorescent proteins such as green fluorescent protein or ZsGreen1 (9) show expression of a transgenic reporter gene at the protein level throughout the brain. The majority of fluorescent ISH characterization data available for viewing is located in the Allen Mouse Connectivity Atlas (Transgenic Characterization section), in which fluorescent characterization is used to assess transgene expression in reporter transgenic lines.
All images in a fluorescent image series are displayed as a scrollable set of thumbnails. Clicking on one thumbnail loads the image into the large image viewer. In addition to viewing the fluorescent data, one can view the closest Nissl section or see the CISH image, as well as analyze the fluorescent data in a high-resolution image viewer. A necessary feature for viewing fluorescent image data is the ability to adjust the image color channels; thus, fluorescent field images can be enhanced one color channel at a time. To the right of each color slider control is the name of the probe expressed in that color channel. The center position of the slider control is neutral (image is neither enhanced nor diminished in that channel). The slider can be moved to the right to enhance the color and to the left to diminish the color. Much of the scientific background for each fluorescent experiment is contained in the metadata panel that includes information such as the driver, reporter, age, sex and induction information. Where applicable, there are hyperlinks to the web site of the transgenic mouse distributor for further information on the mouse lines represented in the experiment. In most cases, there is also a link to the Allen Mouse Brain Atlas for the driver gene, as well as the display of applicable probe details.
Brain Explorer
Brain Explorer 2 software is a desktop application for viewing brain anatomy and gene expression data in 3D (8). It is integrated with several Atlases (Table 1) in which one can view spatially registered gene expression data in 3D, and depending on the atlas, one can view a fully interactive version of the associated reference atlas, view ISH expression data from multiple genes superimposed on each other in 3D, navigate high-resolution 2D ISH images and link to associated gene metadata (Figure 2).
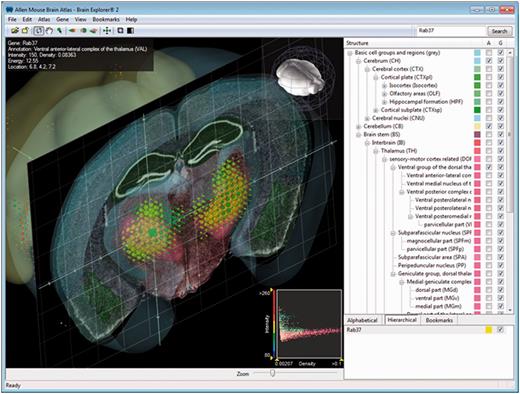
Interface of Brain Explorer software for viewing brain anatomy and gene expression data in 3D. The main window of the Brain Explorer application displays Rab37 expression in a coronal slice from the adult mouse brain, in which gene expression is indicated by colored spheres. The location of the thalamic structure ventral anterior-lateral complex is shown in muted pink. The structural ontology panel on the right-hand side shows the color-coded hierarchy, which can be switched between hierarchical and alphabetical mode. Bookmarks portray saved default and custom views. At the bottom right-hand side of the window is the list of genes shown in the 3D view.
There are two main ways to obtain gene expression data for display in the Brain Explorer application: performing a search and clicking on the ‘3D File’ link in the search results list or searching for genes from the Brain Explorer software itself. The results in the Brain Explorer application show various metadata such as gene name and gene symbol, along with a 3D summary thumbnail of the expression for each experiment matching the search. The expression thumbnail represents a maximum expression projection rendering: the denser the expression in a region, the more ‘solid’ the appearance. Reference atlas colors are layered on top.
The main window in the Brain Explorer application contains a 3D view showing brain anatomy and gene expression in 3D. The structural ontology panel, which can be switched between hierarchical and alphabetical mode, shows the color-coded hierarchy. Each 3D view is based on one underlying 3D volume; depending on the web application, the volume maybe a 3D reconstruction of down-sampled serial sections, such as Nissl stained histology or the 3D volume from the MRI. In addition to the 3D polygonal structures, planar views of the underlying 3D volume and associated annotations can also be displayed.
In the Allen Human Brain Atlas with the Brain Explorer 2 software, a fully interactive version of the Allen Human Brain Atlas in 3D can be viewed. In addition, gene expression data in 3D can be seen on inflated cortical surfaces colored by gene expression values of nearby samples. Further, expression data from different donors can be visualized side-by-side, and anatomically labeled MRI images and cortical surfaces can be explored. Lastly, probes or samples of interest can be investigated in more detail with direct links back to the Allen Human Brain Atlas web application.
In the Allen Developing Mouse Brain Atlas with the Brain Explorer 2 software, a fully interactive version of the Allen Developing Mouse Brain Reference Atlas in 3D at seven developmental ages can be viewed, along with gene expression data in 3D: resolution varies with age, ranging from 80 μm for E11.5 data to 200 μm for P28 data. In addition, expression data from different developmental ages can be viewed side-by-side, along with expression data from multiple image series from the same age superimposed on each other in 3D. Also, Brain Explorer 2 can be used to navigate the high-resolution 2D ISH images and provides links to associated gene metadata on the web application.
In the Allen Mouse Brain Atlas with the Brain Explorer 2 software, a fully interactive version of the Allen Reference Atlas in 3D can be viewed, along with gene expression data in 3D at 200-μm3 resolution, along with expression data from multiple image series superimposed on each other in 3D. Also, the high-resolution 2D ISH images using the 3D model can be navigated with Brain Explorer. Finally, links to associated gene metadata in the Allen Mouse Brain Atlas web application are available.
Interactive Reference Atlas Viewer
The Interactive Reference Atlas Viewer is a valuable tool for exploring neuroanatomy and provides a context for analyzing experimental ISH images for data sets with reference atlases (see Table 1 and Figure 3). The Interactive Reference Atlas Viewer is divided into two windows: a collapsible hierarchy of brain structures and annotated images of the Nissl-stained reference brains (Figure 4). Anatomical structures of the reference atlas are listed in a hierarchical tree, which can be expanded and collapsed to browse to a structure of interest. Clicking on any structure highlights that structure in the image viewer. A search function is also available to find any structure in the list by typing in part of the name or structure acronym. Structures in the list labeled with a black font have a corresponding structure in the atlas. Structures listed in medium gray have at least one descendent with an annotated structure. Those structures listed in a light gray italic font do not have an annotated structure in the reference atlas. The right-hand pane of the interactive atlas viewer displays the images of the reference brains in a Zoom and Pan Image Viewer. Thumbnail images of each section of the reference atlas line the lower border of the pane. Clicking on any thumbnail image allows it to be viewed in the main viewing window.
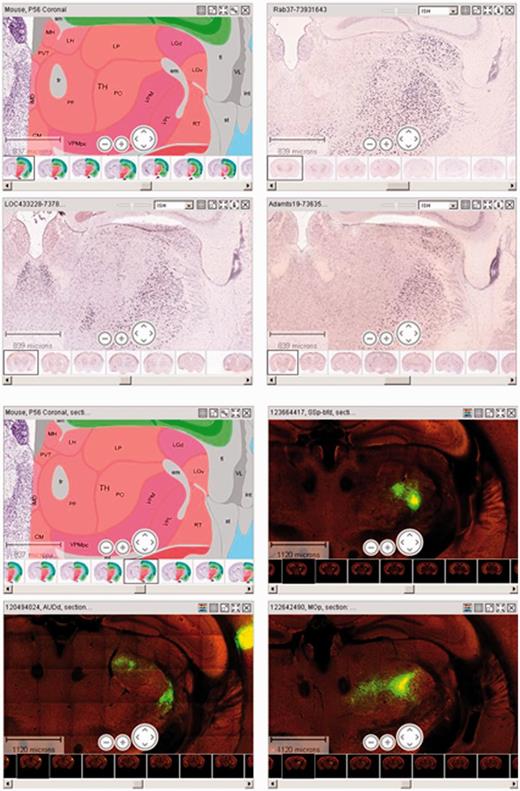
Reference Atlas integration with ISH and connectivity data. The top four images show gene expression data from ISH experiments with LOC433228, Adamts19 and Rab37 along with the P56 mouse reference atlas. All three have strong expression in a subset of thalamic nuclei (red), such as the dorsal part of the lateral geniculate complex (LGd), ventral posteromedial nucleus of the thalamus (VPM) and ventral posterolateral nucleus of the thalamus (VPL). The lower four images show views of the projections (connectivity data) from dorsal auditory area (AUDd), primary motor area (MOp) and SSB-bfd (primary somatosensory area, barrel field), along with the P56 mouse reference atlas. These three neuroanatomical regions have axonal projections to the thalamus. The side-by-side viewing of the reference atlas with various data modalities enables one to glean where the gene is expressed and what brain regions are interconnected, respectively.
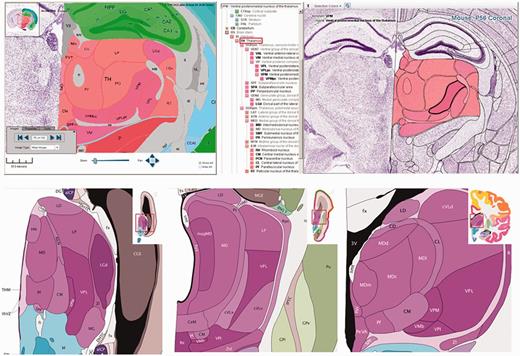
Interactive Reference Atlas Viewer. The top left hand panel portrays an annotated coronal reference atlas plate from the P56 mouse (Allen Mouse Brain Atlas) in the High Resolution Image Viewer. At the top of the image is the hippocampus (green), and in the middle of the image is the thalamus (red) and its corresponding subdivisions (subnuclei). The top right hand panel presents the same annotated adult mouse reference atlas plate in the Interactive Reference Atlas Viewer. This viewer is divided into two windows, a collapsible hierarchical tree of brain structures on the left and annotated images of the Nissl-stained reference sections on the right that displays the images in a Zoom and Pan Image Viewer. Polygons scale and move with the image as one zooms in and out or moves the image in any direction. Moving the computer cursor over the image highlights individual structures; the structure name and acronym are displayed at the top of the window. Clicking on a structure also highlights the structure in the structure hierarchy. The lower panel shows coronal annotated reference atlas plates from the BrainSpan Atlas of the Developing Human Brain from a 15 pcw (post conception weeks), 21 pcw and 34 year reference atlas. The thalamus and its corresponding subregions (subnuclei) are purple in the human atlases. With the reference atlas viewers, one can examine neuroanatomy across time within an individual species (mouse or human), as well as across species (mouse versus human).
Images in the main viewer are annotated with polygons hand drawn by neuroanatomists. Polygons scale and move with the image as one zooms in and out or moves the image in any direction. Moving the cursor over the image highlights individual structures; the structure name and acronym are displayed at the top of the window. Clicking on a structure also highlights the structure in the structure hierarchy. Three configuration options for viewing the various polygon features are available from a toolbar. A text button allows one to toggle on/off the display of the structure acronym over the top of the selected region. The ‘Selection Colors’ drop-down menu provides the option to color all individual structures with the unique colors of the reference atlas, to color only the selected structure or to turn off coloring altogether. The ‘Polygon’ button allows one to toggle on/off the rendering of all structures across the entire brain image.
Data search across projects
The growing Allen Brain Atlas data sets present an unprecedented opportunity to search and compare gene expression data across species and development. Much effort in the last year and the future focuses on refining the integration of these projects and providing mechanisms for relevant and useful data discoveries. Currently, there are two ways to access data across atlases: either via the Related Data feature within each atlas or directly via the Site Search. The Related Data feature provides the user the ability to quickly discover data in other atlases related to the currently viewed data. Viewing a gene such as Pdyn (prodynorphin), a gene thought to be involved in susceptibility to cocaine addiction (17), in the Allen Mouse Brain Atlas reveals that there are additional data related to Pdyn in the human and non-human primate resources from the Related Data button. Traversing from rodent into primate, users can see the expression pattern is consistently enriched in the striatum and the dentate gyrus, and that the expression pattern is conserved across species, suggesting an important biological function for Pdyn in these structures in the brain.
Currently, Related Data connects data across projects at the gene homology level. The search can be refined further by directly accessing the Site Search feature via the search box in the upper right-hand corner from brain-map.org or the Search tab in the portal’s home page. Search terms such as ‘prenatal myelin basic protein’ can be entered to limit the search results to resources containing only prenatal development data on myelin basic protein-related genes. Such a search demonstrates that the Allen Brain Atlas has both RNA sequencing and microarray data in the BrainSpan Atlas of the Developing Human Brain and ISH data in the Allen Developing Mouse Brain Atlas. The full set of data facets is shown in Table 2.
Site Search examples
| Search facet | Example search | Expected results |
|---|---|---|
| Species and genes | Human DRD1A | Returns all data sets containing human DRD1A gene |
| Species and gene family | Human GPCR | Returns all data sets containing human GPCR genes |
| Species, gene and age | Prenatal (or embryonic) human DRD1A | Returns only those data sets containing prenatal DRD1A human genes |
| Species, gene family and age | Postnatal mouse transcription factor | Returns all data sets associated with postnatal mouse transcription factor genes |
| Species, gender and gene family | Female human GPCR | Same as human GPCR query but limits results to data sets containing female donors |
| Species, gender, age and treatment | Embryonic female human microarray | Returns only microarray data (excludes ISH and RNA sequencing data) containing embryonic female donors |
| Species, gender, age, treatment and tissue location | Embryonic female primate ISH amygdala | Returns both embryonic non-human primate and human ISH data containing amygdala structures |
GPCR, G protein-coupled receptor.
Programmatic data access
In addition to the entire suite of search and visualization tools offered across the data sets within the Allen Brain Atlas, an application programing interface (API) is available for programmatic access. Although users could previously access only the adult mouse data programmatically, the newly released API provides access to all of the publicly available data. The API core consists of three components: (i) RESTful Model Access that allows programmatic searching and retrieving of experimental data in JavaScript Object Notation (JSON), Extensible Markup Language (XML) and comma-separated values (CSV); (ii) web services to download high-resolution images for all projects, computed gene expression statistics at the grid voxels for the adult mouse and developing mouse data sets, raw and normalized gene expression values in the human and developing human brain data sets, reference atlas 3D models and ontologies and programmatic access to search tools available in the user interface; and (iii) demonstration applications using different parts of the API, complete with source code where many examples are available in more than one programming language. Full documentation on the API and example applications can be found under the API tab from the Allen Brain Atlas portal, as well as directly at http://api.brain-map.org.
Community outreach and user support
For each atlas, full documentation is provided under the Documentation tab and includes technical white papers that provide a project overview, detailed experimental methodologies, annotation approaches and supplemental data. In projects where reference atlases are available, a separate technical paper describes the reference atlas ontology and how the particular reference atlas is constructed.
In addition to white papers, an Online Help is also available that explains the functionalities of a particular view or feature. The Online Help can be accessed from the Help tab from each project, as well as directly at http://help.brain-map.org.
Because of the continued growth of the data and increased sophistication of the visualization and analysis tools, it has become more important in recent years to provide training on data usage beyond the Documentation and Online Help. Two training methods are now offered on the use of the Allen Brain Atlas data sets: webinars and in-person workshops. Webinars are 3-h long and are offered three times per year, ∼2 weeks after updates are made to the web site. These webinars provide an overview on the basic features but also highlight the newly released data and functionalities. In-person workshops are held at locations throughout the USA, Canada and Europe, which are locally hosted by a particular institution. Training topics can vary based on specific interests but generally cover the basic data and uses of the major atlas resources. Where time permits, advanced topics are also covered. In 2012, a week-long Allen Brain Atlas Hackathon event was held in Seattle focusing on the computational usage (API) of the data. Unlike the webinar or in-person training workshops, the Hackathon provides computationally based users with opportunities to work on specific projects of interest, as well as to collaborate with other participants and the Allen Brain Atlas development team. Dates and additional information on the training programs can be found under the Announcements section in the data portal.
Users can also view 5-min introductory tutorials hosted on YouTube that are accessible from the data portal under the Tutorials tab. These tutorials are not comprehensive; however, they provide a quick overview and highlight some functionality associated with the data sets. As the expansion of Allen Brain Atlas data sets continues, additional tutorials will be added to the library.
Any scientific or technical questions that arise in the use of the data sets can be addressed via email through the ‘Contact Us’ link on the top right-hand corner of every page. Inquiries and feedback are highly appreciated for both the maintenance of the current data sets, as well as innovation of future products.
Citing the Allen Brain Atlas
To site resources for which a primary publication exists, indicated later, cite both the publication and the specific resource web address (Site). Citation of the primary publication is essential when citing the resource in a scientific publication. In cases where it is not feasible to cite the primary publication, and only in such cases, the Site citation is sufficient on its own. When citing anatomic reference atlas content, use the citation for the Atlas resource of which the anatomic reference atlas content is a part. When integrating the data into a web site, for example, using the Allen Brain Atlas API, cite the source in a manner that is clear, accurate and easily discoverable and link to the source atlas. When citing a white paper or other documents associated with a particular resource, cite the specific document by title and date, as well as the Site for that atlas or resource.
For citing the entire collection of resources available via the Allen Brain Atlas Data Portal, use the following citation: web site: Allen Brain Atlas [Internet]. Seattle (WA): Allen Institute for Brain Science. ©2011. Available from: http://www.brain-map.org. For citing the Allen Mouse Brain Atlas (previously Allen Brain Atlas), use the following citation for the primary publication: Lein, E.S. et al. (2007) Genome-wide atlas of gene expression in the adult mouse brain, Nature 445: 168–176. doi: 10.1038/nature05453, and for the web site: Allen Mouse Brain Atlas [Internet]. Seattle (WA): Allen Institute for Brain Science. ©2011. Available from: http://mouse.brain-map.org. For citing the Allen Developing Mouse Brain Atlas, use the following citation: web site: Allen Developing Mouse Brain Atlas [Internet]. Seattle (WA): Allen Institute for Brain Science. ©2009. Available from: http://developingmouse.brain-map.org. For citing the Allen Mouse Brain Connectivity Atlas, use the following citation: web site: Allen Mouse Brain Connectivity Atlas [Internet]. Seattle (WA): Allen Institute for Brain Science. ©2011. Available from: http://connectivity.brain-map.org/. For citing the Allen Spinal Cord Atlas, use the following citation: web site: Allen Spinal Cord Atlas [Internet]. Seattle (WA): Allen Institute for Brain Science. ©2009. Available from: http://mousespinal.brain-map.org.
For citing the Allen Human Brain Atlas, use the following citation for the primary publication: Hawrylycz, M.J. et al. (2012) An anatomically comprehensive atlas of the adult human transcriptome, Nature 489: 391–399. doi: 10.1038/nature11405, and for the web site: ©2012 Allen Institute for Brain Science. Allen Human Brain Atlas [Internet]. Available from: http://human.brain-map.org. For citing the BrainSpan Atlas of the Developing Human Brain, use the following citation: BrainSpan Atlas of the Developing Human Brain [Internet]. Funded by ARRA Awards 1RC2MH089921-01, 1RC2MH090047-01, and 1RC2MH089929-01. ©2011. Available from: http://brainspan.org. For citing the NIH Blueprint Non-Human Primate (NHP) Atlas, use the following citation: The NIH Blueprint Non-Human Primate (NHP) Atlas, NIH Contract HHSN-271-2008-00047-C to the Allen Institute for Brain Science (Seattle, WA). Available from: http://www.blueprintnhpatlas.org/. The authors’ opinions or views are not necessarily those of the NIH.
For citing the Ivy Glioblastoma Atlas Project, use the following citation: web site: Ivy Glioblastoma Atlas Project [Internet]. Seattle (WA): Funded by the Ben and Catherine Ivy Foundation in collaborative partnership with the Allen Institute for Brain Science and the Ben and Catherine Ivy Center for Advanced Brain Tumor Treatment. ©2010. Available from: http://glioblastoma.alleninstitute.org.
For citing the Sleep Study, use the following citation for the primary publication: Thompson, C.L. et al. (2010) Molecular and anatomical signatures of sleep deprivation in the mouse brain. Frontiers in Neuroscience Vol. 4, Article 165. doi: 10.3389/fnins.2010.00165, and for the web site: Allen Institute Sleep Study [Internet]. Seattle (WA): Allen Institute for Brain Science in collaboration with SRI International. ©2009. Available from: http://sleep.alleninstitute.org. For citing the Mouse Diversity Study, use the following citation for the primary publication: Morris, J.A. et al. (2010) Divergent and nonuniform gene expression patterns in mouse brain. Proceedings of the National Academy of Sciences 107(44):1049–19054, and for the web site: Allen Institute Mouse Diversity Study [Internet]. Seattle (WA): Allen Institute for Brain Science. ©2009. Available from: http://mousediversity.alleninstitute.org.
FUNDING
Department of Health and Human Services Resources and Services [1C76HF15069-01-00, 1C76HF19619-01-00 for the Allen Human Brain Atlas project]; National Institute of Mental Health [RC2MH089921, RC2MH090047, RC2MH089929 for the BrainSpan project]; National Institute of Mental Health [HHSN-271-2008-0047 for the National Institutes of Health Blueprint project]; Ivy Glioblastoma Atlas Project is a collaborative partnership between the Ben and Catherine Ivy Foundation, the Allen Institute for Brain Science and the Ben and Catherine Ivy Center for Advanced Brain Tumor Treatment. The Allen Spinal Cord Atlas was made possible by a unique funding consortium comprising public and private entities including the ALS Association, PVA Research Foundation, Wyeth Research, PEMCO Insurance, National Multiple Sclerosis Society, International Spinal Research Trust and philanthropist and Institute founder Paul G. Allen, as well as numerous anonymous donors. Department of Defense USAMRAA [W81XWH-06-1-0131 for the Sleep project]; National Institutes of Health [RO1 HL59658 for the Sleep project], sleep.alleninstitute.org. The content is solely the responsibility of the authors and does not necessarily represent the official views of the Department of Health and Human Services, National Institutes of Health, the National Institute of Mental Health, and the Department of Defense. Funding for open access charge: Allen Institute for Brain Science.
Conflict of interest statement. None declared.
ACKNOWLEDGEMENTS
The authors thank the Allen Institute founders, Paul G. Allen and Jody Patton, for their vision, encouragement and support. They also thank the Allen Institute’s Web Development and Visualization team consisting of Felix Lee, David Feng and Guangyu Gu for user interface development; Database and Project management teams consisting of Andrew Sodt, Rob Young, Aaron Szafer, Wayne Wakeman, Tim Fliss and Nathan Sjoquist for data warehouse and API and Informatics team consisting of Leonard Kuan, Yang Li, and Yungeng Sui for automated image processing and registration.

Comments