


Abstract
The temporal lobe in the left hemisphere has long been implicated in the perception of speech sounds. Little is known, however, regarding the specific function of different temporal regions in the analysis of the speech signal. Here we show that an area extending along the left middle and anterior superior temporal sulcus (STS) is more responsive to familiar consonant–vowel syllables during an auditory discrimination task than to comparably complex auditory patterns that cannot be associated with learned phonemic categories. In contrast, areas in the dorsal superior temporal gyrus bilaterally, closer to primary auditory cortex, are activated to the same extent by the phonemic and nonphonemic sounds. Thus, the left middle/anterior STS appears to play a role in phonemic perception. It may represent an intermediate stage of processing in a functional pathway linking areas in the bilateral dorsal superior temporal gyrus, presumably involved in the analysis of physical features of speech and other complex non-speech sounds, to areas in the left anterior STS and middle temporal gyrus that are engaged in higher-level linguistic processes.
Introduction
Perception of speech sounds requires categorization. This is because different instances of the same vocal gesture inevitably vary acoustically and, as a result, a wide range of physically different sounds must nevertheless represent the same phonemic entity. Striking evidence for this phenomenon is the relative inability to discriminate between synthetic stop consonants that are physically different when these fall within the same phonetic category (Liberman et al., 1957; Repp, 1984). Though this warping of perceptual space, known as categorical perception, is not limited to the perception of speech sounds (Miller et al., 1976; Pisoni, 1977; Burns and Ward, 1978; Pastore et al., 1990) nor to perception in humans (Kuhl and Miller, 1978; Kluender et al., 1987), it is an important determinant of phonemic perception. This is because familiar sounds such as speech phonemes tend to be perceived more categorically than similarly complex sounds with which the listener does not have extensive auditory experience, such as non-native speech contrasts (Goto, 1971; Eimas, 1975; Miyawaki et al., 1975; Werker and Tees, 1984). Presumably, the development of category representations for complex sounds is dependent on the nature of the auditory experience of the listener with those sounds. In addition, certain speech sounds such as stop consonants contain short, rapid spectral variations and are therefore more likely to be perceived categorically than other speech sounds lacking dynamic spectral variations, such as isolated vowels or isolated fricative noises (Fujisaki and Kawashima, 1969; Pisoni, 1975; Healy and Repp, 1982). Thus, the perception of familiar, spectrally dynamic speech sounds entails a recoding of the acoustic waveform into a more abstract phonemic representation, resulting in categorical perception. In contrast, the perception of sounds for which category representations have not developed or are less defined varies continuously with changes along a physical dimension, and discrimination thresholds for such sounds are a constant fraction of stimulus magnitude.
Much has been learned about the neurophysiological basis of speech perception from human neuroimaging studies. These studies have consistently shown an anterolaterally oriented region in the superior temporal lobes responsive to speech sounds (Wise et al., 1991; Mummery et al., 1999; Belin et al., 2000; Binder et al., 2000; Scott et al., 2000). A hierarchical organization of this pathway has been suggested, with primary auditory areas on the superior temporal plane responding relatively indiscriminately to all sounds, and more anterior, lateral and ventral association areas on the superior temporal gyrus (STG) and superior temporal sulcus (STS) showing sensitivity to spectrotemporal complexity and linguistic intelligibility (Binder et al., 2000; Scott et al., 2000; Davis and Johnsrude, 2003; Narain et al., 2003; Poeppel, 2003; Giraud et al., 2004). It has been hypothesized that early auditory analysis of the speech signal is bilateral, and that later stages of processing such as semantic analysis involve specific subsystems that predominantly engage the left hemisphere (Binder et al., 2000; Poeppel et al., 2004). However, neuroimaging studies of speech have not focused on the point of transition that occurs as the acoustic waveform is recoded as a phonemic category, resulting in categorical perception. Previous studies comparing activations to speech and nonspeech sounds at a sub-lexical level have used nonspeech control sounds which differed in their spectrotemporal complexity from the experimental speech sounds, including tones (Demonet et al., 1992; Binder et al., 2000; Jancke et al., 2002; Poeppel et al., 2004), noise bursts (Zatorre et al., 1992), sinewave analogs (Vouloumanos et al., 2001) and environmental sounds (Giraud and Price, 2001). Other investigators have used spectrally rotated vocoded speech (Scott et al., 2000; Narain et al., 2003) or several acoustically different nonspeech sounds (Davis and Johnsrude, 2003) to appropriately control for acoustic processes in speech perception. However, the speech material in these latter studies was composed of sentences which likely elicited higher linguistic analysis, including lexical, semantic and syntactic processing. Thus, these studies did not clarify to what extent areas along this pathway in the STG are specialized for phonemic perception and distinct from areas involved in general auditory analysis of complex sounds or from areas involved in higher-level linguistic processing.
The purpose of the present study was to identify cortical areas involved in the phonemic recoding process by comparing functional magnetic resonance imaging (fMRI) blood-oxygenation-level-dependent (BOLD) signals elicited by speech syllables with those elicited by acoustically matched, nonphonemic, speech-like sounds during an auditory discrimination task. The nonphonemic sounds preserved the acoustic characteristics of the speech syllables (duration, amplitude envelope, spectrotemporal complexity, harmonic structure, and periodicity) but were inconsistent with any English phoneme. They were, on average, as discriminable as the phonemic sounds. It was thus hypothesized that the discrimination of the phonemic and the nonphonemic sounds would entail similar acoustic analysis and would pose similar attentional and task loads. Accordingly, similar patterns of activation would be observed in both conditions in dorsal temporal brain areas, including Heschl's gyrus and the planum temporale, which are concerned with analysis of auditory features of complex sounds (Binder et al., 1996; Wessinger et al., 2001; Hall et al., 2002, 2003; Seifritz et al., 2002), in parietal regions associated with auditory encoding (Jonides et al., 1998; Hickok et al., 2003) and in frontal areas associated with decision processes in auditory discrimination tasks (Fiez et al., 1995; Binder et al., 2004). In contrast, it was anticipated that only the phonemic sounds would entail encoding of the acoustic information into phonemic representations. Accordingly, brain areas activated differentially during discrimination of the phonemic and nonphonemic sounds would be associated with phonemic encoding.
The phonemic sounds consisted of tokens from a consonant–vowel (CV) syllable continuum from /ba/ to /da/. The tokens were re-synthesized based on values of the first five formants of naturally produced utterances of the syllables. The anchor points of this continuum are shown in Figure 1 (upper panels). The nonphonemic sounds consisted of the equivalent tokens from a corresponding nonphonemic continuum. The anchor points of the nonphonemic continuum (Fig. 1, lower panels) were constructed by spectrally inverting the first formants of the anchor points of the phonemic continuum, in order to disrupt their phonemic value without altering their spectrotemporal characteristics. The first formant transition is a cue for the manner of consonant articulation. It typically rises from low-frequency values reflecting the degree of constriction of the vocal tract during consonant production to higher values associated with vowel production (Kent and Read, 1992). The nonphonemic sounds in this study were inconsistent with the familiar structure of English CV syllables because their first formant transition segment was made to fall in frequency. Perceptually, they were somewhat similar to a glottal stop followed by a schwa. Glottal stops occur in American English in word medial position (for instance, in the middle of the negation ‘unh-unh’) or as an allophone of medial or final /t/ in some dialects of English, and they are full phonemes in other languages (Native American languages, Hebrew, Arabic, Japanese and Samoan). However, when presented out of the context of a word and in initial position as in this study, the control sounds were not recognized as speech by native speakers of General American English and they could not be classified into distinct phonemic categories. This was confirmed in a pilot test (see Methods) and by behavioral performance measures collected in the study.

Spectrograms of test items. Spectrograms of the anchor points /ba/ (upper left) and /da/ (upper right) of the phonemic continuum and of their nonphonemic analogs (lower panel). The horizontal stripes represent the formants (F1, F2, F3, F4, F5), which are peaks of acoustic energy at the vocal tract resonance frequencies. The spectral transition segments of F1 and F3 of the phonemic anchor points were manipulated to create the nonphonemic anchor points (see Methods for details).
In the scanner, subjects performed a two-alternative forced-choice ABX discrimination task (is X identical to the first or second token in a preceding AB pair?) with token-pairs from the /ba/–/da/ continuum or from the matched nonphonemic continuum. Tokens in all pairs were equidistant in acoustic space, but the phonemic tokens fell either within or across the /ba/–/da/ boundary. We chose an explicit auditory discrimination task rather than passive listening because it permits to monitor the level and focus of attention. Previous neuroimaging studies have indicated that these factors modulate neural activation to speech sounds in the temporal lobes (Binder et al., 2000; Hugdahl et al., 2003; Liebenthal et al., 2003). In addition, the ABX task indicated whether perception of the syllables and control sounds was phonemic (categorical) or nonphonemic (continuous). Since the control sounds were acoustically similar to the syllables (they were of identical duration and contained the same proportion of spectral transition and steady state segments), we anticipated their perception to be categorical and comparable to that of the syllables if subjects used defined categories to represent them. In contrast, their perception should be approximately continuous if subjects did not associate them with learned phonemic categories.
The overall levels of performance in the phonemic and the nonphonemic conditions were matched in order to avoid contamination of the functional contrast between them with activation from areas sensitive to attention, effort and other nonspecific performance factors. To adjust the levels of performance, it was necessary to improve the discriminability of the nonphonemic tokens. This was achieved by enhancing the differences in the first and third formant transition segments between the anchor points of the nonphonemic continuum (see Methods). Behavioral measures confirmed that the overall discriminability of the phonemic and the nonphonemic tokens was comparable.
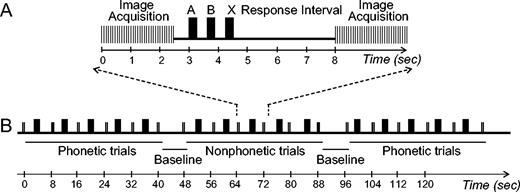
Images were acquired on a 1.5 T scanner (GE Medical Systems, Milwaukee, WI) at 8 s intervals, using a clustered acquisition technique (Edmister et al., 1999). This method allows for sound presentation in relatively quiet intervals between image acquisitions and minimizes contamination of the BOLD response by the acoustic noise produced during image acquisition. An illustration of the experimental paradigm is shown in Figure 2.
Experimental design. Relative timing of task and image acquisition: (A) within a trial and (B) within a run. See Methods for further details of the design.
Methods
Subjects
Participants were 25 healthy adults (16 women), 19–50 years old (average 28.8 years), with no known neurological or hearing impairments. Subjects were all native speakers of General American English. Two of the subjects reported being fluent in a second language, one in Spanish and one in Chinese. Fourteen of the subjects reported having limited experience with a second language, including Spanish (nine), French (three) and Italian (one). Subjects were all right-handed according to the Edinburgh Handedness Inventory (Oldfield, 1971). Data from two other subjects were excluded due to a response rate lower than 35/40 per experimental condition. Informed consent was obtained from each subject prior to the experiment, in accordance with a protocol sanctioned by the Medical College of Wisconsin Institutional Review Board.
Test Items
Test items were created using a cascade/parallel formant synthesizer (SenSyn Laboratory Speech Synthesizer, Sensimetrics Corp., Cambridge, MA). The phonemic test items consisted of an eight-token continuum from /ba/ to /da/. Pitch, intensity, formant bandwidth and formant center frequency parameters for synthesis of the anchor points of the continuum were derived from natural utterances of the syllables /ba/ and /da/ produced by a male speaker (J.R.B.) and sampled at 44.1 kHz. The pitch, intensity and formant bandwidths of the anchor points were equated using the average values for both tokens. The formant center frequencies were similarly equated throughout the steady-state vowel segment of the syllables (60–150 ms) using average values, but they differed during the initial (0–60 ms) transition segment. In particular, the second formant (F2) transition, which provides strong cues for identification of the stop consonants, had a low initial value (850 Hz) and a rising slope for /ba/ (anchor 1) and a high initial value (1639 Hz) and falling slope for /da/ (anchor 2) (Fig. 1, upper panels and Appendix A). Values for synthesis of intermediate tokens were interpolated by systematically varying the center frequencies of the first five formants of the anchor points during the transition segment in equal steps, while keeping the steady state portion and all other synthesis parameters identical to those of the anchor points.
The anchor points of the nonphonemic continuum were created by spectrally inverting the first formant (F1) of the anchor points of the phonemic continuum. The spectrum of the transition segment (0–60 ms) of F1 and the spectrum of the steady-state segment (60–150 ms) of F1 were rotated each around their mean frequency and then the segments were reconnected by lowering the rotated steady-state segment by 100 Hz. This manipulation disrupted the percept of the stop consonants and rendered the sounds inconsistent with any English phoneme. Second, the slopes of the third formant (F3) transition segments of the nonphonemic anchor points were exaggerated (made steeper). In addition, the F1 transition segment of nonphonemic anchor 2 was changed from its falling pattern to a dip. These two latter manipulations were designed to render the discriminability between points on the nonphonemic continuum comparable overall to that of the phonemic continuum. The study behavioral results confirmed this. Values for synthesis of intermediate tokens were similarly interpolated by varying the center frequencies of the first five formants of the nonphonemic anchor points during the transition segment in equal steps.
All tokens were edited to 150 ms duration with a 5 ms rise-decay envelope using Praat (www.praat.org). Stimuli were delivered through Koss ESP-950 electrostatic headphones (Koss, Milwaukee, WI) at 85 dB and were attenuated ∼20 dB by the earplugs worn as protection from scanner noise. Stimulus presentation was controlled by the Psyscope software package (Psyscope, Carnegie Mellon University).
Audio samples of the test material can be heard online at http://www.neuro.mcw.edu/∼einatl/CP_demo.pdf. Formant values for the phonemic and the nonphonemic anchor points are given in Appendix A.
Pilot Study
Ten other subjects participated in a pilot study to evaluate the quality of the test sounds. The subjects were native speakers of General American English, without significant knowledge of languages other than English. The same headphones (ESP-950, Koss) and stimulus presentation system (Psyscope) were used in the pilot study as in the full study. First, subjects listened to the anchor points of the phonemic continuum presented three times each, in alternation. Concurrent with the presentation of each sound, a visual display appeared on the computer screen identifying the sounds as ‘sound 1’ (for anchor 1) or ‘sound 2’ (for anchor 2). Next, subjects listened to 40 trials (20 per anchor point, presented in random order) and were requested to identify them as ‘sound 1’ or ‘sound 2’ by pressing the appropriate key. After each trial, visual feedback indicating the correct response was provided. Subjects were instructed to use this feedback to improve their performance. Finally, subjects were presented with 80 test trials (10 of each of the 8 tokens in the continuum, in random order) to be identified as ‘sound 1’ or ‘sound 2’. Feedback was not provided. The same three-step procedure was then repeated for the nonphonemic continuum. Upon completion of the three-step procedure for both continua, subjects were asked whether they had recognized speech utterances in either the first or the second set of sounds that they had heard. They were asked to articulate the speech sounds that they recognized, if any.
Subjects identified tokens 1–4 in the phonemic continuum as ‘sound 1’ (at an average rate of 92% or higher) and tokens 6–8 as ‘sound 2’ (at an average rate of 91% or higher), with an intermediate value (53%) for token 5. In contrast, the nonphonemic identification function was gradual, with no steep transition from one end of the continuum to the other. Most importantly, 9/10 subjects recognized the phonemic sounds as /ba/ and /da/. One subject did not identify these sounds as speech. No subject associated the nonphonemic sounds with speech phonemes.
Experimental Procedure
In the full study, subjects were initially familiarized and tested on identification with the phonemic and then with the nonphonemic test items. The familiarization procedure was similar to the one described above for the pilot study, with the exception that in the visual feedback provided in steps 1 and 2, the phonemic anchor points were labeled as ‘ba’ and ‘da’ rather than ‘sound 1’ and ‘sound 2’. This modification was adopted in order to minimize uncertainty and inter-subject variability in the perception of the sounds. The three-step familiarization procedure for each continuum consisted of (i) listening to the anchor points (3 trials/anchor point, in alternation); (ii) identification training on the anchor points with feedback (15 trials/anchor point, random order); and (iii) identification testing on the entire eight-token continuum without feedback (10 trials/token, random order). Upon completion of the three-step procedure with the phonemic and the nonphonemic sounds, subjects practiced the scanner task (ABX discrimination) with anchor points from both continua (12 trials/continuum, random order). Identification functions (Fig. 3A), based on the responses collected in step 3 of the familiarization procedure and pooled across trials and across subjects, were used to determine the location of the phonetic boundary.
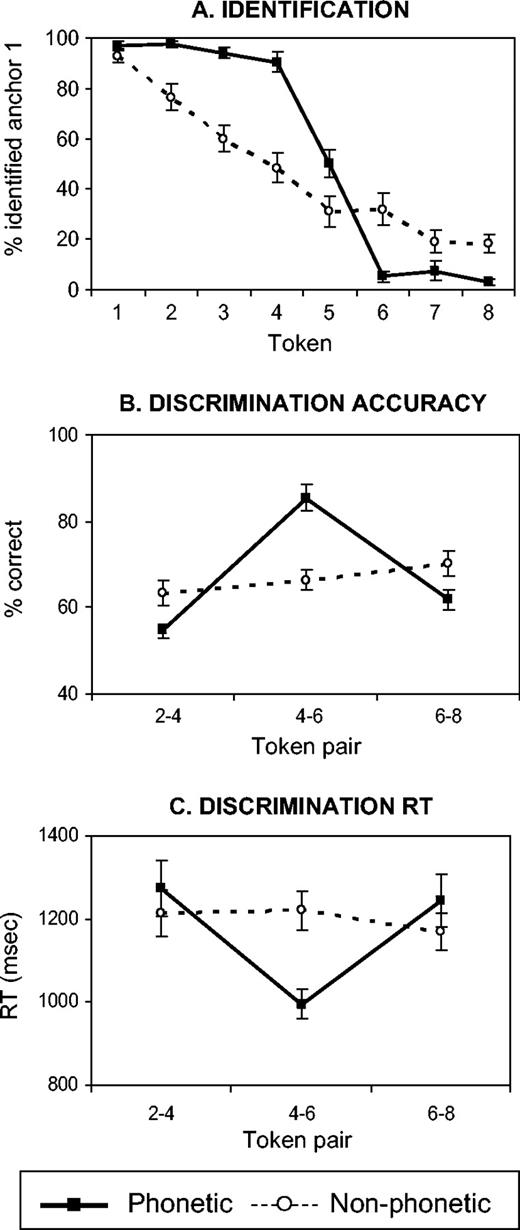
Behavioral data. (A) Identification functions for the phonemic (full trace) and nonphonemic (stippled trace) continua, computed from data collected during the familiarization procedure. (B) ABX discrimination accuracy and (C) RT functions for three token-pairs from each continuum, computed from data collected in the scanner (n = 25). RT was measured from the onset of X. Error bars represent standard errors.
During scanning, subjects performed a two-alternative forced-choice ABX discrimination task. Test items included three token-pairs from each continuum. The distance in acoustic space between the tokens in each pair was identical, but for the phonemic items one token-pair was within the /ba/ category (2–4), one was within the /da/ category (6–8) and one crossed the phonetic category boundary (4–6). The interstimulus interval (ISI) between A and B, and between B and X, was 500 ms.
One trial was presented in each interval between image acquisitions, beginning 500 ms after completion of each acquisition (Fig. 2A). Forty trials were presented for each of the six experimental conditions (three token-pairs per continuum), over the course of eight scanning runs. Phonemic and nonphonemic conditions alternated every five trials, with one baseline silence condition inserted between each alternation (Fig. 2B).
Analysis of variance with factors of stimulus (phonemic, nonphonemic) and category (2–4, 4–6, 6–8) was applied to test effects on discrimination accuracy and discrimination reaction time (RT). RTs were measured from the onset of X.
Image Acquisition and Analysis
Images were acquired on a 1.5 T GE Signa scanner (GE Medical Systems, Milwaukee, WI). Functional data consisted of T2*-weighted, gradient echo, echo-planar images (TE = 40 ms, flip angle = 90, NEX = 1) obtained using clustered acquisition (Edmister et al., 1999) (acquisition time = 2500 ms) at 8 s intervals to avoid perceptual masking of the test items or contamination of the data by the acoustic noise of the scanner. Time-course measurements of the hemodynamic response in auditory cortex (Belin et al., 1999; Inan et al., 2004) indicate that the hemodynamic response to stimulus × (last in each trial) peaks at the time of image acquisition, 4–6 s after the onset of X, while the response to the scanner noise is in its decay phase, 8–10 s after the onset of the scanner noise (6–8 s after the offset of the noise), allowing for a good separation between these responses. The images were reconstructed from 22 axially oriented contiguous slices with 3.75 × 3.75 × 4 mm voxel dimensions. Forty images were acquired per experimental and baseline condition. High-resolution anatomical images of the entire brain were obtained using a 3-D spoiled gradient echo sequence (‘SPGR’, GE Medical Systems, Milwaukee, WI), with 0.9 × 0.9 × 1.2 mm voxel dimensions.
Within-subject analysis consisted of spatial co-registration (Cox and Jesmanowicz, 1999) and voxelwise multiple linear regression (Ward, 2001) with reference functions representing stimulus (phonemic, nonphonemic), category (2–4, 4–6, 6–8) and response (correct, incorrect). Individual t-maps were computed to determine the extent of activation (relative to rest) in each of the experimental conditions. General linear tests were conducted for the stimulus (phonemic versus nonphonemic) and response (correct versus incorrect) contrasts and for the interaction between category [4–6 versus (2–4 + 6–8)] and stimulus. Individual anatomical scans and statistical t-maps were projected into standard stereotaxic space (Talairach and Tournoux, 1988). Statistical maps were smoothed with a Gaussian filter of 6 mm full-width half-maximum. In a random effects analysis, individual t-maps were contrasted against a constant value of 0 to create group t-maps. The group maps were thresholded at t > ±4.02, corresponding to P < 5×10⁻⁴. Clusters smaller than 344 mm3 (equivalent to six voxels) were removed in order to obtain a corrected map probability for false positives of α < 0.01, as determined by Monte Carlo simulation (Ward, 2000).
In addition, activation in the phonemic–nonphonemic contrast maps was compared between the right and left hemispheres in a region of interest (ROI) encompassing the ventral portion of the STG and the middle temporal gyrus (MTG). The ROI corresponded to Brodmann areas (BA) 21 and 22 (Fig. 6, left panel), as delineated in the AFNI Talairach Daemon, which is based on the San Antonio Talairach Daemon database (Lancaster et al., 2000) and consistent with the atlas of Talairach and Tournoux (1988). Dorsal temporal areas corresponding to BA 41 and 42 were not included in this ROI. A composite measure of the activation volume, defined as the number of activated voxels exceeding a threshold t-value of ±1.6 (corresponding to a lenient P < 0.1) and weighted by the activation intensity, was computed for the left and right ROI in every subject. These values were then submitted to a paired t-test to search for interhemispheric differences in activation. Finally, the same analysis was applied to a dorsal STG ROI, encompassing BA 41 and 42 but excluding BA 21 and 22.
Results
Identification (Fig. 3A) and discrimination (Fig. 3B,C) functions demonstrate categorical perception of the phonemic continuum and continuous perception of the nonphonemic continuum. The phonemic identification function is flat at both ends and displays a sharp transition between tokens 4 and 6, reflecting perceptual division of the continuum into two distinct categories, /ba/ and /da/. In contrast, the nonphonemic identification function is linear, reflecting a gradual change in perception with the gradual acoustic change in formant transitions along the continuum. For the phonemic continuum, the discrimination function rose sharply from an average of 58 ± 2% within-category (chance = 50%) to 85 ± 3% across-category [F(2,72) = 44.53, P < 10−5]. The response times mirrored this effect and were shorter across-category [F(2,72) = 7.30, P < 10−3]. For the nonphonemic continuum, discrimination did not differ between the token-pairs [F(2,72) = 1.21, P < 0.3]. The overall level of discrimination performance (pooled across token-pairs) did not differ between the phonemic and the nonphonemic continua and averaged 67% for both. Similarly, the pooled RT did not differ between the continua, averaging 1171 ms for the phonemic and 1201 ms for the nonphonemic conditions. However, discrimination accuracy for contrasts 2–4 and 6–8 (within category in the phonemic continuum) was lower in the phonemic relative to the nonphonemic continuum [F(1,98) = 9.93, P < 0.001] and accuracy for the 4–6 contrast (across category in the phonemic continuum) was higher in the phonemic relative to the nonphonemic continuum [F(1,48) = 24.55, P < 10−5].
BOLD activation during performance of the ABX discrimination task with the phonemic and the nonphonemic stimuli relative to rest was widespread and included the STG, bilaterally, and areas in the frontal and parietal lobes (Fig. 4). The main effect of stimulus was investigated by contrasting the activation during ABX discrimination in the phonemic and the nonphonemic conditions. Increased BOLD activation in the phonemic condition was observed predominantly in the anterior and middle portions of the left STS. Smaller foci of activation occurred in the thalamus (particularly in the left hemisphere), the anterior and posterior cingulate gyrus, and the right cerebellum. The activation peaks in the phonemic > nonphonemic contrast are shown in Figure 5, and the peak coordinates and cluster sizes of the activation foci are detailed in Table 1. No areas were found to be activated more during the nonphonemic condition relative to the phonemic condition. Other comparisons, between correct and incorrect responses, and between responses to within- and across-category contrasts, revealed no significant differences in activation. Interhemispheric comparison of a composite measure of volume and intensity of activation in the phonemic–nonphonemic contrast maps indicated that the activation was significantly stronger in the left STG/MTG ROI (t = 2.24, P < 0.03). This analysis, performed with a very relaxed threshold (voxelwise P < 0.1), confirmed that the observed left lateralization in the phonemic–nonphonemic contrast map was not an artifact of stringent thresholding. Figure 6 shows the area included in the left and right STG/MTG ROI masks (left panel) and the extent of activation in this area in three representative subjects (right panels). In contrast, no significant interhemispheric differences in activation were observed in the dorsal STG ROI (t = 0.99, P < 0.33).
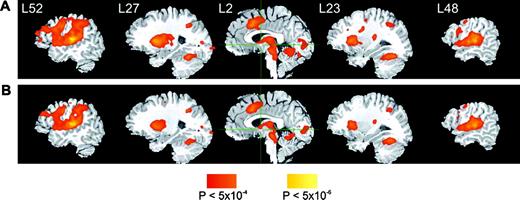
Imaging data. Functional t-maps showing stronger activation during discrimination in the phonemic (A) and in the nonphonemic (B) conditions relative to the silence baseline condition (n = 25), overlaid on an anatomical image of one subject. The stereotaxic x-coordinate representing lateral distance in mm from the AC–PC line (L = left, R = right) of each sagittal section is given. Cross-hairs indicate the planes through coordinates 0, 0, 0 in stereotaxic space. The color scale indicates uncorrected voxelwise probabilities for false positives. The corrected map probability is α < 0.01.
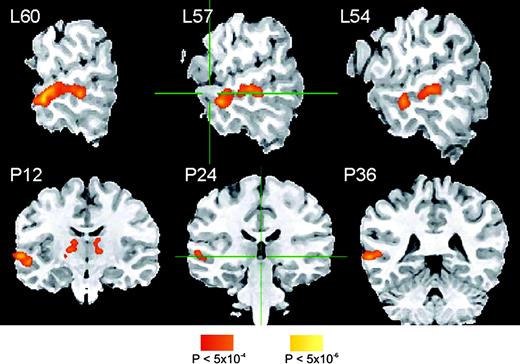
Functional t-maps of areas showing stronger activation during discrimination in the phonemic relative to the nonphonemic condition (n = 25), overlaid on an anatomical image of one subject. The stereotaxic x-coordinate representing lateral distance in mm from the AC–PC line (L = left) of each sagittal section (top row) and the stereotaxic y-coordinate representing distance from the AC along the anterior–posterior axis (P = posterior) of each coronal section (bottom row) are given. The color scale indicates uncorrected voxelwise probabilities for false positives. Corrected map probability is α < 0.01.
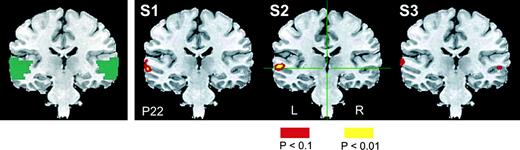
Left panel: functional mask covering the left and right ROI in which activations were compared to assess hemispheric lateralization in the phonemic > nonphonemic contrast, overlaid on a coronal slice of one subject at stereotaxic plane P22. The mask included ventral regions in the STG and the MTG, corresponding to BA 21 and 22 but excluding BA 41 and 42 (see Methods for details of mask formation). Three right panels: functional t-maps showing the activation in the phonemic relative to the nonphonemic condition in three representative subjects (S1, S2, S3), overlaid on a coronal slice of one subject at stereotaxic plane P22. Activated voxels exceeding a threshold t-value of ±1.6 (P < 0.1) were included in this analysis and are shown in the figure.
Peaks of BOLD activation in the phonemic–non phonemic contrast
| Anatomical location | Talairach coordinates (mm) | BA | z-scores at peak | Cluster size (mm3) | ||||
|---|---|---|---|---|---|---|---|---|
| x | y | z | ||||||
| L STS | −60 | −8 | −3 | 21/22 | 5.21 | 3683 | ||
| −56 | −31 | 3 | 4.59 | |||||
| L thalamus | −14 | −16 | 6 | 5.15 | 1616 | |||
| R thalamus | 17 | −18 | 4 | 4.48 | 643 | |||
| Ant cingulate | 9 | 8 | 34 | 32/24 | 4.51 | 1203 | ||
| Post cingulate | −2 | −47 | 10 | 29 | 5.16 | 975 | ||
| R cerebellum | 14 | −71 | −21 | 4.61 | 1056 | |||
Approximate anatomical locations, coordinates in standard stereotaxic space (Talairach and Tournoux, 1988), Brodmann areas, activation peaks expressed as z-scores (and at least 20 mm apart) and cluster sizes for the phonemic-nonphonemic contrast. Abbreviations: STS, superior temporal sulcus; L, left; R, right; Ant, anterior; Post, posterior; BA, Brodmann area.
Discussion
The categorical perception of the phonemic continuum is consistent with previous reports on the perception of synthetic stop consonants varying along a continuum of place of articulation (Liberman et al., 1957; Mattingly et al., 1971). It results from the recoding of a range of acoustic signals into discrete phonemic representations. In contrast, the continuous perception of the nonphonemic continuum suggests that the subjects did not group these sounds into distinct perceptual categories. While it is conceivable that a continuous identification function such as that shown in Figure 3A could have resulted from subjects grouping the entire nonphonemic continuum into a single category, the pattern of the discrimination function does not support this idea. Discrimination accuracy between nonphonemic tokens was well above chance and well above the discrimination accuracy for the within-category phonemic contrasts. This relatively good but ‘flat’ discrimination function suggests a continuous, graded perception of the nonphonemic tokens. This pattern suggests that subjects did not group the nonphonemic sounds into perceptual categories in performing the discrimination task, most likely due to their limited experience with those sounds and the lack of established category representations for them. Although the nonphonemic sounds used in this study are similar to sounds such as glottal stops that are encountered in everyday language, the acoustic differences between them are not phonemic or linguistically relevant in English, and the context in which they were presented (syllable initial position) is unfamiliar. Indeed, listeners in the pilot study reported that they did not recognize the nonphonemic items as speech or as any other familiar sound object. The continuous perception of the nonphonemic continuum conforms to numerous lines of evidence indicating that the development of category representations for speech and other complex sounds is dependent on the extent of exposure of the listener to the sounds and the context in which the sounds were learned. For instance, young infants can make some acoustic distinctions that are lost later in life if they are irrelevant to their native language (Goto, 1971; Eimas, 1975; Miyawaki et al., 1975; Werker and Tees, 1984). Trained musicians can categorize musical intervals that musically untrained listeners do not perceive categorically (Burns and Ward, 1978). Finally, different auditory training regimes can bias the warping of acoustic space into perceptual categories (Guenther et al., 1999).
The nonphonemic sounds were acoustically matched with the phonemic sounds in duration, amplitude, spectrotemporal complexity, periodicity and harmonic structure. Thus, comparison of the BOLD responses during discrimination in the phonemic and nonphonemic conditions allowed separation of the neural processes underlying phonemic perception from those associated with analysis of the acoustic properties of the speech signal. Dorsal temporal areas were bilaterally and equally activated by phonemic and nonphonemic sounds of comparable complexity, in line with the hypothesis that these areas are involved in auditory, pre-phonemic analysis of complex sounds (Binder et al., 1996; Wessinger et al., 2001; Hall et al., 2002, 2003; Seifritz et al., 2002). Direct comparison of the activation in the phonemic and nonphonemic conditions revealed that the middle and anterior left STS (Brodmann areas 21/22) was more responsive to the phonemic sounds. This region of the left STS appears to play a specific role in phonemic perception. It lies at a point along an antero-ventrally oriented auditory stream of processing, where familiar phonemic patterns in speech have already been segregated from nonphonemic patterns. The middle portion of the STS and adjacent areas in the STG, bilaterally, have previously been implicated in the analysis of complex sounds, including speech (Zatorre et al., 1992; Mummery et al., 1999; Binder et al., 2000; Jancke et al., 2002), nonspeech vocalizations (Belin et al., 2000) and other familiar environmental sounds (Giraud and Price, 2001). The anterior portion of the STS, predominantly in the left hemisphere and extending further anteriorly compared to the area activated here, has been associated with sentence-level speech comprehension, including phonetic, semantic and syntactic analysis (Mazoyer et al., 1993; Schlosser et al., 1998; Scott et al., 2000; Humphries et al., 2001; Davis and Johnsrude, 2003; Narain et al., 2003; Dronkers et al., 2004). More ventral portions of the lateral temporal lobe, such as the middle and inferior temporal gyri, have been implicated repeatedly in lexical–semantic processing (Demonet et al., 1992; Vandenberghe et al., 1996; Binder et al., 1997; Dronkers et al., 2004). In considering these previous findings with the present results, we propose that the left middle and anterior STS, associated here with phonemic perception, represents an intermediate stage of processing in a functional pathway linking areas in bilateral dorsal STG and STS, presumably involved in the analysis of physical features of speech and other complex non-speech sounds, to areas in the left middle temporal gyrus and anterior STS that are engaged in higher-level (semantic, syntactic) linguistic processes.
Phonetic perception has long been thought to be lateralized to the left temporal lobe, based on early research in aphasia (Wernicke, 1874; Geschwind, 1970). However, more recent neuroimaging data suggest that the early analysis of the physical attributes of the speech signal occurs in dorsal STG and STS, bilaterally (Wise et al., 1991; Zatorre et al., 1992; Mummery et al., 1999; Belin et al., 2000; Binder et al., 2000; Hickok and Poeppel, 2000; Poeppel et al., 2004). It is only subsequent linguistic analysis, involving anterior STS, middle temporal gyrus and posterior temporoparietal regions, that has consistently been found to be left lateralized (Howard et al., 1992; Fiez et al., 1996; Binder et al., 1997; Mummery et al., 1999; Scott et al., 2000; Giraud and Price, 2001; Narain et al., 2003). In the present study, the left middle and anterior STS activation observed specifically with the phonemic sounds was strongly left-lateralized, suggesting that phonemic recoding may be the earliest stage of analysis of the speech signal that engages primarily the left temporal lobe.
Furthermore, the present result suggests the possibility that what underlies the left dominance for speech consonants in the temporal lobes is their categorical perception. It has been proposed that auditory regions in the left hemisphere are functionally specialized for the analysis of sounds with rapid spectrotemporal variations such as those found in speech consonants (Zatorre and Belin, 2001; Zatorre et al., 2002; Poeppel, 2003). However, the left hemisphere dominance observed here in the phonemic condition could not reflect such a functional specialization because the nonphonemic sounds contained spectrotemporal variations comparable to those of the phonemic sounds. Sounds containing more dynamic spectral information tend to be perceived more categorically (Eimas, 1963; Lane, 1965; Fujisaki and Kawashima, 1969; Studdert-Kennedy et al., 1970; Pisoni, 1975; Healy and Repp, 1982; Repp, 1984). Thus, it is possible that a functional specialization in left dorsal temporal auditory regions for spectrally dynamic sounds predisposes left STS regions for auditory categorical perception. Cross-linguistic neurophysiological studies showing left temporal lateralization in the processing of native as opposed to non-native phonetic sounds (Naatanen et al., 1997; Jacquemot et al., 2003) and recent evidence for left lateralization in the monkey temporal pole for species-specific calls (Poremba et al., 2004) are also in line with the concept of left temporal functional specialization for familiar sounds for which category representations have presumably developed. Finally, in the visual system, there is some psychophysical evidence to suggest that the left hemisphere is better than the right at categorical visuospatial tasks (Kosslyn, 1987; Brown and Kosslyn, 1993; Hellige, 1996; Slotnick et al., 2001), supporting the idea that a similar organization may exist in the auditory system.
Other areas activated in this study, including the anterior and posterior cingulate gyrus, the left and right thalamus, and the right cerebellum, have been observed in a number of studies using various language tasks, and across visual and auditory sensory modalities (Petersen et al., 1989; Raichle et al., 1994; Binder et al., 1997; Fiez and Raichle, 1997). Although their precise role in this task remains uncertain, some of these areas have been implicated in general functions such as monitoring of performance (Carter et al., 1998; Bush et al., 2000) and allocation of resources for complex neural computations (Keele and Ivry, 1990; Leiner et al., 1991), and their functions may therefore not be specific to phonemic processing.
In conclusion, this study provides converging evidence of a rostral stream of processing in the left temporal lobe that has segregated phonemic from nonphonemic information by the time the middle part of the left STS has been reached. This area may represent an intermediate stage of processing in a functional pathway linking areas in bilateral dorsal STG, presumably involved in the analysis of physical features of speech and other complex non-speech sounds, to areas in the left anterior STS and ventral temporal lobe in which meaning emerges from lexical, semantic and syntactic structure.
Appendix A
Synthesis parameters for the anchor points of the phonemic and the nonphonemic continua
| Time (ms) | F0 (Hz) | Intensity (dB) | Anchor 1 | Anchor 2 | ||||||||||||||||||||||||
|---|---|---|---|---|---|---|---|---|---|---|---|---|---|---|---|---|---|---|---|---|---|---|---|---|---|---|---|---|
| F1 | B1 | F2 | B2 | F3 | B3 | F1 | B1 | F2 | B2 | F3 | B3 | |||||||||||||||||
| (A) Phonemic | ||||||||||||||||||||||||||||
| 0 | 1189 | 82 | 550 | 52 | 850 | 77 | 2488 | 159 | 503 | 52 | 1639 | 77 | 2469 | 159 | ||||||||||||||
| 10 | 1153 | 82 | 600 | 72 | 950 | 100 | 2506 | 171 | 572 | 72 | 1598 | 100 | 2480 | 171 | ||||||||||||||
| 20 | 1144 | 83 | 650 | 72 | 1050 | 131 | 2523 | 185 | 639 | 72 | 1533 | 131 | 2423 | 185 | ||||||||||||||
| 30 | 1136 | 83 | 700 | 94 | 1150 | 152 | 2538 | 173 | 665 | 94 | 1468 | 152 | 2437 | 173 | ||||||||||||||
| 40 | 1138 | 83 | 730 | 105 | 1208 | 142 | 2563 | 151 | 699 | 105 | 1408 | 142 | 2416 | 151 | ||||||||||||||
| 50 | 1147 | 83 | 740 | 97 | 1212 | 132 | 2558 | 133 | 729 | 97 | 1376 | 132 | 2416 | 133 | ||||||||||||||
| 60 | 1153 | 83 | 737 | 94 | 1218 | 126 | 2564 | 108 | 737 | 94 | 1354 | 126 | 2422 | 108 | ||||||||||||||
| 70 | 1163 | 83 | 738 | 91 | 1281 | 130 | 2510 | 101 | 738 | 91 | 1281 | 130 | 2510 | 101 | ||||||||||||||
| 80 | 1172 | 82 | 742 | 91 | 1270 | 135 | 2526 | 90 | 742 | 91 | 1270 | 135 | 2526 | 90 | ||||||||||||||
| 90 | 1177 | 82 | 743 | 106 | 1257 | 162 | 2536 | 97 | 743 | 106 | 1257 | 162 | 2536 | 97 | ||||||||||||||
| 100 | 1186 | 81 | 746 | 102 | 1254 | 158 | 2551 | 90 | 746 | 102 | 1254 | 158 | 2551 | 90 | ||||||||||||||
| 110 | 1185 | 81 | 751 | 105 | 1249 | 163 | 2561 | 89 | 751 | 105 | 1249 | 163 | 2561 | 89 | ||||||||||||||
| 120 | 1191 | 81 | 753 | 102 | 1247 | 160 | 2563 | 97 | 753 | 102 | 1247 | 160 | 2563 | 97 | ||||||||||||||
| 130 | 1197 | 81 | 756 | 98 | 1243 | 155 | 2573 | 98 | 756 | 98 | 1243 | 155 | 2573 | 98 | ||||||||||||||
| 140 | 1211 | 80 | 754 | 94 | 1240 | 153 | 2570 | 89 | 754 | 94 | 1240 | 153 | 2570 | 89 | ||||||||||||||
| 150 | 1228 | 79 | 753 | 96 | 1239 | 157 | 2580 | 80 | 753 | 96 | 1239 | 157 | 2580 | 80 | ||||||||||||||
| (B) Nonphonemic | ||||||||||||||||||||||||||||
| 0 | 1189 | 82 | 794 | 52 | 850 | 77 | 1850 | 159 | 650 | 52 | 1639 | 77 | 3170 | 159 | ||||||||||||||
| 10 | 1153 | 82 | 744 | 72 | 950 | 100 | 1944 | 171 | 610 | 72 | 1598 | 100 | 3076 | 171 | ||||||||||||||
| 20 | 1144 | 83 | 694 | 72 | 1050 | 131 | 2038 | 185 | 590 | 72 | 1533 | 131 | 2982 | 185 | ||||||||||||||
| 30 | 1136 | 83 | 644 | 94 | 1150 | 152 | 2132 | 173 | 580 | 94 | 1468 | 152 | 2888 | 173 | ||||||||||||||
| 40 | 1138 | 83 | 614 | 105 | 1208 | 142 | 2226 | 151 | 575 | 105 | 1408 | 142 | 2794 | 151 | ||||||||||||||
| 50 | 1147 | 83 | 604 | 97 | 1212 | 132 | 2320 | 133 | 569 | 97 | 1376 | 132 | 2700 | 133 | ||||||||||||||
| 60 | 1153 | 83 | 607 | 94 | 1218 | 126 | 2414 | 108 | 581 | 94 | 1354 | 126 | 2606 | 108 | ||||||||||||||
| 70 | 1163 | 83 | 612 | 91 | 1281 | 130 | 2510 | 101 | 612 | 91 | 1281 | 130 | 2510 | 101 | ||||||||||||||
| 80 | 1172 | 82 | 608 | 91 | 1270 | 135 | 2526 | 90 | 608 | 91 | 1270 | 135 | 2526 | 90 | ||||||||||||||
| 90 | 1177 | 82 | 607 | 106 | 1257 | 162 | 2536 | 97 | 607 | 106 | 1257 | 162 | 2536 | 97 | ||||||||||||||
| 100 | 1186 | 81 | 604 | 102 | 1254 | 158 | 2551 | 90 | 604 | 102 | 1254 | 158 | 2551 | 90 | ||||||||||||||
| 110 | 1185 | 81 | 599 | 105 | 1249 | 163 | 2561 | 89 | 599 | 105 | 1249 | 163 | 2561 | 89 | ||||||||||||||
| 120 | 1191 | 81 | 597 | 102 | 1247 | 160 | 2563 | 97 | 597 | 102 | 1247 | 160 | 2563 | 97 | ||||||||||||||
| 130 | 1197 | 81 | 594 | 98 | 1243 | 155 | 2573 | 98 | 594 | 98 | 1243 | 155 | 2573 | 98 | ||||||||||||||
| 140 | 1211 | 80 | 596 | 94 | 1240 | 153 | 2570 | 89 | 596 | 94 | 1240 | 153 | 2570 | 89 | ||||||||||||||
| 150 | 1228 | 79 | 597 | 96 | 1239 | 157 | 2580 | 80 | 597 | 96 | 1239 | 157 | 2580 | 80 | ||||||||||||||
Intensity (in dB), pitch (in Hz), center frequency and bandwidth (in Hz) values for the first three formants of the anchor points of the phonemic (A) and nonphonemic (B) continua, sampled at 10 ms intervals. Values for the fourth and fifth formants were also used for sound synthesis but are not shown here. Abbreviations: F0, fundamental frequency; F1, F2, F3, center frequency of the first, second and third formants, respectively; B1, B2, B3, bandwidths of the first, second and third formants, respectively.
This work was supported by the National Institute for Deafness and Communication Disorders grant R01 DC006287 (E.L.), the National Institute for Neurological Diseases and Stroke grant R01 NS33576 (J.R.B.) and the National Institute of Health General Clinical Research Center M01 RR00058.
References
Belin P, Zatorre RJ, Hoge R, Evans AC, Pike B (
Belin P, Zatorre RJ, Lafaille P, Ahad P, Pike B (
Binder JR, Frost JA, Hammeke TA, Rao SM, Cox RW (
Binder JR, Frost JA, Hammecke TA, Cox RW, Rao SM, Prieto T (
Binder JR, Frost JA, Hammeke TA, Bellgowan PS, Springer JA, Kaufman JN, Possing ET (
Binder JR, Liebenthal E, Possing ET, Medler DA, Ward BD (
Burns EM, Ward WD (
Bush G, Luu P, Posner MI (
Carter CS, Braver TS, Barch DM, Botvinick MM, Noll D, Cohen JD (
Cox RW, Jesmanowicz A (
Davis MH, Johnsrude IS (
Demonet JF, Chollet F, Ramsay S, Cardebat D, Nespoulous JL, Wise R, Rascol A, Frackowiak R (
Dronkers NF, Wilkins DP, Van VR, Jr., Redfern BB, Jaeger JJ (
Edmister WB, Talavage TM, Ledden PJ, Weisskoff RM (
Eimas PD (
Eimas PD (
Fiez J, Raichle ME, Miezin FM, Petersen SE, Tallal P, Katz WF (
Fiez JA, Raichle ME, Balota DA, Tallal P, Petersen SE (
Fujisaki H, Kawashima T (
Giraud AL, Price CJ (
Giraud AL, Kell C, Thierfelder C, Sterzer P, Russ MO, Preibisch C, Kleinschmidt A (
Goto H (
Guenther FH, Husain FT, Cohen MA, Shinn-Cunningham BG (
Hall DA, Johnsrude IS, Haggard MP, Palmer AR, Akeroyd MA, Summerfield AQ (
Hall DA, Hart HC, Johnsrude IS (
Healy AF, Repp BH (
Hellige JB (
Hickok G, Poeppel D (
Hickok G, Buchsbaum B, Humphries C, Muftuler T (
Howard D, Patterson K, Wise R, Brown WD, Friston K, Weiller C, Frackowiak R (
Hugdahl K, Thomsen T, Ersland L, Rimol LM, Niemi J (
Humphries C, Willard K, Buchsbaum B, Hickok G (
Inan S, Mitchell T, Song A, Bizzell J, Belger A (
Jacquemot C, Pallier C, LeBihan D, Dehaene S, Dupoux E (
Jancke L, Wustenberg T, Scheich H, Heinze HJ (
Jonides J, Schumacher EH, Smith EE, Koeppe RA, Awh E, Reuter-Lorenz PA, Marshuetz C, Willis CR (
Keele SW, Ivry R (
Kluender KR, Diehl RL, Killeen PR (
Kosslyn SM (
Kuhl PK, Miller JD (
Lancaster JL, Woldorff MG, Parsons LM, Liotti M, Freitas CS, Rainey L, Kochunov PV, Nickerson D, Mikiten SA, Fox PT (
Leiner HC, Leiner AL, Dow RS (
Liberman AM, Harris KS, Hoffman HS, Griffith BC (
Liebenthal E, Binder JR, Piorkowski RL, Remez RE (
Mattingly IG, Liberman AM, Syrdal AK, Halwes T (
Mazoyer BM, Tzourio N, Frak V, Syrota A, Murayama N, Levrier O, Salamon G, Dehaene S, Cohen L, Mehler J (
Miller JD, Wier CC, Pastore RE, Kelly WJ, Dooling RJ (
Miyawaki K, Strange W, Verbrugge R, Liberman AM, Jenkins JJ, Fujimura O (
Mummery CJ, Ashburner J, Scott SK, Wise RJ (
Naatanen R, Lehtokoski A, Lennes M, Cheour M, Huotilainen M, Iivonen A, Vainio M, Alku P, Ilmoniemi RJ, Luuk A, Allik J, Sinkkonen J, Alho K (
Narain C, Scott SK, Wise RJ, Rosen S, Leff A, Iversen SD, Matthews PM (
Oldfield RC (
Pastore RE, Li XF, Layer JK (
Petersen SE, Fox PT, Posner MI, Mintum M, Raichle ME (
Pisoni DB (
Poeppel D (
Poeppel D, Guillemin A, Thompson J, Fritz J, Bavelier D, Braun AR (
Poremba A, Malloy M, Saunders RC, Carson RE, Herscovitch P, Mishkin M (
Raichle ME, Fiez JA, Videen TO, MacLeod AM, Pardo JV, Fox PT, Petersen SE (
Schlosser MJ, Aoyagi N, Fulbright RK, Gore JC, McCarthy G (
Scott SK, Blank CC, Rosen S, Wise RJS (
Seifritz E, Esposito F, Hennel F, Mustovic H, Neuhoff JG, Bilecen D, Tedeschi G, Scheffler K, Di Salle F (
Slotnick SD, Moo LR, Tesoro MA, Hart J (
Studdert-Kennedy M, Liberman AM, Harris KS, Cooper FS (
Talairach J, Tournoux P (
Vandenberghe R, Price C, Wise R, Josephs O, Frackowiak RS (
Vouloumanos A, Kiehl KA, Werker JF, Liddle PF (
Ward BD (
Ward BD (
Werker JF, Tees RC (
Wernicke C (
Wessinger CM, VanMeter J, Tian B, Van Lare J, Pekar J, Rauschecker JP (
Wise R, Chollet F, Hadar U, Friston K, Hoffner E, Frackowiak R (
Zatorre RJ, Belin P (
Zatorre RJ, Evans AC, Meyer E, Gjedde A (