


Abstract
Activation of the basal ganglia has been shown during the preparation and execution of movement. However, the extent to which the activation during movement is related to efferent processes or feedback-related motor control remains unclear. We used motor imagery (MI), which eliminates peripheral feedback, to further investigate the role of the subthalamic area in the feedforward organization of movement. We recorded local field potential (LPF) activity from the region of the subthalamic nucleus (STN) in eight patients with Parkinson's disease off dopaminergic medication during performance of a warned reaction time task. Patients were instructed to either extend the wrist [motor execution (ME)], to imagine performing the same task without any overt movement (MI), or, in a subgroup, to perform a non-motor visual imagery (VI) task. MI led to event-related desynchronization (ERD) of oscillatory beta activity in the region of the STN in all patients that was similar in frequency, time course and degree to the ERD occurring during ME. The degree of ERD during MI correlated with the ERD in trials of ME and, like ME, was accompanied by a decrease in cortico-STN coherence, so that STN LFP activity during MI was similar to that in ME. The ERD in ME and MI were both significantly larger than the ERD in VI. In contrast, event-related synchronization (ERS) was significantly smaller in trials of MI, and even smaller in trials of VI, than during ME. The data suggest that the activity in the region of the human STN indexed by the ERD during movement is related to the feedforward organization of movement and is relatively independent of peripheral feedback. In contrast, sensorimotor feedback is an important factor in the ERS occurring in the STN area after completion of movement, consistent with a role for this region in trial-to-trial motor learning or the re-establishment of postural set following movements.
Introduction
There is growing evidence from neurophysiological studies in patients undergoing functional neurosurgery that the basal ganglia are involved in the preparation of movement. Oscillations in the local field potentials (LFPs) of the subthalamic nucleus (STN) and globus pallidus are suppressed in the beta frequency band (13–35 Hz) prior to self- and externally paced voluntary movements, and following environmental cues informative of subsequent movement demands (Cassidy et al., 2002; Levy et al., 2002; Priori et al., 2002; Williams et al., 2003, 2005; Kühn et al., 2004; Doyle et al., 2005). In reaction-time tasks, the timing of the reduction in power of beta activity in the STN precedes and positively correlates with both the mean reaction time across patients (Kühn et al., 2004) and the reaction time across single trials within a single patient (Williams et al., 2005). Similarly, in self-paced movements, the onset of suppression of beta oscillations in STN can be used to predict the timing of subsequent voluntary movements online (Loukas and Brown, 2004).
There is even stronger evidence that the basal ganglia are active during movement. The suppression of beta LFP power in STN is most marked during this period (Cassidy et al., 2002; Levy et al., 2002; Kühn et al., 2004; Doyle et al., 2005). Studies of the discharge of single neurons in the basal ganglia also emphasize changes after movement onset (Georgopoulos et al., 1983; Anderson and Horak, 1985; Alexander and Crutcher, 1990; Crutcher and Alexander, 1990; Kimura, 1990; Mink et al., 1991; Cheruel et al., 1994, 1996; Wichmann et al., 1994; Jaeger et al., 1995). Together these findings suggest that much of the activity in the basal ganglia is concerned with aspects of the control of ongoing movement, including the modification of movement in response to peripheral feedback (DeLong et al., 1984). Thus single neurons in the STN can be strongly activated by passive limb movement (Rodriguez-Oroz et al., 2001), and deranged online correction of movements in the light of peripheral feedback has been reported in diseases of the basal ganglia (Angel et al., 1971; Smith et al., 2000; Desmurget et al., 2004). So how much of the activity in the STN during movement is efferent and related to the organization of movement as it occurs (Jueptner and Weiller, 1998), and how much is fed-back in nature and related to the online correction of ongoing movement (Smith et al., 2000)? Neither behavioural nor imaging studies adequately address this point in studies of humans. Although movement is impaired following lesions of the basal ganglia, and in Parkinson's disease, this does not tell us whether the impairment of performance is due to diminished preparation (Doyle et al., 2005), rather than deficient online control of movement (Angel et al., 1971), or even impaired trial-to-trial learning (Brainard and Doupe, 2000). Similarly, functional imaging studies have had difficulty in distinguishing motor preparation from movement, and have, with one exception, been unable to resolve the STN (Lehéricy et al., 2005). To investigate the extent to which STN activity during movement relates to efferent or feedback processes we need both the spatial and temporal resolution afforded by direct recordings of STN activity in patients undergoing functional neurosurgery and a paradigm that obviates the effects of peripheral feedback.
Motor imagery (MI) is defined as a mental rehearsal of a motor act without any overt movement (Jeannerod, 1995) and has recently been used to study motor processing while eliminating components due to peripheral sensory feedback. During MI the subject may either feel themselves performing a given action, so-called kinaesthetic or internal imagination, or produce a visual mental image of the movement, visual or external imagination (Jeannerod, 1995; Decety, 1996). It is kinaesthetic imagery that has been more closely associated with motor processing and involves a similar neuronal network to motor execution (ME). Numerous studies using EEG, MEG and functional imaging have revealed evidence for activation of common cortical motor and basal ganglia areas during MI and ME (EEG: Beisteiner et al., 1995; Pfurtscheller and Neuper, 1997; MEG: Schnitzler et al., 1997; fMRI: Stephan et al., 1995; Lotze et al., 1999; Solodkin et al., 2004; PET: Decetey et al., 1988, 1994; Stephan and Frackowiak, 1996; Thobois et al., 2000; Cunnington et al., 2001). That common processes may be involved in MI and ME is also suggested by the increased corticospinal excitability during MI as revealed by TMS (Hashimoto and Rothwell, 1999; Abbruzzese et al., 1999; Fadiga et al., 1999; Stinear and Byblow, 2003).
Here we directly record neuronal activity from the subthalamic region in patients with Parkinson's disease during cued kinaesthetic MI and voluntary movement. We hypothesized that if STN was active in the feedforward efferent organization of movement as it occurs then the suppression of beta frequency band LFP activity in the STN area during MI should match that during ME whereas STN LFP activity changes due to feedback-related processing should be restricted to ME. The results argue that feedforward- and feedback-related processing in the STN area dominates during and after movement, respectively.
Material and methods
Patients and surgery
Eight patients with Parkinson's disease (five males, mean age 57 ± 3 years [mean ± SE], disease duration 11 ± 1 years) who were selected for bilateral implantation of deep-brain electrodes in the STN participated in the study. Their clinical details are summarized in the Table 1. Handedness was assessed using the Edinburgh, Oldfield, Handedness Inventory (Oldfield, 1971). All patients took part with informed consent and the permission of the local ethics committees. Patients underwent simultaneous bilateral implantation of DBS-electrodes in the STN. The DBS-electrode used was model 3389 (Medtronic Neurological Division, Minneapolis, MN, USA) with four platinum–iridium cylindrical surfaces (1.27 mm diameter and 1.5 mm length) and a contact-to-contact separation of 0.5 mm. Contact 0 was the most caudal and Contact 3 was the most rostral. The surgical procedure has been described in detail previously (Kühn et al., 2005). The intended coordinates for the target point were 12 mm lateral from the midline, 3 mm behind the midcommissural point and about 4 mm below the AC–PC line. The stereotactic coordinates for each patient are given in Table 2. In Patients 1–6 operated at the Departments of Neurology and Neurosurgery at the University Hospital Charité, Campus Virchow in Berlin, the calculation of target coordinates was based on ventriculography and direct visualization of the STN in the individual stereotactic T2-weighted MRI. Intra-operative recordings were made with the TREC scanner electrophysiological neuronavigation system using a tetrode (Thomas RECORDING, Giessen, Germany) to identify the STN intra-operatively. Patients 7 and 8 were operated at the National Hospital for Neurology and Neurosurgery in London using the individual stereotactic 2-mm slice T2-weighted MRI for direct visualization of STN (Hariz et al., 2003), but without microelectrode recordings. DBS-electrode location was confirmed in all patients by intra-operative direct macrostimulation and immediate post-operative stereotactic MRI. Furthermore, following surgery, post-operative unified Parkinson's disease rating scale (UPDRS) motor scores off drugs, on DBS were 56.2 ± 5.0% improved compared to off drugs, off DBS in those patients in whom these data were available (all except Case 4) and the levodopa-equivalent dose was consequently reduced from pre-operative values (mean reduction 64.7 ± 11.2% at ∼6 months after surgery), providing further evidence of efficacy.
Summary of patient details
| Case | Age (years) and sex | Disease duration (years) | Predominant symptoms | Surgical centre | Motor UPDRS On–Off drugs pre-op | Stimulation parameters during therapeutic DBS (monopolar except for indicated cases) | Contacts located in STN according to post-op MRI | Contact pair used for analysis/ location in MRI | Medication (daily dose) pre-op |
|---|---|---|---|---|---|---|---|---|---|
| 1 | 57 M | 17 | Tremor, On–Off fluctuations, dyskinesias | Berlin | 18/39 | R: 2.0 V, 60 μs, 130 Hz, 0-,1- | R: 0,1 | R: 23/ZI,Th | Levodopa 600 mg |
| L: 2.5 V, 60 μs, 130 Hz, 0-,1- | L: 0,1 | L: 23/ZI,Th | Amantadine 300 mg | ||||||
| 2 | 52 M | 13 | On–Off fluctuations, dyskinesias | Berlin | 11/41 | R: 2.0 V, 60 μs, 130 Hz, 1-,2- | R: 1,2 | R: 12/STN | Levodopa 650 mg |
| L: 2.0 V, 60 μs, 130 Hz, 1-,2- | L: 1,2 | L: 12/STN | Entacapone 800 mg | ||||||
| Amantadine 200 mg | |||||||||
| Cabergoline 12 mg | |||||||||
| 3 | 67 F | 13 | On–Off fluctuations, freezing | Berlin | 10/21 | R: 3.4 V, 60 μs, 150 Hz, 0- | R: 0,1 | R: 01/STN | Levodopa 700 mg l |
| L: 3.4 V, 60 μs, 150 Hz, 0- | L: 0,1 | L: 12/STN,ZI | Cabergoline 3 mg | ||||||
| 4 | 43 M | 5 | On–Off fluctuations, hyperkinesias | Berlin | 19/41 | R: 1.0 V, 60 μs, 130 Hz, 1- | R: 0,1 | R: 01/STN | Levodopa 1200 mg l |
| L: 1.0 V, 60 μs, 130 Hz, 1- | L: 0,1 | L: 12/STN,ZI | Amantadine 100 mg | ||||||
| Ropinirole 12 mg | |||||||||
| 5 | 51 M | 6 | On–Off fluctuations, hyperkinesias | Berlin | 15/40 | R: 2.3 V, 60 μs, 130 Hz, 2- | R: 0,1,2 | R: 23/STN,ZI | Levodopa 800 mg l |
| L: 3.2 V, 60 μs, 130 Hz, 2- | L: 0,1,2 | L: 12/STN | Cabergoline 8 mg | ||||||
| 6 | 63 F | 12 | On–Off fluctuations, freezing | Berlin | 16/51 | R: 1.5 V, 60 μs, 130 Hz, 1- | R: 0,1 | R: 23/ZI,Th | Levodopa 500 mg |
| L: 2.8 V, 60 μs, 130 Hz, 0- | L: 0,1,2 | L: 12/STN | Pramipexol 2.1 mg | ||||||
| Entacapone 1600 mg | |||||||||
| Amantadine 200 mg | |||||||||
| 7 | 58 M | 10 | On–Off fluctuations, freezing | London | 4/40 | R: 1.5 V, 60 μs, 130 Hz, 1- | R: 0,1 | R: 12/STN,ZI | Levodopa 800 mg l |
| L: 1.8 V, 60 μs, 130 Hz, 0- | L: 0,1 | L: 01/STN | Cabergoline 2 mg | ||||||
| 8 | 63 F | 13 | On–Off fluctuations, dyskinesias | London | 3/32 | R: 2.1 V, 60 μs, 130Hz, 1- | R: 0,1,2 | R: 12/STN l | Levodopa 1300 mg |
| L: 2.1 V, 60 μs, 130 Hz, 3- | L: 1,2,3 | L: 23/STN | Cabergoline 3 mg | ||||||
| Amantadine 200 mg |
All had bilateral STN implantation.
Target coordinates for all patients according to anterior commissural–posterior commissural (AC–PC) line and midcommissural point (MCP)
| Target coordinates | Case | ||||||||||||||
|---|---|---|---|---|---|---|---|---|---|---|---|---|---|---|---|
| 1 | 2 | 3 | 4 | 5 | 6 | 7 | 8 | ||||||||
| Right hemisphere | X = 12 Y = 2 Z = 3.5 | X = 12 Y = 1.9 Z = 5.3 | X = 12 Y = 2 Z = 3.5 | X = 12 Y = 2 Z = 3.5 | X = 12 Y = 2 Z = 4 | X = 12 Y = 2.2 Z = 3.7 | X = 11 Y = 1 Z = 5 | X = 10 Y = 0 Z = 5 | |||||||
| Left hemisphere | X = 11.9 Y = 1.9 Z = 3.5 | X = 12 Y = 1.8 Z = 5.4 | X = 11.9 Y = 1.9 Z = 3.6 | X = 12 Y = 2 Z = 3.5 | X = 12 Y = 2 Z = 4 | X = 12 Y = 2.4 Z = 4 | X = 11 Y = 1 Z = 5 | X = 10 Y = 0 Z = 5 | |||||||
X = lateral from midline; Y = posterior from MCP; Z = ventral to AC–PC line.
Paradigm
Subjects were seated in a chair and recorded while performing a warning-go reaction time task. Each trial started with the presentation of a fixation cross at the centre of a portable PC screen, followed by a 500 ms duration warning signal (black outline circle at the centre of the screen). Two to three seconds after the onset of the warning cue a 500 ms duration imperative go signal appeared at the centre of the screen (grey filled circle). Patients were instructed to either perform the actual movement, which was a single fast extension of the wrist of the dominant hand, or to imagine performing the same task without any movement. Subjects were specifically instructed to try to feel the movement rather then to visualize it (kinesthaetic motor imagination, MI). In a subgroup of patients (n = 5) an additional control condition was introduced where, upon occurrence of the imperative go signal, subjects had to perform a non-motor-related visual imagination task, which was to imagine the face of a relative (visual imagination, VI). Conditions were performed using a block design consisting of two blocks for each condition that were pseudo-randomized. Each block consisted of 15–20 trials giving a mean total number of 36 ± 1 (mean ± SEM) trials per condition. Subjects were instructed to perform tasks as quickly as possible after appearance of the imperative go signal. Inter-trial duration varied between 12.5 and 15.5 s, limiting prediction of the timing of the warning cue. Each subject performed a short practice run before the recordings were started. At the end of the study patients were asked to estimate the proportion of trials in which they were successfully able to perform MI and VI. Estimates for all subjects exceeded 50% of trials.
Recordings
Recordings were made after overnight withdrawal of dopaminergic medication in all patients, except for Patient 8 who was recorded 5 h after the last dose of levodopa. We elected to study the patients after withdrawal of dopaminergic medication to avoid levodopa-induced involuntary movements which might have impaired MI and led to confounding EMG activity during records. STN LFPs were recorded bipolarly from the four adjacent contacts of each DBS-electrode (contact pairs 01, 12, 23). In parallel, surface EEG was recorded from midline electrodes (Fz, Cz of the International 10/20 system) using Ag/AgCl scalp electrodes in Patients 1–5. More extensive scalp EEG recordings were limited due to surgical dressings. EEG electrode positions were chosen on the basis of previous studies showing consistent STN-EEG coherence in the beta band over midline EEG electrodes (Marsden et al., 2001; Williams et al., 2002; Fogelson et al., 2005). Signals were cut-off filtered above 200–300 Hz and below 1 Hz and amplified (×50 000) using a custom-made, 9 V battery-operated portable high-impedance amplifier (which had as its front end input stage the INA128 instrumentation amplifier, Texas Instruments, Inc., Dallas, TX, USA) in Berlin or using a D150 amplifier (Digitimer Ltd, Welwyn Garden City, Hertfordshire, UK) in London. Signals were sampled at 1000 Hz and recorded through a 1401 A-D converter (Cambridge Electronic Design, Cambridge, UK) onto a computer using Spike2 software (Cambridge Electronic Design) and monitored online. EMG activity was recorded bilaterally from the extensor carpi ulnaris (ECU) muscle during all trials to monitor the motor response during ME and verify muscle relaxation during the imagination tasks. EMG was picked up with Ag/AgCl surface electrodes, filtered at 10 Hz –3 kHz, amplified (×1000) and recorded through the 1401 A-D converter (Cambridge Electronic Design). Figure 1A shows an example of STN LFPs and EMG recorded from 1 s before to 2.5 s after the imperative go signal in Patient 6 during ME (upper panel) and MI (lower panel).
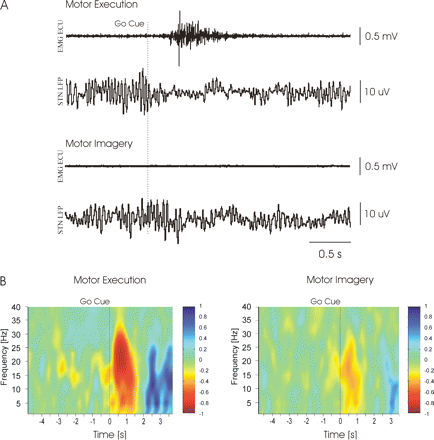
Examples of data in Case 6. (A) Raw EMG from right extensor carpi ulnaris muscle (EMG ECU) and LFP (low-pass filtered at 45 Hz) recorded from left STN area during single trials of ME (upper traces) and MI (lower traces). Beta activity is reduced during both ME and MI. No EMG activity occurred during MI. (B) Time–frequency plots of STN LFPs averaged around the imperative go cue (at time 0) during ME and MI. Positive and negative colour changes represent power increases and suppressions, respectively. Power is normalized to baseline (period –5 to –3 s prior to the imperative cue) and in arbitrary units. Note that the maximum ERD occurred at similar frequencies within the beta band during ME and MI.
Analysis
All recordings were down-sampled in Spike2 (CED, Cambridge, UK) to 500 Hz. For each DBS-electrode the contact pair that displayed the maximum beta power (13–35 Hz) was analysed for each side in each patient (8 patients, 16 sides). Peak beta power is associated with electrode placement in STN (Levy et al., 2002; Priori et al., 2002, 2004; Kühn et al., 2004; Doyle et al., 2005). In particular, recent findings using microelectrode recordings in Parkinson's disease patients have shown a significant increase in LFP beta activity upon entering the STN (Kühn et al., 2005), in line with findings made using semi-microelectrodes in 6-OHDA midbrain lesioned parkinsonian rodents (Sharott et al., 2005). Trials containing mains noise or movement artefacts were discarded following visual inspection. Trials of ME in which the patient failed to respond, responded prematurely, or trials of MI or VI showing EMG activity were excluded from further analysis, leaving an average of 29 ± 1 trials per condition for analysis. Event-related changes in power and coherence were calculated in trials of 9 s length including 2 s before the warning cue and 4 s after the imperative go cue. LFP activity was analysed in the beta frequency band, aligned to the imperative go cue and averaged across trials per condition.
Spectra were estimated using the discrete Fourier transform as outlined in Halliday et al. (1995) and Brown (2000). STN LFP and EEG data were assumed to be realizations of stationary, zero-mean time series and to satisfy a mixing condition, whereby sample values widely separated in time were independent (Brillinger, 1981). Records were divided into a number of sections of equal duration with a block size of 256 data points, affording a frequency resolution of 1.95 Hz. Spectra were estimated by averaging across sections and a Hanning window filter was used. Blocks were shifted by 100 ms and averaged again until the whole record length had been analysed (using a modified Spike2 script). An example of a time–frequency plot is given in Fig. 1B. The event-related desynchronization (ERD) and synchronization (ERS) were defined as the percentage power decrease (ERD) or power increase (ERS) in relation to the baseline period 2 s prior to the warning cue. Time–frequency plots were computed for all values at ∼2 Hz frequency intervals within the beta range (13–35 Hz). The frequency band that displayed the maximum ERD within 1 s of the imperative go cue in trials of ME was chosen for further analysis, together with the adjacent frequency band on either side, giving an individually defined beta band averaged across ∼6 Hz in each patient. The same individually defined beta band ±2 Hz was used for analysis in trials for MI and VI (in some cases the band was shifted by 2 Hz if the maximum ERD occurred at slightly higher or lower frequencies during MI or VI). ERD values were averaged across a time period of 500 ms centred on the peak ERD occurring within 1 s after the go cue in each patient. This individualized timing was chosen on the basis of previous results showing that ERD latency is related to reaction time, which in turn varies across subjects (Kühn et al., 2004; Williams et al., 2005). The time course of the ERS was assessed by averaging percentage power changes in four consecutive periods, 1–4, of 500 ms, starting from 500 ms after the maximum ERD. Additionally, the maximum ERS was calculated for the time period of 500 ms centred on the individual peak ERS occurring within the above-defined 2 s post-movement period for each condition. Values for ERD/ERS during MI and VI were calculated for the same time periods as defined during ME. We also subdivided the beta band into low (13–20 Hz) and high (21–35 Hz) beta activities to compare the reactivity in the two sub-bands during ME and MI (Priori et al., 2002, 2004; Foffani et al., 2005). Mean ERD and ERS values were calculated using the individually defined 2 Hz bands that showed the maximum ERD in the low and high beta sub-bands. We assessed ERD/ERS in LFPs recorded from both STN in each patient irrespective of contralateral or ipsilateral task performance, as no effect of laterality has been shown for ERDs related to movement (Williams et al., 2003; Doyle et al., 2005).
We further calculated event-related changes in coherence between the contact pair of each DBS-electrode that displayed the maximum beta activity and EEG electrodes over cortical midline areas to estimate linear coupling between these areas during task performance. Data blocks, time shifts and frequency resolution were the same as used for ERD assessment. Event-related coherence was normalized using the Fisher transformation of the coherence prior to statistical analysis.
To confirm that the beta activity recorded from the DBS-electrodes was locally generated within the STN area (Dinner et al., 2002; Levy et al., 2002; Amirnovin et al., 2004; Kühn et al., 2005) rather than being a product of volume conduction from the cerebral cortex (Wennberg and Lozano, 2003), we calculated the gradient of beta power over the contact pairs in rest recordings (all patients, 16 STN). Volume conduction from cortex would lead to either an equal distribution of LFP power across contact pairs in each DBS-electrode or show a decrement at contacts more distant from the cortical source. We also sought polarity reversal in the beta band across the contact pairs of each DBS-electrode as further evidence of a local dipole.
All percentage values of ERD/ERS were normally distributed as confirmed by the one-sample Kolmogorov–Smirnov test. Changes from baseline were assessed by two-tailed one-sample Student's t-test. ERDs following go cues were compared in ME and MI by two-tailed, paired Student's t-tests. ERS data were analysed using a 2 (‘condition’: ME and MI) × 4 (‘time’: ERS1, ERS2, ERS3, ERS4) repeated-measure ANOVA (analysis of variance) (SPSS, Inc., Chicago). In a subgroup of patients (1–5), ERD and maximum ERS values were compared between three conditions (ME, MI and VI) using an ANOVA. The STN LFP-EEG coherence after the imperative go cue was compared to that at baseline using a 2 (‘condition’: ME and MI) × 2 (‘time’: baseline, post-go cue) repeated-measure ANOVA. Post hoc two-tailed, paired Student's t-test (using stepwise correction for multiple comparisons) was performed to determine relevant differences in event-related power and coherence changes. Means ± SEMs are given in the text.
Results
Behavioural data
Mean reaction time for ME with the dominant hand was 343 ± 46 ms. Mean combined error rate for errors of omission and premature responses during ME was 14.7 ± 3%. Individual rating of successful performance of trials during MI and VI was 63.4 ± 3.7 and 61.0 ± 4.0%, respectively.
Beta activity changes during motor execution and motor imagery
Figure 2A shows the grand average of the normalized individual beta power averaged across all patients from 2 s before the warning cue to 4 s after the imperative go cue during ME and MI, respectively. Data are expressed as percentage of baseline activity taken from 2 s prior to the warning cue. Both averaged data for ME and MI trials showed significant beta ERDs following imperative go cues (P < 0.001). This general picture was confirmed in all individual patients. There was no difference between the beta ERD following the go cue in trials of MI (36.7 ± 4.5%) and that in trials of ME (44.6 ± 6.4%; P = 0.131; Fig. 2B). Neither was there a significant difference in the frequency band that displayed the maximum ERD between trials of ME and MI (mean frequencies ME: 25.5 ± 1.3 Hz; MI: 24.4 ± 1.2 Hz. In addition, there was a positive correlation between the ERD in trials of ME and MI (Pearson correlation, r = 0.645, P = 0.007, Fig. 3). In the averaged data (n = 16 sides) the mean ERD onset during ME preceded the mean reaction time, confirming previous results (Kühn et al., 2004). For both conditions ME and MI significant ERDs following the go cue occurred within the low and high beta band (P < 0.001). There was no difference between the maximum ERD calculated in the low beta band (ME 49.5 ± 6.6%; MI 37.7 ± 5.2%) and that in the high beta band (ME 53.7 ± 6.6%; MI 43.9 ± 4.7%; P = 0.395, P = 0.209, respectively).
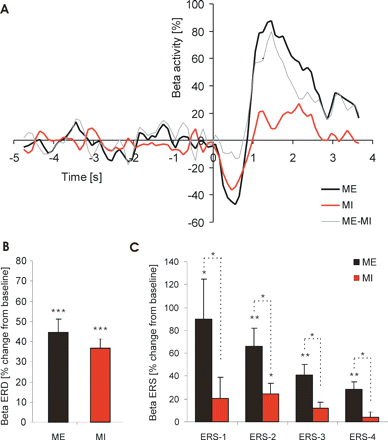
Data averaged across subjects. (A) Grand average (n = 8 patients) of the beta ERD during ME and MI and the ME–MI difference, expressed as percentage change from baseline mean calculated from the period –5 to –3 s prior to the imperative cue at t = 0 s. The ERD following the imperative go cue is similar during both ME and MI, although trials of ME are terminated by a much larger ERS. Mean values for beta ERD (B) and beta ERS (C) during ME and MI. ERS was subdivided into four consecutive intervals (ERS 1–4, each 500 ms duration) beginning 500 ms after the maximum ERD. *P ≤ 0.05, **P ≤ 0.01, ***P ≤ 0.001 (two-tailed one-sample and paired t-tests).
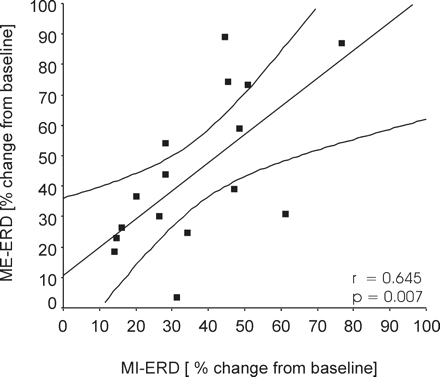
Correlation between the beta ERD during ME and MI across the eight patients (16 sides).
To analyse the time course of the beta ERS during ME we subdivided the post-movement time period into four consecutive intervals (ERS 1–4, each 500 ms duration) beginning 500 ms after the maximum ERD. The same intervals were used for trials of MI. A significant ERS with respect to the 2-s baseline before the warning cue was found for all time periods in ME, whilst during MI the ERS reached significance only during ERS 2 (Fig. 2C; one-sampled, two-tailed Student's t-test, stepwise correction for multiple comparisons). To compare ME with MI, a repeated-measure ANOVA was performed using factor ‘condition’ (ME versus MI) and ‘time’ (ERS 1–4). This showed a significant effect for the factor ‘condition’ [F(1, 15) = 17.155, P = 0.001] and a significant interaction between ‘condition’ and ‘time’ [F(3, 45) = 3.597, P = 0.044]. Post hoc comparisons revealed a larger ERS during all time periods for trials of ME compared to MI (Fig. 2C). Correspondingly, the individually defined maximum ERS within this 2-s time period was larger during ME (117.4 ± 31.1%) than during MI (47.2 ± 16.8%, P = 0.002).
Similarly there were significant ERSs in both beta sub-bands with respect to baseline in trials of ME, but not in MI. In the low beta sub-band ERS occurred in ME during ERS intervals 3 and 4 and in the high beta sub-band during ERS intervals 1, 2 and 3 (one-sampled, two-tailed Student's t-test, stepwise correction for multiple comparisons). To compare the ERS between low and high beta sub-bands in trials of ME, we performed a repeated-measure ANOVA using factors ‘frequency’ (low versus high beta) and ‘time’ (ERS 1–4). There was a significant effect for ‘frequency’ [F(1,15) = 8.516; P = 0.011] and a significant interaction between ‘frequency’ and ‘time’ [F(3,45) = 8.806; P < 0.001']. Post hoc analysis showed a larger ERS in the high beta band during time period 1 and 2 (low beta 6.4 ± 9.2%, high beta 59.5 ± 19.1%, P = 0.009; low beta 16.5 ± 8.9%, high beta 51.1 ± 12.2%, P = 0.008; paired two-tailed Student's t-test, stepwise correction for multiple comparisons).
It has been previously shown that the movement-related STN power suppression in the beta frequency band is accompanied by a decrease in coherence between STN LFP activity and EEG in the same band (Cassidy et al., 2002). Accordingly, we contrasted the event-related changes in STN-EEG coherence after the go cue during ME and MI (Fig. 4). Repeated-measure ANOVA using factor ‘condition’ (ME versus MI) and ‘time’ (baseline versus post-go cue) revealed an effect for ‘time’ [F(1, 9) = 12.213, P = 0.007] and a significant interaction between ‘condition’ and ‘time’ [F(1, 9) = 5.335, P = 0.046]. Post hoc comparisons revealed a decrease in STN-EEG coherence after the go cue during ME (coherence 0.037 ± 0.005; P = 0.02) and MI (coherence 0.045 ± 0.004; P = 0.044) compared to baseline (coherence ME 0.065 ± 0.009; coherence MI 0.063 ± 0.008). The decrease in coherence was significantly more pronounced during ME compared to MI (P = 0.03).
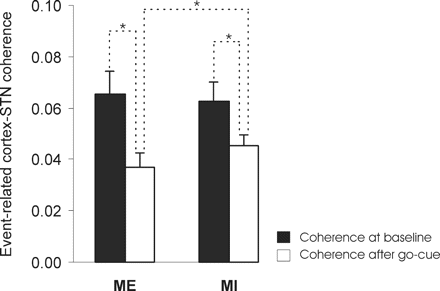
Mean Fisher-transformed coherence between STN LFP and EEG during ME and MI (white columns) and at baseline (black columns) in five subjects. Note that coherence between cortex and the STN area is significantly reduced during task performance. *P < 0.05.
Beta activity changes during motor imagery and non-motor imagery
In a subgroup of patients (n = 5), a visual imagery (VI) task was performed to control for non-motor-related activity changes in the beta band. The beta frequency band power in trials of VI was averaged across subjects for the same time period as defined for the ME-ERD and MI-ERD (Fig. 5). A significant ERD occurred in trials of ME (48.7 ± 8.3%; P < 0.001) and MI (40.1 ± 6.3%; P < 0.001), and a smaller but still significant ERD occurred in trials of VI (16.8 ± 7.2%; P = 0.003; one-sample, two-tailed t-test). A repeated-measure ANOVA with factor ‘condition’ (three levels: ME, MI, VI) revealed a significant effect of task condition [F(2,18) = 16.352, P < 0.001]. Post hoc analysis confirmed that the mean ERDs in trials of ME and MI were significantly larger than in VI (P = 0.001 and P < 0.001, respectively).
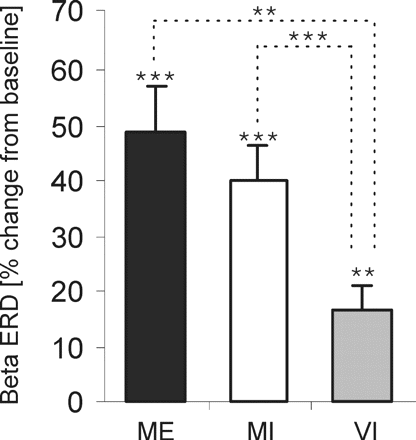
Comparison of mean ERD in ME, MI and non-motor (VI) in five subjects. Beta ERD is significantly smaller in VI than ME or MI. **P ≤ 0.01, ***P ≤ 0.001 (two-tailed one-sample and paired t-tests).
The individually defined maximum ERS was also compared to baseline. A significant ERS occurred in trials of ME (159.2 ± 44.8%; P = 0.018). However, during MI the ERS was no longer significant after stepwise correction for multiple comparisons (59.3 ± 25.7%; P = 0.069), while during VI there was only a small and insignificant ERS (18.7 ± 9.5%; P = 0.081). A repeated-measure ANOVA (factor ‘condition’ with three levels: ME, MI and VI) was used to determine differences between the ERS in each condition. This revealed a significant effect of task condition [F(2,18) = 14.359, P = 0.002]. Post hoc analysis showed that the ERS in trials of ME and MI were significantly larger than in VI (P = 0.006 and P = 0.042, respectively).
Origin of LFP beta activity
For each DBS-electrode, beta power showed a well-defined maximum at one contact pair. This maximum was arbitrarily distributed between contact pairs (3 × STN 01; 8 × STN 12; 5 × STN 23) with a mean gradient of beta power at the remaining contact pairs of 57.5 ± 4.5%, giving further evidence of its local origin. Furthermore, in 5 out of 16 DBS-electrodes we found polarity reversal of the signal within the beta band (3 × Contact 1; 2 × Contact 2).
In 13 out of 16 macroelectrodes (81%) the contact pair that displayed maximum beta power (and consequently was used for analysis) included at least one contact that most likely lay within STN according to the post-operative MRI (blinded evaluation by MIH). In the three remaining macroelectrodes the maximum beta power occurred at more dorsal contacts, presumably located in the dorsal zona incerta or adjacent thalamus. Furthermore, in 11 out of 16 macroelectrodes (69%) the contact pair that displayed maximum beta power included at least one contact that was used during continuous high frequency stimulation (DBS parameters were selected blinded to the LFP data).
Discussion
MI of a wrist extension movement led to a pattern of suppression of STN LFP activity in the beta frequency band in Parkinson's disease patients that was very similar to that accompanying voluntary execution of the same movement. Mean suppression in the beta band was matched in frequency, time course and degree between MI and ME, and the amount of beta ERD during MI positively correlated with the movement-related drop in beta power. The ERD in both conditions was also accompanied by a decrease in coherence between cortex and the STN area in the beta band. Thus, the STN area was active during motor processing without changes in peripheral feedback: strong support for the hypothesis that this basal ganglia nucleus is active in the feedforward organization of movement as it occurs and is relatively less active as a consequence of feedback processes during movement, such as those related to the online correction of movement.
The above interpretation rests on two major assumptions. First, can systematic changes in beta frequency band oscillations in the STN LFP be considered an adequate marker of motor processing in the STN? To answer this we must consider both the evidence that beta frequency band activity is local to STN and that it reflects motor processing. Post-operative MRI suggested placement of at least one of the two contacts responsible for peak beta power within STN in over 80% of sides. Moreover, gradients of beta power and polarity reversal were indicative of a local source and several previous studies have linked subthalamic LFP activity in the beta band to a source in the STN itself (Levy et al., 2002; Priori et al., 2002, 2004; Kühn et al., 2004, 2005; Doyle et al., 2005). Thus, our results suggest that movement-related changes in beta activity reflect local neuronal oscillatory activity in the STN area, including the STN itself. As to the relationship between STN LFP activity in the beta frequency band and motor processing, event-related beta suppression in basal ganglia LFPs has been observed prior to and during movement and its onset latency has been positively correlated with reaction time in motor tasks (Cassidy et al., 2002; Levy et al., 2002; Priori et al., 2002; Brown, 2003; Sochurkova and Rektor, 2003; Kühn et al., 2004; Doyle et al., 2005; Williams et al., 2005). Furthermore, warning cue-related suppressions of beta activity depend upon the cues' predictive value with respect to following imperative cues, corroborating the relationship between the suppression of beta activity and motor demands (Williams et al., 2003). With regard to the present experiments it is important to note that beta suppression was significantly larger during both MI and ME than in non-motor imagery (VI) in the same subjects. Similarly, delayed beta synchronization was significantly larger in ME than MI and was insignificant in VI. Thus, activity changes due to non-specific attentional shifts, alerting responses to visual input or task-related cognitive demand unrelated to motor processing were likely to have made relatively little contribution to the observed effects during MI and ME. Although the ERD in trials of VI reached significance, it was small and similar to that described previously for beta power changes occurring in response to non-informative warning cues (Williams et al., 2003). We conclude that STN LFP changes provide a reasonable general marker of motor processing in the STN area, although they will not resolve processing within STN that is highly spatially restricted.
Secondly, to what extent are our findings relevant to basal ganglia function other than in Parkinson's disease? We were only able to perform the study in Parkinson's disease patients, so that the observed effects might have been influenced by the disease, surgical procedure or drug therapy. However, although synchronization in the beta band is likely enhanced in parkinsonism (Nini et al., 1995; Silberstein et al., 2003; Sharott et al., 2005), it may still be present, albeit in attenuated form, under physiological conditions (reviewed in Brown, 2003) and movement-related desynchronization of beta activity has been shown in the putamen of an epilepsy patient without movement abnormalities (Sochurkova and Rektor, 2003). Moreover, systematic changes in beta band synchronization related to motor processing are likely to be a phenomenon of the basal ganglia-cortical loop, as suggested by the changes in the coherence between the STN LFP and cortical EEG, and beta frequency band ERD and ERS are a consistent finding at the cortical level in healthy subjects engaged in voluntary movement (Pfurtscheller, 1981; Toro et al., 1994; Crone et al., 1998).
Role of the STN area in efferent motor processing during movement execution
The striking similarity between the ERD in MI and ME suggests that much of the activity in the region of the STN in the human during movement is efferent and related to the organization of movement as it occurs (Jueptner and Weiller, 1998), rather than being fed back in nature and related to the online correction of ongoing movement (Smith et al., 2000). The same is also likely true of the interaction between activity in the STN region and that in mesial cortical areas. Thus, coherence between the two dropped in both ME and MI. Imaging studies have suggested that activation of mesial cortical areas is also similar in ME and MI (Lotze et al., 1999; Solodkin et al., 2004), so that feedforward efferent control of movement during ME may be a function of basal ganglia-frontal cortical circuits as a whole. This is in addition to the feedforward motor processing reflected in changes in basal ganglia LFP power and basal ganglia LFP-EEG coherence prior to voluntary movement (Cassidy et al., 2002; Levy et al., 2002; Priori et al., 2002; Williams et al., 2003, 2005; Kühn et al., 2004; Loukas and Brown, 2004; Doyle et al., 2005). It is, however, important to note that the current data are not incompatible with the sensory re-afferance to the STN demonstrated in single neuron studies (Wichmann et al., 1994); they only argue that a major part of the motor processing in this area may not be dependent on such re-afferance during movement execution, as it is still seen in MI.
Importantly, potential differences in the ability to perform MI and ME are unlikely to detract from the conclusion that a major part of the activity in the STN area during movement is not dependent on peripheral re-afference. The limited external control of task performance is a particular limitation of studies of MI, which accordingly rely on self-reports of task performance, as in our study. Although it is possible that Parkinson's disease and the recording of patients off levodopa may impair MI and, by analogy with ME, reduce but not obliterate the accompanying ERD (Dominey et al., 1995; Samuel et al., 2001; Doyle et al., 2005), this would have led to an underestimate of the beta frequency band changes in MI, and yet, for the ERD at least, there was no difference in the scale or time course of beta band changes in MI and ME in our subjects. Note that we continuously monitored EMG activity in the target muscles bilaterally and all trials containing EMG during the imagery tasks were discarded, so that MI was not contaminated by ME.
Role of the STN area in feedback-related motor processing after movement execution
Although the beta frequency band ERD during MI was very similar to that during ME, the beta ERS in MI was very much attenuated. In line with the reduced ERS over cortical motor areas during ischaemic nerve block (Cassim et al., 2001), our results suggest significant input to the STN-ERS from afferent sensorimotor feedback that was precluded during MI. The exact timing of an imagined movement cannot be well defined and the offset of MI might vary in averaged trials, thereby potentially reducing the apparent size of the ERS. However, the similar size and time course of the beta ERD during ME and MI suggests that the effects of temporal variability in MI were limited.
This dramatic attenuation of the beta ERS in MI suggests that the beta ERS is not simply due to a rebound in subthalamic networks following a period of suppression of beta band activity. Rather it implies that the beta ERS after movement is an active process that necessitates peripheral feedback for its full development. Sensory feedback at this late stage might be of use in trial-to-trial motor learning, and the work on the zebra finch songbird strongly implicates the avian brain area analogous to the basal ganglia as crucial for this type of learning (Brainard and Doupe, 2000). Alternatively, feedback following the movement may signal the need for re-establishment of postural set, with the latter being associated with an increase in synchronization in the beta band (Brown and Williams, 2005), especially in the higher beta range. Finally, the different post-movement power changes in the low and high beta sub-bands argue that these activities may be functionally distinct and are consistent with the hypothesis that basal ganglia motor sub-circuits are tuned to different frequencies (Priori et al., 2002; Fogelson et al., 2005).
We have used MI to model motor processing in the absence of peripheral feedback. Given the similarity of the ERD during MI and ME, subthalamic processing indexed by LFP changes during the ERD period seems predominantly related to efferent motor processing demands rather than online error correction. In contrast, the marked attenuation of the ERS following the ERD in MI as opposed to ME suggests that feedback is an important factor in the ERS in the STN area. Such activity under these circumstances might relate to trial-to-trial motor learning or the re-establishment of postural set following movements.
Peter Brown is supported by the Medical Research Council of Great Britain, Andrea Kühn by a fellowship from the Charité, Berlin (Rahel Hirsch Stipendium).
References
Abbruzzese G, Assini A, Buccolieri A, Marchese R, Trompetto C. Changes of intracortical inhibition during motor imagery in human subjects.
Alexander GE, Crutcher MD. Preparation for movement: neural representations of intended direction in three motor areas of the monkey.
Amirnovin R, Williams ZM, Cosgrove GR, Eskandar EN. Visually guided movements suppress subthalamic oscillations in Parkinson's disease patients.
Anderson ME, Horak FB. Influence of the globus pallidus on arm movements in monkeys. III. Timing of movement-related information.
Angel RW, Alston W, Garland H. L-dopa and error correction time in Parkinson's disease.
Beisteiner R, Hollinger P, Lindinger G, Lang W, Berthoz A. Mental representations of movements. Brain potentials associated with imagination of hand movements.
Brainard MS, Doupe AJ. Interruption of a basal ganglia-forebrain circuit prevents plasticity of learned vocalizations.
Brown P. Cortical drives to human muscle: the Piper and related rhythms.
Brown P. Oscillatory nature of human basal ganglia activity: relationship to the pathophysiology of Parkinson's disease.
Brown P, Williams D. Basal ganglia local field potential activity: character and functional significance in the human.
Cassidy M, Mazzone P, Oliviero A, Insola A, Tonali P, Di Lazzaro, V, et al. Movement-related changes in synchronization in the human basal ganglia.
Cassim F, Monaca C, Szurhaj W, Bourriez JL, Defebvre L, Derambure P, et al. Does post-movement beta synchronization reflect an idling motor cortex?
Cheruel F, Dormont JF, Amalric M, Schmied A, Farin D. The role of putamen and pallidum in motor initiation in the cat. I. Timing of movement-related single-unit activity.
Cheruel F, Dormont JF, Farin D. Activity of neurons of the subthalamic nucleus in relation to motor performance in the cat.
Courtemanche R, Fujii N, Graybiel AM. Synchronous, focally modulated beta-band oscillations characterize local field potential activity in the striatum of awake behaving monkeys.
Crone NE, Miglioretti DL, Gordon B, Sieracki JM, Wilson MT, Uematsu S, et al. Functional mapping of human sensorimotor cortex with electrocorticographic spectral analysis. I. Alpha and beta event-related desynchronization.
Crutcher MD, Alexander GE. Movement-related neuronal activity selectively coding either direction or muscle pattern in three motor areas of the monkey.
Cunnington R, Egan GF, O'Sullivan JD, Hughes AJ, Bradshaw JL, Colebatch JG. Motor imagery in Parkinson's disease: a PET study.
Decety J, Philippon B, Ingvar DH. rCBF landscapes during motor performance and motor ideation of a graphic gesture.
Decety J, Perani D, Jeannerod M, Bettinardi V, Tadary B, Woods R, et al. Mapping motor representations with positron emission tomography.
DeLong MR, Alexander GE, Georgopoulos AP, Crutcher MD, Mitchell SJ, Richardson RT. Role of basal ganglia in limb movements.
Desmurget M, Gaveau V, Vindras P, Turner RS, Broussolle E, Thobois S. On-line motor control in patients with Parkinson's disease.
Dinner DS, Neme S, Nair D, Montgomery EB Jr, Baker KB, Rezai A, et al. EEG and evoked potential recording from the subthalamic nucleus for deep brain stimulation of intractable epilepsy.
Dominey P, Decety J, Broussolle E, Chazot G, Jeannerod M. Motor imagery of a lateralized sequential task is asymmetrically slowed in hemi-Parkinson's patients.
Doyle LM, Kühn AA, Hariz M, Kupsch A, Schneider GH, Brown P. Levodopa-induced modulation of subthalamic beta oscillations during self-paced movements in patients with Parkinson's disease.
Fadiga L, Buccino G, Craighero L, Fogassi L, Gallese V, Pavesi G. Corticospinal excitability is specifically modulated by motor imagery: a magnetic stimulation study.
Foffani G, Bianchi AM, Baselli G, Priori A. Movement-related frequency modulation of beta oscillatory activity in the human subthalamic nucleus.
Fogelson N, Williams D, Tijssen M, Van Bruggen G, Speelman H, Brown P. Different functional loops between cerebral cortex and the subthalamic area in Parkinson's disease.
Georgopoulos AP, DeLong MR, Crutcher MD. Relations between parameters of step-tracking movements and single cell discharge in the globus pallidus and subthalamic nucleus of the behaving monkey.
Halliday DM, Rosenberg JR, Amjad AM, Breeze P, Conway BA, Farmer SF. A framework for the analysis of mixed time series/point process data—theory and application to the study of physiological tremor, single motor unit discharges and electromyograms.
Hariz MI, Krack P, Melvill R, Jorgensen JV, Hamel W, Hirabayashi H, et al. A quick and universal method for stereotactic visualization of the subthalamic nucleus before and after implantation of deep brain stimulation electrodes.
Hashimoto R, Rothwell JC. Dynamic changes in corticospinal excitability during motor imagery.
Jaeger D, Gilman S, Aldridge JW. Neuronal activity in the striatum and pallidum of primates related to the execution of externally cued reaching movements.
Jueptner M, Weiller C. A review of differences between basal ganglia and cerebellar control of movements as revealed by functional imaging studies.
Kimura M. Behaviorally contingent property of movement-related activity of the primate putamen.
Kühn A, Williams D, Kupsch A, Limousin P, Hariz M, Schneider GH, et al. Event-related beta desynchronization in human subthalamic nucleus correlates with motor performance.
Kühn A, Trottenberg T, Kivi A, Kupsch A, Schneider GH, Brown P. The relationship between local field potential and neuronal discharge in the subthalamic nucleus of patients with Parkinson's disease.
Lehéricy S, Bardinet E, Tremblay L, Van de Moortele PF, Pochon JB, Dormont D, et al. Motor control in basal ganglia circuits using fMRI and brain atlas approaches.
Levy R, Ashby P, Hutchison WD, Lang AE, Lozano AM, Dostrovsky JO. Dependence of subthalamic nucleus oscillations on movement and dopamine in Parkinson's disease.
Lotze M, Montoya P, Erb M, Hulsmann E, Flor H, Klose U, et al. Activation of cortical and cerebellar motor areas during executed and imagined hand movements: an fMRI study.
Loukas C, Brown P. Online prediction of self-paced hand-movements from subthalamic activity using neural networks in Parkinson's disease.
Marsden JF, Limousin-Dowsey P, Ashby P, Pollak P, Brown P. Subthalamic nucleus, sensorimotor cortex and muscle interrelationships in Parkinson's disease.
Mink JW, Thach WT. Basal ganglia motor control. II. Late pallidal timing relative to movement onset and inconsistent pallidal coding of movement parameters.
Nini A, Feingold A, Slovin H, Bergman H. Neurons in the globus pallidus do not show correlated activity in the normal monkey, but phase-locked oscillations appear in the MPTP model of parkinsonism.
Oldfield, R. C. The assessment and analysis of handedness: the Edinburgh inventory.
Pfurtscheller G. Central beta rhythm during sensorimotor activities in man.
Pfurtscheller G, Neuper C. Motor imagery activates primary sensorimotor area in humans.
Priori A, Foffani G, Pesenti A, Bianchi A, Chiesa V, Baselli G, et al. Movement-related modulation of neural activity in human basal ganglia and its L-DOPA dependency: recordings from deep brain stimulation electrodes in patients with Parkinson's disease.
Priori A, Foffani G, Pesenti A, Tamma F, Bianchi AM, Pellegrini M, et al. Rhythm-specific pharmacological modulation of subthalamic activity in Parkinson's disease.
Rodriguez-Oroz MC, Rodriguez M, Guridi J, Mewes K, Chockkman V, Vitek J, et al. The subthalamic nucleus in Parkinson's disease: somatotopic organization and physiological characteristics.
Samuel M, Ceballos-Baumann AO, Boecker H, Brooks DJ. Motor imagery in normal subjects and Parkinson's disease patients: an H215O PET study.
Schnitzler A, Salenius S, Salmelin R, Jousmaki V, Hari R. Involvement of primary motor cortex in motor imagery: a neuromagnetic study.
Sharott A, Magill PJ, Harnack D, Kupsch A, Meissner W, Brown P. Dopamine depletion increases the power and coherence of beta-oscillations in the cerebral cortex and subthalamic nucleus of the awake rat.
Silberstein P, Kühn AA, Kupsch A, Trottenberg T, Krauss JK, Wohrle JC, et al. Patterning of globus pallidus local field potentials differs between Parkinson's disease and dystonia.
Smith MA, Brandt J, Shadmehr R. Motor disorder in Huntington's disease begins as a dysfunction in error feedback control.
Sochurkova D, Rektor I. Event-related desynchronization/synchronization in the putamen. An SEEG case study.
Solodkin A, Hlustik P, Chen EE, Small SL. Fine modulation in network activation during motor execution and motor imagery.
Stephan KM, Frackowiak RS. Motor imagery—anatomical representation and electrophysiological characteristics.
Stephan KM, Fink GR, Passingham RE, Silbersweig D, Ceballos-Baumann AO, Frith CD, et al. Functional anatomy of the mental representation of upper extremity movements in healthy subjects.
Stinear CM, Byblow WD. Motor imagery of phasic thumb abduction temporally and spatially modulates corticospinal excitability.
Thobois S, Dominey PF, Decety PJ, Pollak PP, Gregoire MC, Le Bars PD, et al. Motor imagery in normal subjects and in asymmetrical Parkinson's disease: a PET study.
Toro C, Deuschl G, Thatcher R, Sato S, Kufta C, Hallett M. Event-related desynchronization and movement-related cortical potentials on the ECoG and EEG.
Wennberg RA, Lozano AM. Intracranial volume conduction of cortical spikes and sleep potentials recorded with deep brain stimulating electrodes.
Wichmann T, Bergman H, DeLong MR. The primate subthalamic nucleus. I. Functional properties in intact animals.
Williams D, Tijssen M, Van Bruggen G, Bosch A, Insola A, Di Lazzaro V, et al. Dopamine-dependent changes in the functional connectivity between basal ganglia and cerebral cortex in humans.
Williams D, Kühn A, Kupsch A, Tijssen M, Van Bruggen G, Speelman H, et al. Behavioural cues are associated with modulations of synchronous oscillations in the human subthalamic nucleus.
Author notes
1Sobell Department of Motor Neuroscience and Movement Disorders and 2Unit of Functional Neurosurgery, Institute of Neurology, London, UK, Departments of 3Neurology and 4Neurosurgery, Charité Campus Virchow, Humboldt University, Berlin, Germany

