

Article Figures & Data
Figures
- Figure 1.
CaMKIIa-positive MnPO neurons are glutamatergic. Representative image of the dorsal MnPO (dMnPO) with CaMKIIa-positive MnPO neurons (red) and colocalization with vGLUT2 (green), as indicated in the inset by white arrows. Scale bar for inset, 25 µm. Main figure scale bar, 100 µm. Anterior commissure, a.c.
- Figure 2.
CNO-mediated inhibition significantly attenuates basal firing rate in Gi DREADD-labeled neurons. A, Representative image showing loose-cell patch recording of a Gi DREADD-labeled (Gi DREADD) neuron (red). Scale bar, 20 µm. B, Representative raw trace recordings of a control (CTRL) neuron (top, n = 13 neurons, six rats), Gi DREADD-unlabeled (Gi DREADDx) neuron (middle, n = 19 neurons, six rats), and Gi DREADD neuron (bottom, n = 17 neurons, six rats). Scale bar, 10 s. C, CNO-mediated inhibition significantly attenuated basal firing rate of Gi DREADD neurons (peak response) compared to baseline and recovery, and compared to CTRL and Gi DREADDx. D, CNO-mediated inhibition significantly attenuated basal firing rate of Gi DREADD neurons (peak response), represented as a percentage baseline, compared to Gi DREADDx and CTRL neurons; *p < 0.050, compared to peak response between groups; #p < 0.050, compared to baseline within group. Data are presented as mean and SEM.
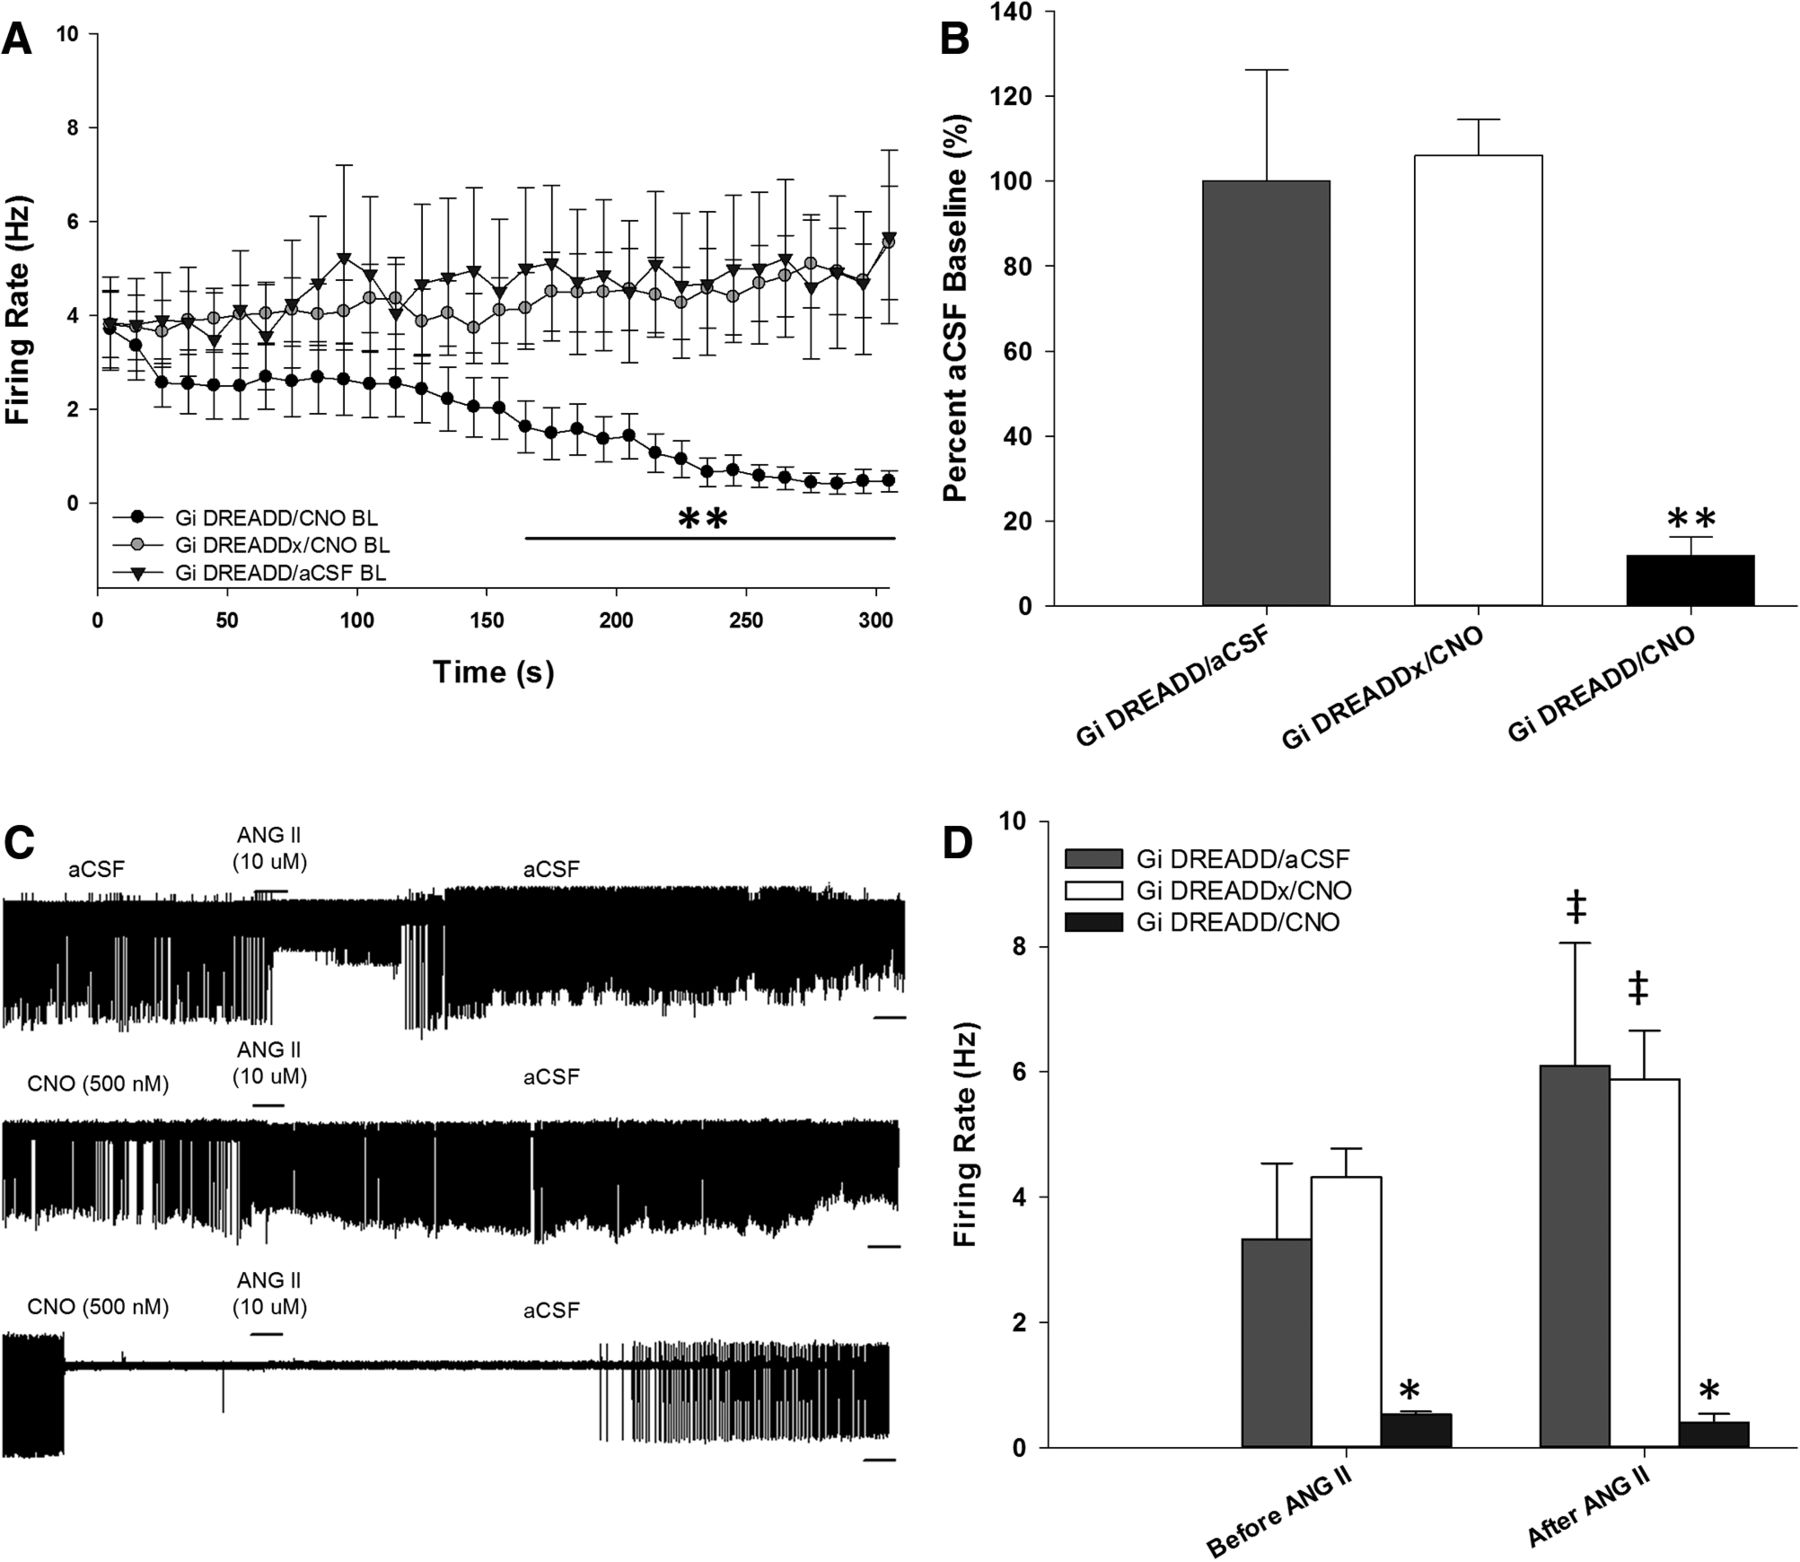
- Figure 3.
CNO-mediated inhibition blocks ANG II-induced excitation. A, CNO bath application significantly inhibits basal firing rate of Gi DREADD neurons (n = 15 neurons, six rats), but does not affect spontaneous activity in control (n = 7 neurons, three rats) or Gi DREADD-unlabeled (Gi DREADDx) neurons (n = 15 neurons, six rats); **p < 0.050 compared to each group. B, Gi DREADD neurons during CNO bath application reduced firing rate to 20% of percentage aCSF baseline but did not affect baseline of Gi DREADDx neurons. C, Representative raw trace recordings of a Gi DREADD neuron during aCSF (control conditions) exposure (top), Gi DREADDx neuron (middle), and Gi DREADD neuron (bottom) with the two latter exposed to CNO during baseline. Scale bar, 10 s. D, Focal ANG II application significantly increased firing rate of Gi DREADDx neurons during CNO exposure and Gi DREADD neurons during aCSF exposure; ‡p < 0.001. CNO-mediated inhibition blocked ANG II excitation of Gi DREADD neurons and displayed significantly reduced firing rate compared to Gi DREADDx neurons; *p < 0.001. Data are presented as mean and SEM.
- Figure 4.
CNO-mediated inhibition attenuates firing rate during hyperosmotic challenges. A, Representative raw trace recordings of a Gi DREADD neuron in the absence of CNO, using aCSF for control conditions (top), Gi DREADD-unlabeled (Gi DREADDx) neuron (middle), and Gi DREADD neuron (bottom), both latter neurons exposed to CNO. Scale bar, 10 s. Hypertonic aCSF, HTN-aCSF. B, CNO significantly inhibits basal firing rate compared to percentage aCSF baseline of Gi DREADD neurons. C, Hyperosmotic challenges significantly increased firing frequency of Gi DREADD neurons during aCSF exposure and Gi DREADDx neurons during CNO exposure (unaffected). CNO significantly attenuated firing rate of Gi DREADD neurons compared to Gi DREADDx neurons. There was an observed increase in firing rate in the absence of CNO during HTN-aCSF bath application, which became significant during aCSF bath application; *p < 0.001 compared to Gi DREADDx neurons exposed to CNO and Gi DREADD neurons during aCSF exposure; #p < 0.05 compared to time points within group. Data are presented as mean and SEM.
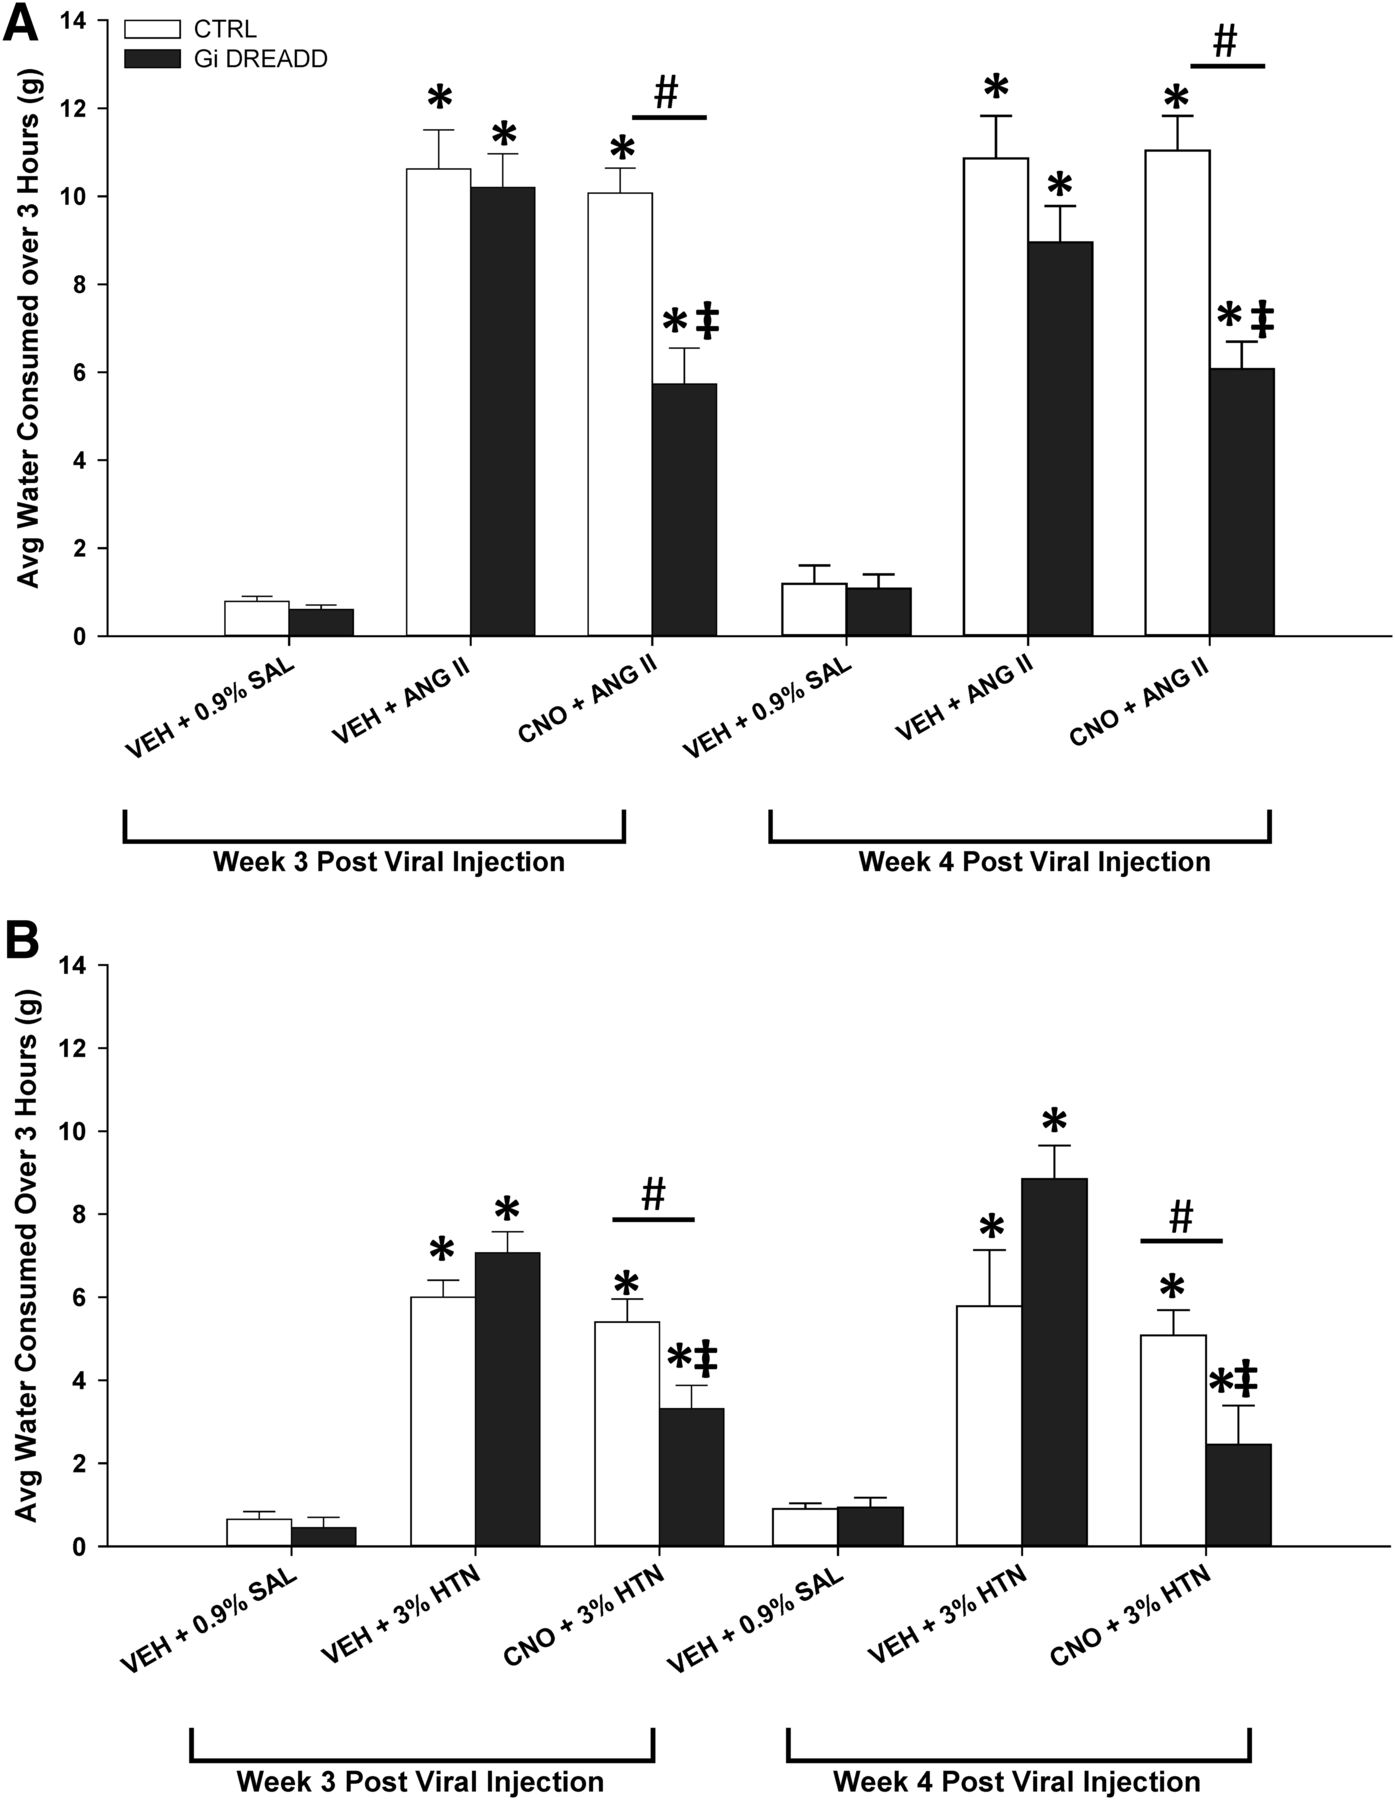
- Figure 5.
Acute MnPO inhibition attenuates evoked drinking responses. A, ANG II significantly increased water consumption compared to volume control tests (VEH + 0.9% SAL) in both Gi DREADD and CTRL (VEH + ANG II) rats (n = 10 rats). CNO-mediated inhibition significantly attenuated this increase in Gi DREADD (CNO + ANG II) rats (n = 10 rats). B, Hypertonic saline (3% HTN) significantly increased water consumption compared to VEH + 0.9% SAL tests in both Gi DREADD and CTRL (VEH + 3% HTN) rats (n = 6 rats) and CNO-mediated inhibition significantly attenuated this increase in Gi DREADD rats (n = 6 rats); *p < 0.005 compared to VEH + 0.9% SAL in respective group (A or B); ‡p = < 0.050 compared to VEH and ANG II (A) and 3% HTN (B) exposure in respective group; #p < 0.015 compared to CTRL + CNO + ANG II (A) and CTRL + CNO + 3% HTN (B). Data are presented as mean and SEM.
- Figure 6.
CNO-induced inhibition of CaMKIIa MnPO neurons significantly attenuates evoked increases of plasma AVP. A, ANG II significantly increased plasma AVP concentration in CTRL rats (CTRL + CNO + ANG II), but this increase was significantly attenuated during CNO-mediated inhibition in Gi DREADD (Gi DREADD + CNO + ANG II) rats. B, Hypertonic saline (3% HTN) significantly increased plasma AVP concentration, but this increase was blocked during CNO-mediated inhibition in Gi DREADD (Gi DREADD + CNO + 3%HTN) rats; *p < 0.02 compared to respective controls (CTRL + CNO + 0.9% SAL); ‡p < 0.050 compared to VEH and 3% HTN exposure; #p < 0.001 compared to CTRL + CNO + ANG II. Data are presented as mean and SEM.
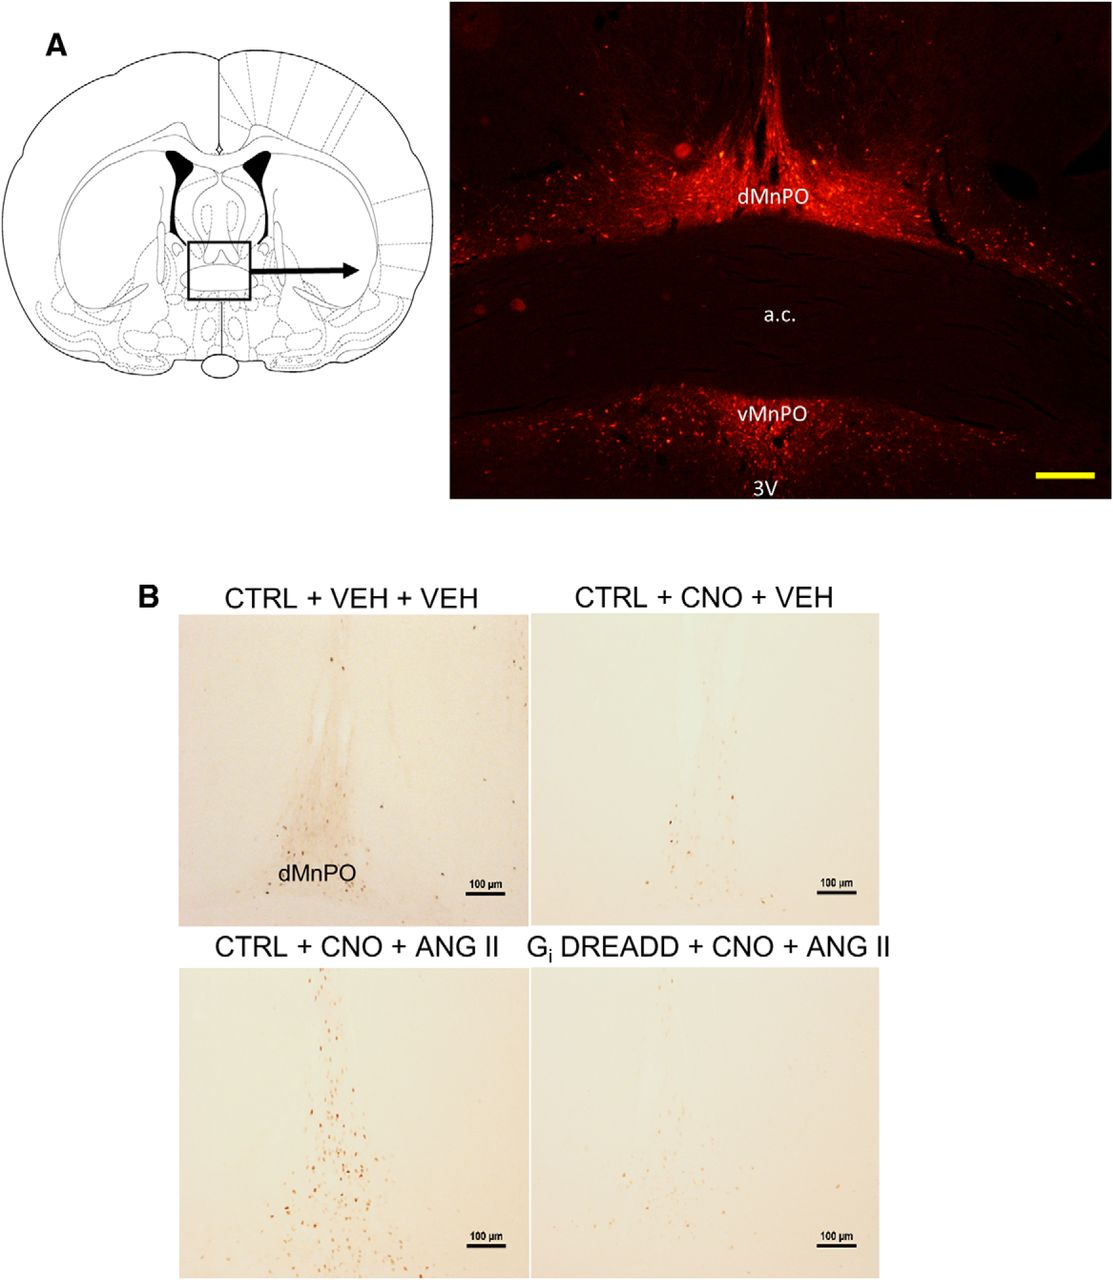
- Figure 7.
ANG II significantly increases Fos expression in the MnPO in control virus-injected rats, but is blocked during CNO-mediated inhibition in Gi DREADD-injected rats. A, Diagram showing representative mCherry labeling from AAV transfection in the MnPO. Scale bar, 250 µm. Third ventricle, 3V; anterior commissure, a.c.; dorsal MnPO, dMnPO; ventral MnPO, vMnPO. B, Representative Fos staining in the dMnPO of control virus-injected (CTRL) rats treated with CNO vehicle (VEH) and ANG II vehicle (0.9% SAL; n = 4, two to four sections per rat; upper left panel), CTRL rats treated with CNO and 0.9% SAL (n = 4, two to four sections per rat; upper right panel), CTRL rats treated with CNO and ANG II (n = 10, two to four sections per rat; lower left panel), and Gi DREADD-injected rats treated with CNO and ANG II (n = 10, two to four sections per rat; lower right panel). Scale bar, 100 µm.
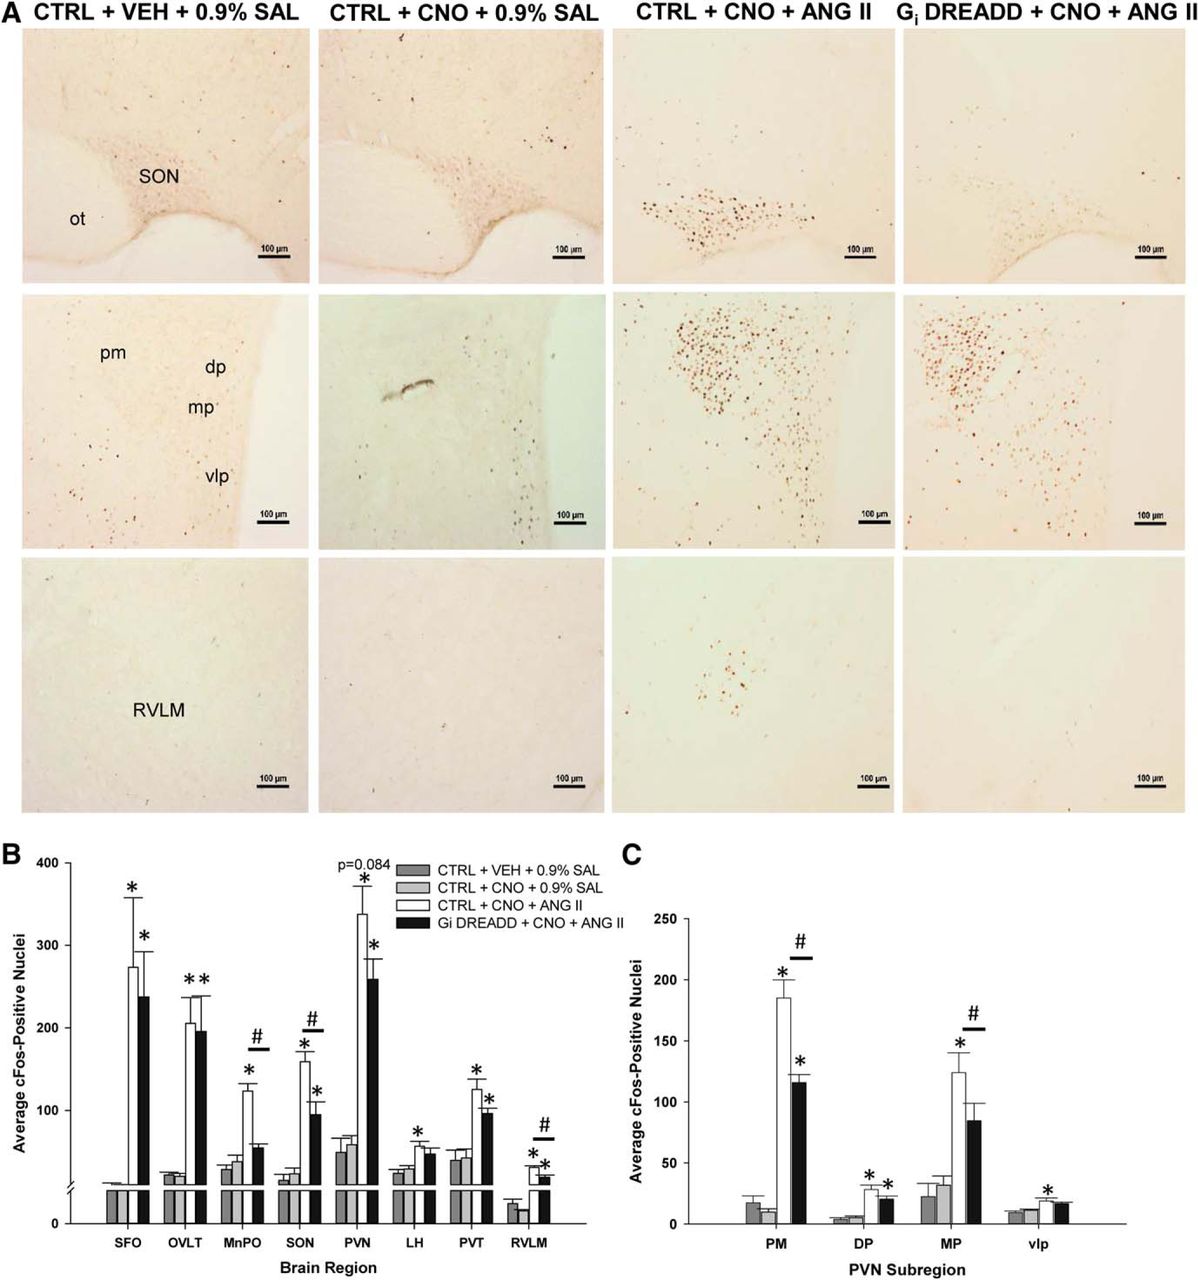
- Figure 8.
ANG II significantly increases Fos expression in regions downstream of the MnPO compared to controls and is blunted during CNO-induced inhibition in Gi DREADD-injected rats. A, Representative Fos staining in the SON (top row), PVN (middle row), and RVLM (bottom row) for each group tested. Scale bar, 100 µm. Supraoptic nucleus, SON; optic tract, ot: paraventricular nucleus, PVN; posterior magnocellular, PM; dorsal parvocellular, DP; medial parvocellular, MP; ventrolateral parvocellular, vlp; rostral ventral lateral medulla, RVLM. B, ANG II significantly increases Fos expression in the SFO, OVLT, PVN, and PVT but this increase was significantly attenuated during CNO-mediated inhibition in the MnPO, SON, LH, and RVLM. Subfornical organ, SFO; organum vasculosum of the lamina terminalis, OVLT; paraventricular thalamus, PVT; lateral hypothalamus, LH.C, ANG II significantly increases Fos staining in cardiovascular and neuroendocrine-regulating regions of the PVN, but is significantly attenuated by CNO-mediated inhibition in the PM and MP subregions; *p < 0.005 compared to VEH (CTRL + VEH + 0.9% SAL) and CNO (CTRL + CNO + 0.9% SAL) controls; #p < 0.001 Gi DREADD-injected rats compared to control virus-injected rats treated with CNO and ANG II (Gi DREADD + CNO + ANG II and CTRL + CNO + ANG II, respectively). Data are presented as mean and SEM.
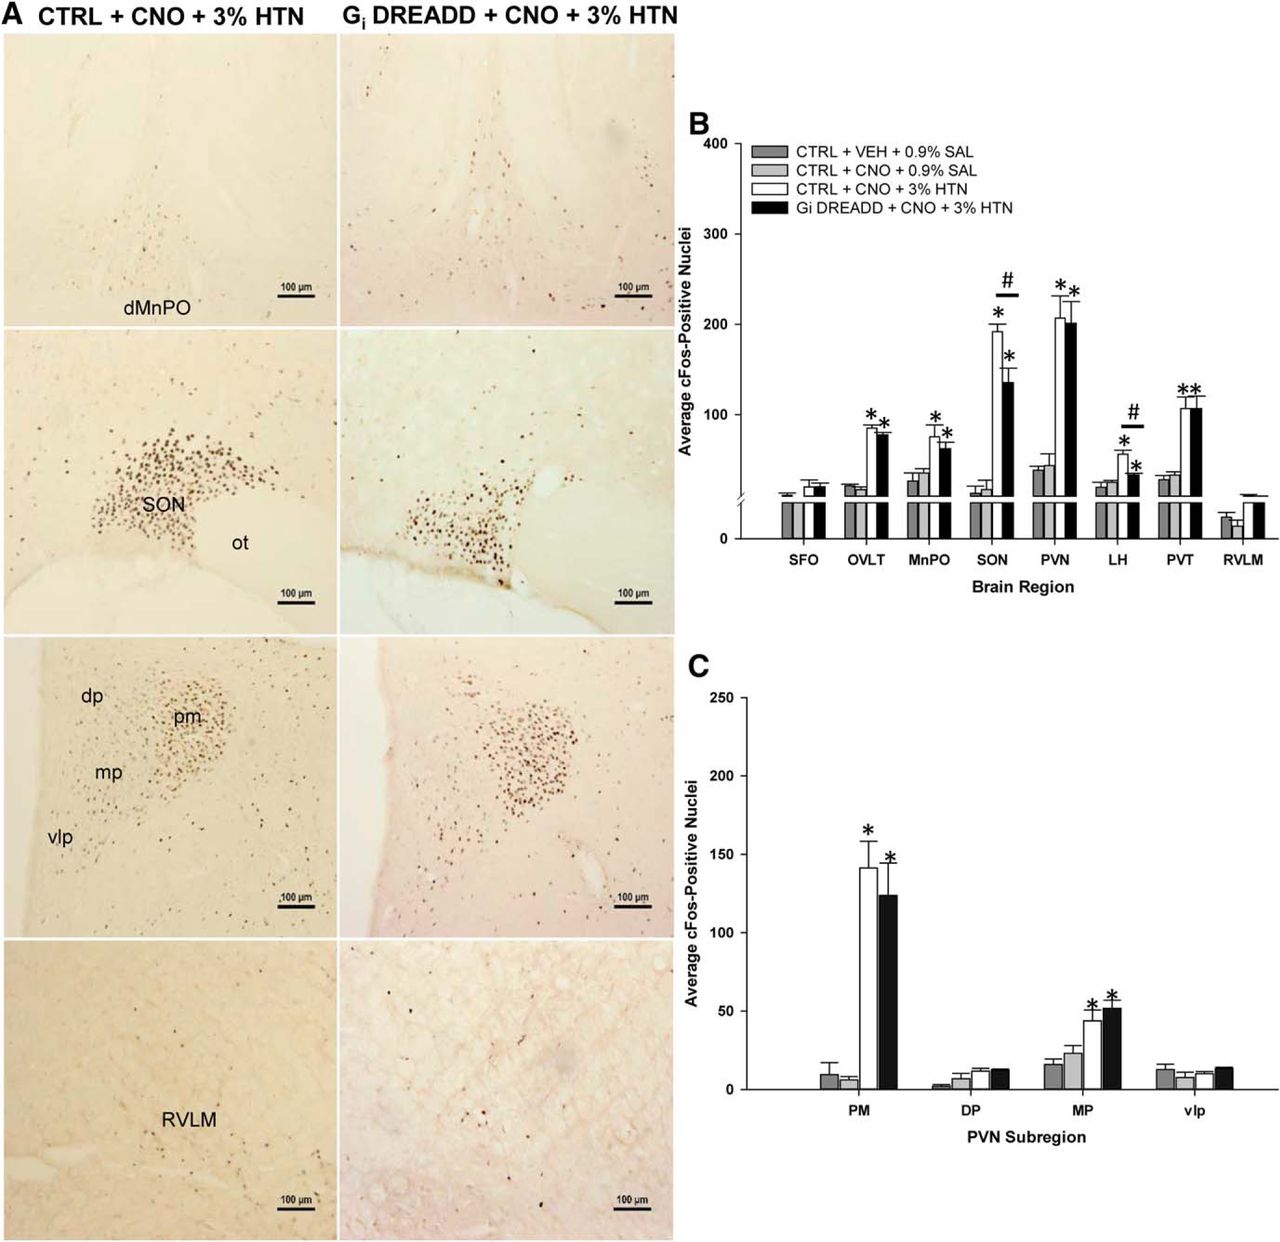
- Figure 9.
Hypertonic saline significantly increases Fos expression in the MnPO and in regions downstream, but is attenuated during CNO-induced inhibition in Gi DREADD-injected rats. A, Representative Fos staining in control virus-injected (CTRL) rats (n = 6, two to four sections per rat; left) and Gi DREADD rats (n = 6, two to four sections per rat; right), treated with CNO and 3% HTN; dMnPO (top row), SON (second row), PVN (third row), RVLM (bottom row). B, 3% HTN significantly increases Fos expression in the OVLT, MnPO, PVN, and PVT, but this increase was significantly attenuated during CNO-mediated inhibition in the SON and LH. Scale bar, 100 µm. Subfornical organ, SFO; organum vasculosum of the lamina terminalis, OVLT; paraventricular thalamus, PVT; lateral hypothalamus, LH. C, 3% HTN significantly increases Fos staining in cardiovascular and neuroendocrine-regulating regions of the PVN, the PM and MP subregions; *p < 0.005 compared to VEH (CTRL + VEH + 0.9% SAL) and CNO (CTRL + CNO + 0.9% SAL) controls; #p < 0.001 Gi DREADD rats compared to CTRL rats treated with CNO and 3% HTN (Gi DREADD + CNO + 3% HTN and CTRL + CNO + 3% HTN, respectively). Data are presented as mean and SEM.


Tables
Treatment Total cFos+ Total CaMKIIa+ Total DL cells % DL cFos+ Control
CNO + 0.9% SAL21.0 ± 10.0 182.8 ± 54.8 8.8 ± 1.25 50.2 ± 17.9% Control
VEH + 0.9% SAL25.8 ± 7.8 181.5 ± 37.5 15.1 ± 3.4 60.0 ± 4.8% Control
CNO + ANG II79.8 ± 8.7** 195.0 ± 57.6 44.0 ± 7.8** 54.4 ± 6.7% Gi DREADD CNO + ANG II 41.9 ± 7.2 206.5 ± 41.0 2.9 ± 1.0 6.5 ± 2.9%** ANG II exposure significantly increases Fos expression in the MnPO, specifically in CaMKIIa-positive neurons. CNO-mediated inhibition significantly attenuated ANG II-induced Fos expression in the MnPO in Gi DREADD-injected rats, with inhibition of the CaMKIIa neuronal phenotype; Bold text and **p < 0.001 compared to all groups. Data are presented as mean ± SEM.
In this issue


