

Article Figures & Data
Figures
- Figure 1.
Pkd2l1-Cre drives ChR2-YFP specifically in most PKD2L1-immunoreactive cells. A, Genetic construction of the Pkd2l1-Cre, ChR2-YFP mouse. B, Venn diagrams illustrating the coincidence of PKD2L1 immunoreactivity (IR; magenta) and ChR2-YFP fluorescence (green) in circumvallate (left) and fungiform (right) taste tissues. Cell counts are as follows: for circumvallate, PKD2L1-IR only = 175 cells, ChR2-YFP only = 4 cells, both = 202 cells; for fungiform, PKD2L1-IR only = 14 cells, ChR2-YFP only = 1 cell, both = 14 cells. C, Confocal z-stack images showing ChR2-YFP fluorescence in green and PKD2L1-IR in magenta in both the circumvallate (top) and fungiform (bottom) taste tissues. Because PKD2L1-IR tends to localize in the apical region of the taste cell, some cell bodies appear more green than magenta, but nonetheless exhibit PKD2L1-IR. Three such cells are marked with asterisks in the merged image. D, Confocal z-stack images showing the separation of ChR2-YFP fluorescence in green and type II cell marker PLCβ2-IR in magenta in both the circumvallate (top) and fungiform (bottom) taste tissues. Scale bars, 20 µm.
- Figure 2.
ChR2-YFP is not expressed in afferent taste nerve fibers or the ganglion cell bodies of the geniculate. A, Confocal z-stack images of circumvallate and fungiform taste buds showing ChR2-YFP fluorescence in green and taste nerve marker P2X3-immunoreactivy (IR) in magenta. B, Confocal z-stack images of geniculate ganglion cells showing ChR2-YFP fluorescence in green and taste ganglion cell marker P2X3-IR in magenta. Although green fluorescence appears in the ganglion, it seems to be restricted to satellite cells and is not present in neuronal cell bodies. Scale bars, 20 µm.
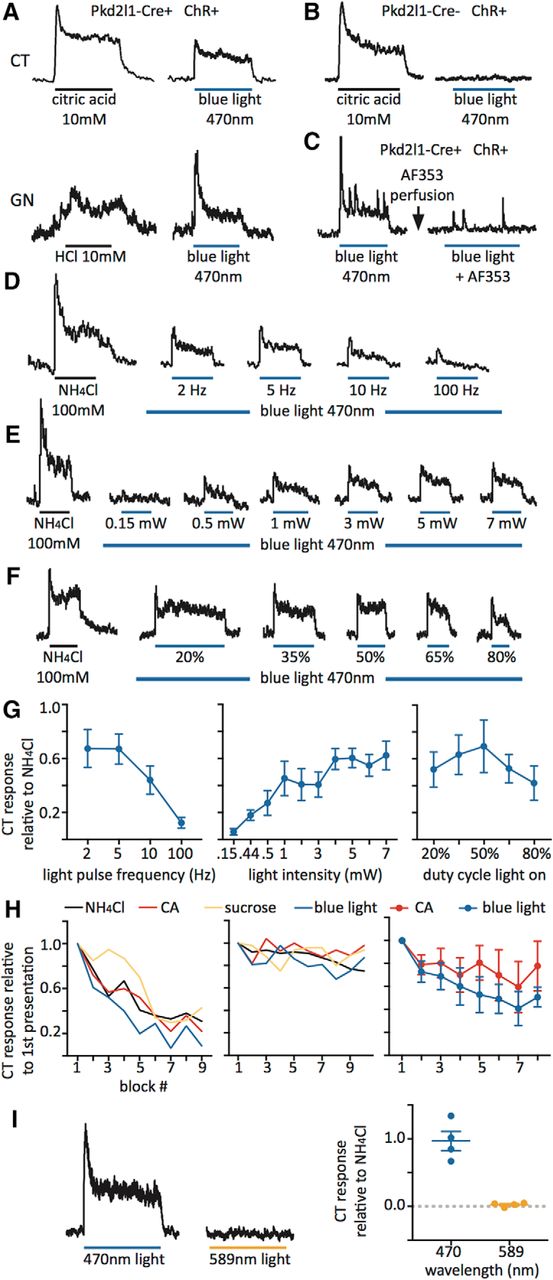
- Figure 3.
Optogenetic stimulation of the tongue in Pkd2l1-Cre, ChR2 mice elicits a robust, tastant-like nerve response. A, Chorda tympani (CT) and glossopharyngeal (GN) nerve responses to acidic stimuli and a 470 nm light pulse stimulus in Pkd2l1-Cre, ChR2 mice. B, CT nerve responses to citric acid and blue light in a Cre-negative control mouse. C, CT nerve responses to blue light in a Pkd2l1-Cre, ChR2 mouse before and after the application of purinergic receptor blocker AF353 to the tongue. D, CT nerve responses to a control tastant stimulus (NH4Cl) and blue light pulses at increasing frequencies (power at 7 mW, duty cycle at 50%). E, CT nerve responses to NH4Cl and blue light pulses at increasing light power (frequency at 5 Hz, duty cycle at 50%). F, CT nerve responses to NH4Cl and blue light pulses at increasing light-on duty cycle percentages (frequency at 5 Hz, power at 7 mW). G, All quantified data in frequency (n = 3), power (n = 4), and duty cycle experiments (n = 3). H, Two example experiments (left and middle) showing the consistency of the blue light response, compared with repeated blocks of 100 mm NH4Cl (black), 10 mm citric acid (CA; red), 500 mm sucrose (yellow), and blue light at 5 Hz pulses, 7 mW power, and 50% duty cycle (blue). All presentations normalized to the first presentation of that stimulus (e.g., CA responses normalized to first presentation of CA, light responses normalized to first presentation of light). Right graph shows all data (n = 6) comparing the consistency of blue light responses (blue) to CA responses (red). Blue light responses were not different from CA responses over presentation blocks (F(7,70) = 0.254, p = 0.9692, two-way ANOVA). I, CT nerve responses to blue (470 nm) and amber (589 nm) light. Graph on right shows all data (n = 4) of varied wavelength stimulation. Stimulus bars denote 30 s of stimulation, except for those in F, which are adjusted to normalize total time of light exposure to the tongue. All error bars denote the SEM.
- Figure 4.
Pkd2l1-Cre, ChR2 mice avoid blue light activation compared with amber control light presentation. A, Behavioral experiment sequence for (1) a typical taste stimuli two-bottle preference test, and (2) a blue v amber light two-bottle preference test. Preference score calculation at bottom. B, Taste preference curves for varying concentrations of citric acid (left) and sucrose (right) in littermate controls (gray, open), and Pkd2l1-Cre, ChR2 mice (black, filled). Scores >0.5 indicate a preference for the taste stimulus, while those <0.5 indicate an avoidance. C, Preference scores for two-bottle preference tests for 1 mm citric acid (left) and blue light (v amber, right) with littermate controls (open circles), and Pkd2l1-Cre, ChR2 mice (filled circles). Both Pkd2l1-Cre, ChR2 mice and controls slightly avoided 1 mm citric acid, but were not significantly different from each other (t = 0.31, **p = 0.7601, unpaired t test). Pkd2l1-Cre, ChR2 mice avoided blue when compared to amber light, while controls did not (t = 3.137, p = 0.0057, unpaired t test). All error bars denote 95% confidence intervals.
- Figure 5.
Pkd2l1-Cre, ChR2 mice do not increase licking behavior in response to light in the absence of water. A, Lick patterns during the first minute of behavioral experiments with 10 littermate control (gray) and 10 Pkd2l1-Cre, ChR2 (black) mice featuring a water spout without water or light (left), without water but with blue light (center), or with water and without light (right). B, Left, Total licks in the first minute of the experiments in A. For Pkd2l1-Cre, ChR2 mice (black), total licks did not differ between the water− light− condition and the water− light+ condition (t = 1.135, p = 0.2712, unpaired t test). Lick totals in both of these conditions were significantly different from the lick count for the water+ light− condition (t = 13 and t = 14, respectively; ****p < 0.0001 for each, unpaired t test). Right, Cumulative lick total over 10 min for Pkd2l1-Cre, ChR2 mice under each condition. All error bars denote 95% confidence intervals.


Tables
Target protein Host Dilution Manufacturer Catalog # RRID Lot GFP Chicken 1:2000 Aves GFP-1020 AB_10000240 0511FP12 PKD2L1 Rabbit 1:500 Hiroaki Matsunami Laboratory, Duke University Medical Center PKD2L1 AB_2661860 N/A SNAP25 Goat 1:1000 GeneTex GTX89577 AB_10724125 821604337 P2X3 Rabbit 1:200 Alomone Labs APR-016 AB_2313760 APR016AN0802 5-HT Rabbit 1:2500 Immunostar 20080 AB_572263 1431001 PLCβ2 Rabbit 1:200 Santa Cruz Biotechnology Sc-206 AB_632197 A1204 Target species Host Dilution Manufacturer Catalog # RRID Wavelength Chicken Donkey 1:400 Jackson ImmunoResearch 703-545-155 AB_2340375 488 Rabbit Donkey 1:400 Molecular Probes A10042 AB_11180183 568 Goat Donkey 1:400 Molecular Probes A21447 AB_141844 647
In this issue


