

Article Figures & Data
Figures
- Figure 1
3DMorph workflow. The user selects either Interactive or Automatic mode. Interactive mode must be used first to generate a parameters file. A, The user then selects the file to analyze, and specifies x, y, and z scale, number of channels, and the channel of interest. Both .tiff and .lsm files are supported. The original image (B) is loaded and 3D connected components (C) are automatically detected. D, Large cells can be selected for segmentation and small objects can be removed. E, After skeletonization and measurements of remaining cells, 3DMorph saves selected images and generates an Excel results file. Gray text indicates automatic steps.
- Figure 2
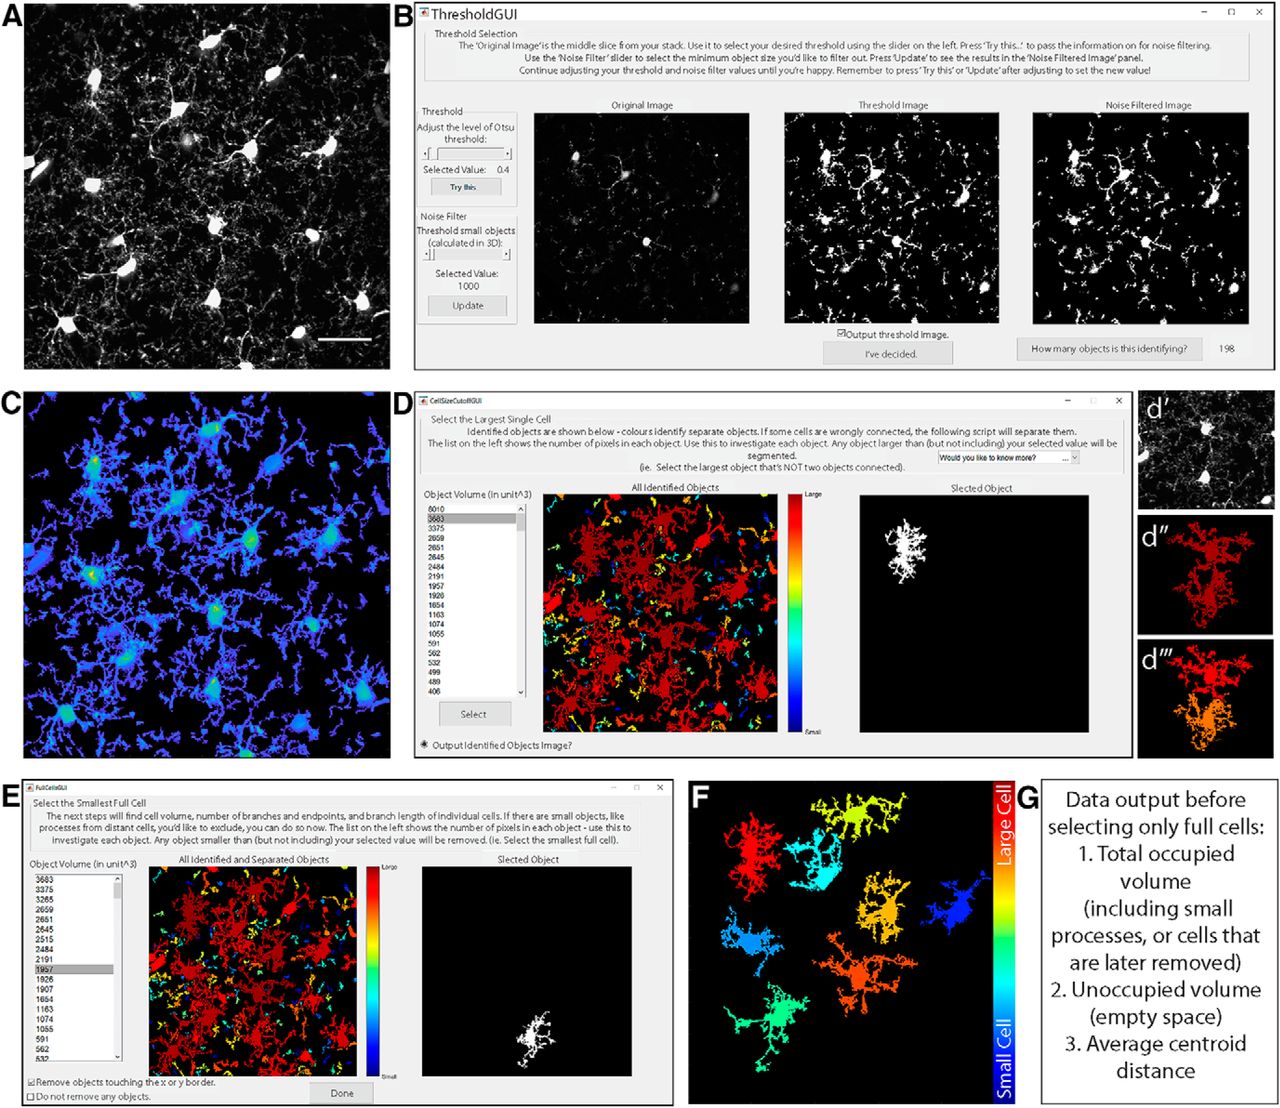
Select threshold and identify cells. A, Grayscale maximum projection of original stack. Scale bar, 25 µm. B, Select threshold level, and noise filter value to remove small spots. C, “Output Threshold Image” is a 2D projection after threshold and noise filters are applied. To visualize 3D shapes of cells, hotter colors indicate thicker portions of cells. D, 3DMorph automatically identifies 3D connected components, and the user selects a maximum cell size. Objects larger than this value are considered to be erroneously connected cells (d′, d‴), and will be segmented into separate objects (d‴). E, Exclude remaining small cells, out-of-focus processes, or cells touching the x-y borders to isolate only full cells (F). G, At this point, the program records total occupied volume (calculated before excluding small cells, processes, etc.), the unoccupied volume, and the distance between cell centroids.
- Figure 3
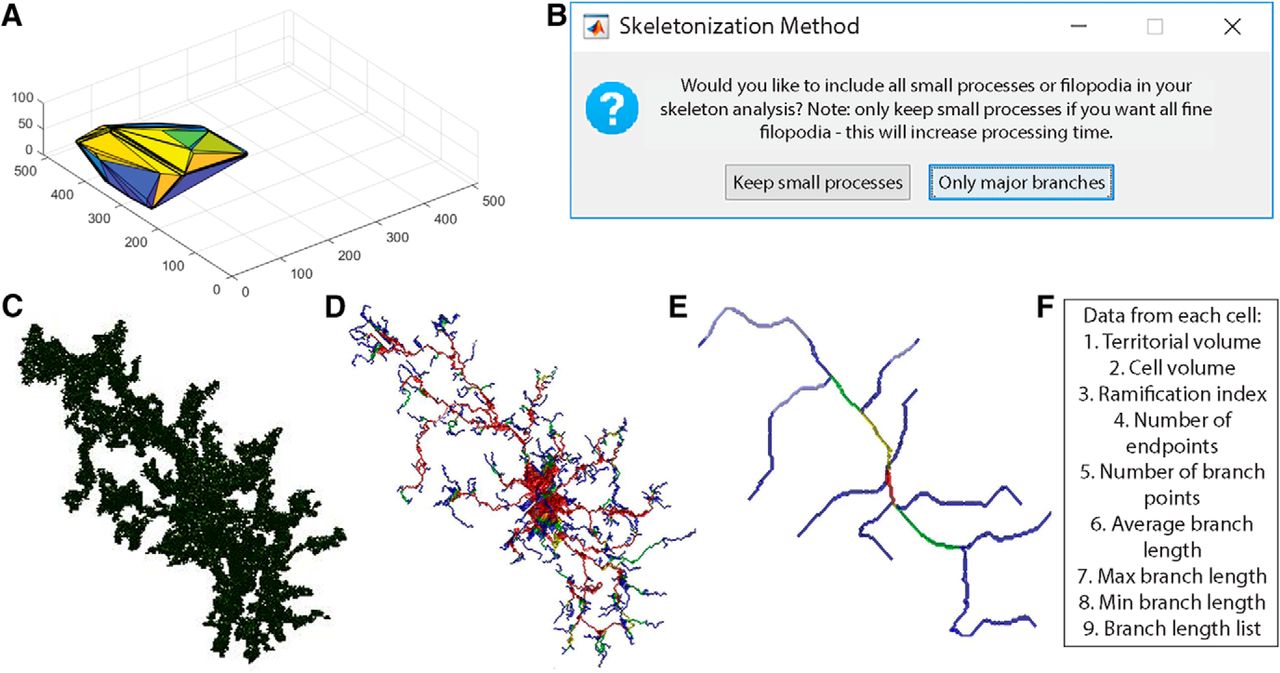
Analysis of individual full cells. A, Territorial volume of each cell is determined by placing a polygon around all of the extreme points of the cell. B, The user decides which skeletonization method to use and which images to save (including: original cell, skeleton, branch points, and end points). Each full cell (C) is then processed individually to generate a 3D skeleton, keeping either all branches (D), or only major branches (E). In skeleton figures, colors indicate order of connectivity (red = primary, yellow = secondary, green = tertiary, and blue = connected to endpoint). F, After processing all cells, the program outputs territorial volume, cell volume, ramification index (calculated as territorial volume/cell volume), number of endpoints and branch points, as well as average, maximum, and minimum branch length for each cell. A complete list of branch lengths for each cell can also be generated.
- Figure 4
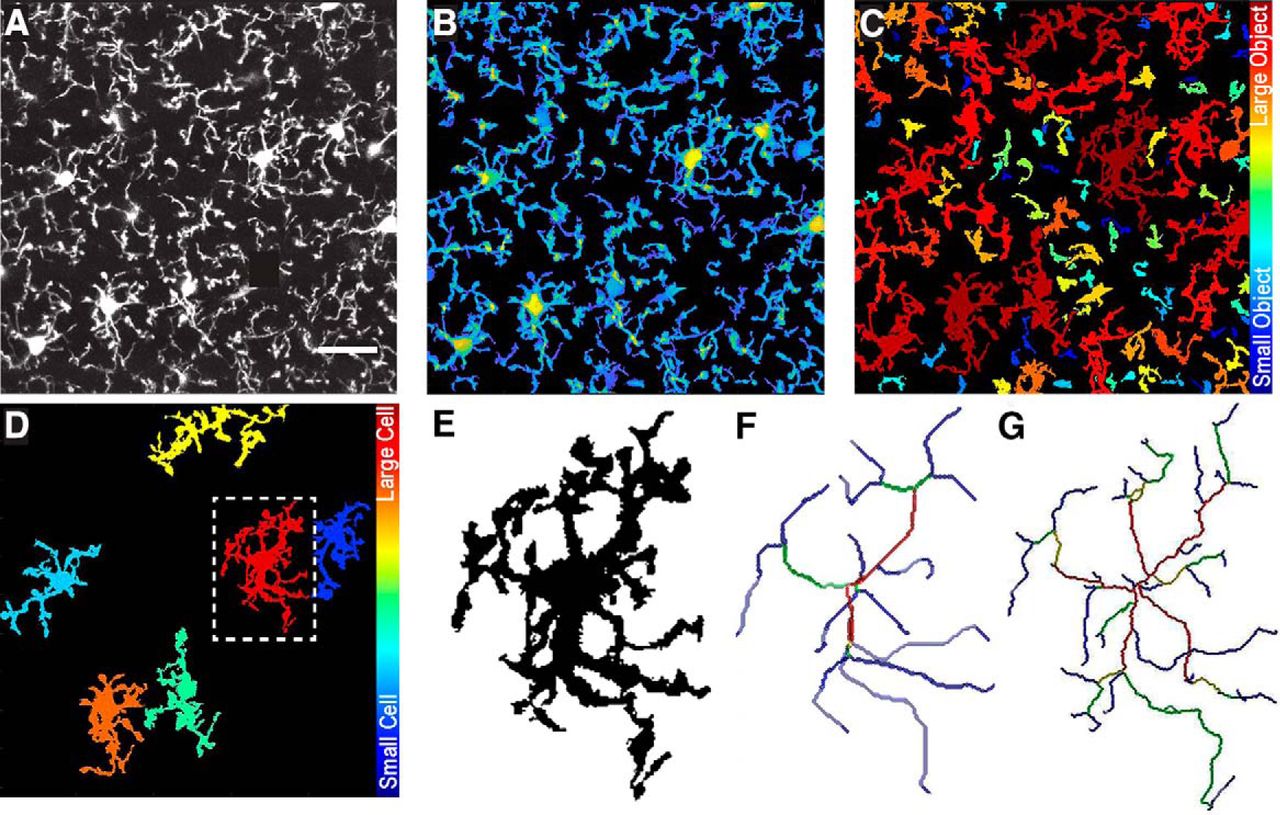
Validation and comparison of 3DMorph with current analysis tools. A, 3D visualization of a manually-generated test image composed of four cells with overlapping processes. B, Z-projection of test image. Scale bar, 25 µm. C, Full cells as identified by 3DMorph. D, A single full cell from the test image (outlined by dashed box in C). E, 3D skeleton generated automatically by 3DMorph. F, 3D skeleton manually drawn using Simple Neurite Tracer (SNT). G, 2D skeleton manually drawn using freehand tracing of a z-projection of the test image. Based on analysis by 3DMorph, SNT, or z-projection tracing, there is no significant difference in the number of endpoints (H) or branch points (I) recorded. J, Cell volume measurements are accurate between 3DMorph and SNT, but unavailable from z-projection analysis. K, Maximum branch length is significantly longer by 3DMorph and SNT analysis than by z-projection tracing. L, Average branch lengths are significantly longer by 3DMorph than by SNT or z-projection. M, Comparison of user input time to measure data. Error bars indicate mean ± SEM. *p < 0.05, **p < 0.01, ***p < 0.001 by one-way ANOVA.
- Figure 5
Microglia morphology changes in response to local cues. Microglia are incubated with control aCSF (A, B), 500 µM ATP (C, D), or 50 µM CNQX and 1 µM TTX (E, F) before fixing and imaging (imaging dimensions: 174.08 × 174.08 × 50 µm). Original 3D projections (A, C, E; scale bar, 25 µm), and remaining full cells (B, D, F), are shown. G, Quantification confirms that microglia cover more volume in ATP than in control conditions, while CNQX/TTX treatment decreases the total surveyed volume. When only full cells are considered, each microglial cell in CNQX/TTX conditions covers a smaller territorial volume (H) and has shorter average branch lengths (I) than control or ATP conditions, whereas ATP cells have significantly longer branch lengths than control. Error bars represent mean ± SEM. *p < 0.05, **p < 0.01, ***p < 0.001, ****p < 0.0001 by one-way ANOVA.
- Figure 6
Morphology analysis of in vivo microglia images. A, Maximum projection of in vivo image stack. B, 3DMorph threshold image shown as a maximum projection. C, Separation of thresholded image into individual objects, color-coded based on size of object. D, Remaining full cells after removing small processes from out-of-frame cells. E, Isolated single cell from outlined region in D. F, Skeleton of major branches and (G) skeleton maintaining fine processes.
- Figure 7
Morphology analysis of dye-loaded neuron. A, Maximum projection of dye-loaded neuron. Scale bar, 50 µm. B, Remaining cell following 3DMorph thresholding. C, Skeletonized neuron keeping fine processes.


Tables
- Table 1.
3DMorph, Simple neurite tracer ImageJ plugin, and freehand tracing of maximum z-projection images
3DMorph Simple Neurite tracer Z-projection trace Branch length ✓ ✓ ✓ Cell volume ✓ ✓ ✘ Territorial volume ✓ × ✘ Total occupied Volume ✓ × ✘ Ramification Index ✓ × ✘ No. of endpoints ✓ ✓ ✓ No. of branch points ✓ ✓ ✓ 3D analysis ✓ ✓ × Automatic batch Processing ✓ ✘ × User input time Fastest (min) Slowest (min–h) Intermediate (10s of min) Although both 3DMorph and simple neurite tracer process 3D information, only 3DMorph offers an automatic batch processing mode to greatly decrease user input time.
Supplementary 1
Supplementary 3DMorph. Download Supplementary 1, TXT file
In this issue


