

Article Figures & Data
Figures
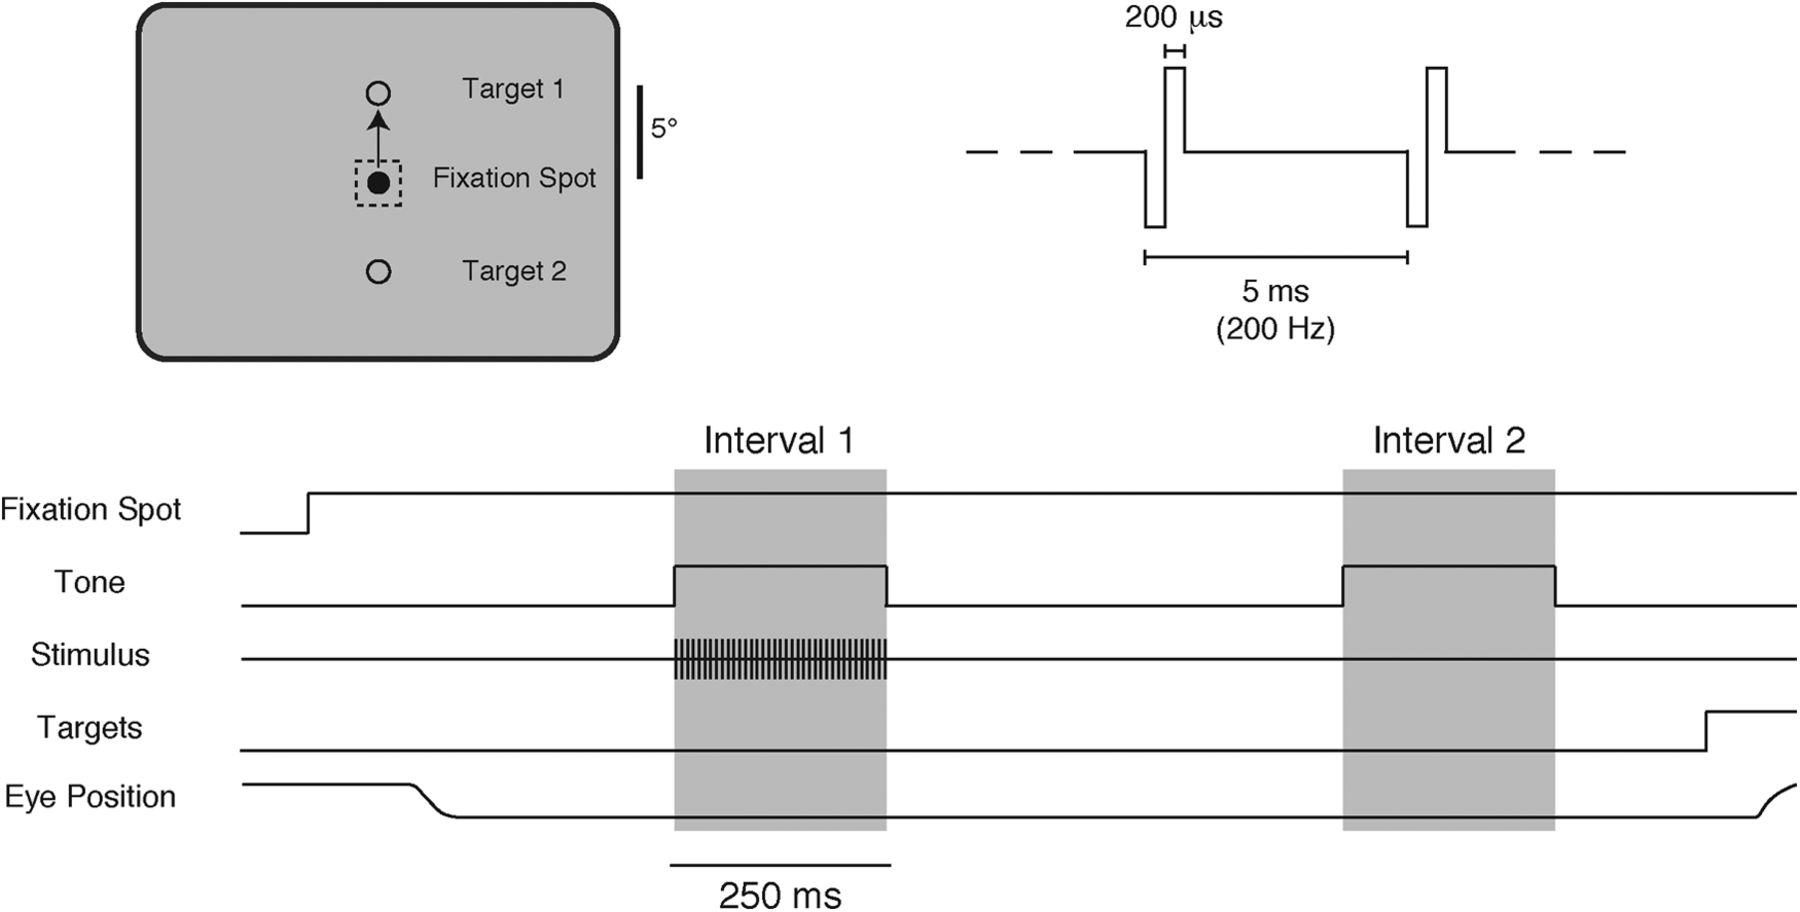
- Figure 1.
2AFC task. During fixation, electrical microstimulation was delivered during one of two 250-ms time intervals that were marked by auditory tones and separated by 500 ms. Two response targets appeared 250 ms after the end of the second interval and the animals indicated which interval contained the stimulus by making a direct saccade to the appropriate target (target 1 for interval 1, target 2 for interval 2). The electrical stimulus was a 250 ms, 200-Hz train of biphasic constant-current pulses, anodal phase first, with each phase lasting 200 µs. Thresholds were determined by using different current levels on different trials using an adaptive staircase procedure.
- Figure 2.
Detection thresholds rise within sessions and recover partially between sessions. A, Example single session data from three representative microelectrodes showing that detection thresholds rise when a given site is repeatedly microstimulated during the daily session. Monkey 1: circles and squares; monkey 2: asterisks. Error bars = 95% CI. B, Detection thresholds consistently rise across a session. For each session (two electrode sites per animal; monkey 1: 15 total sessions; monkey 2: five total sessions), the rise in threshold across trials was fitted with an exponential function. Individual points represent the initial (x-axis) and final (y-axis) detection threshold measurements from the fitted data. C, The rise in detection threshold within a session is correlated with the number of stimulated trials in that session (p < 0.05), showing that the change in threshold increases with increasing stimulation. D, Thresholds partially recover between consecutive days of electrical microstimulation. Individual points represent the final threshold estimate from one session (x-axis) and first threshold estimate obtained during the next session (y-axis).
- Figure 3.
Detection thresholds rise across days of repeated stimulation of the same cortical site. A, Detection thresholds at the start of a daily behavioral session increase across repeated days of stimulation. Lines depict the first detection threshold estimate made per day across successive days of electrical microstimulation (monkey 1: black lines; monkey 2: gray line). Error bars represent 95% CI. B, Detection thresholds remain stable at four nearby electrode sites in monkey 1 where only one threshold estimate was made each day.
- Figure 4.
Detection thresholds increase over 100 trials of stimulation. Two 100-trial threshold measurements were made at each V1 site. A, B, Each point represents the ratio of threshold measurements between two subsequent measurements when the electrode was advanced between measurements (x-axis) compared to when both measurements were made at the same site (y-axis; A: monkey 3, 140 sessions; B: monkey 4, 69 sessions). Dashed lines indicate mean x,y values. The ratios of thresholds within site were significantly greater than those between sites (both animals: p < 0.05). C, Bar plot shows the mean difference (±1 SEM) between pairs of threshold measurements. Repeated stimulation of the same site elevated thresholds for the second measurement compared to the first (left bar). This measure corresponds the y-axis ratios in A, B. After two threshold measurements, the microelectrode was advanced by 100 μm into a new site. The difference in thresholds between the first measurement at a new site and the first measurement at the previous site was not significantly different from zero (middle bar), indicating that there was no systematic change in threshold across a session for previously unstimulated sites. Consistent with these observations, the difference between the first threshold measurement at a new site and the second threshold measurement at the previous site was negative (right bar), reflecting lower thresholds for unstimulated cortex relative to cortex that has been previously stimulated. This measure corresponds to the x-axis ratios in A, B.


In this issue


