

Article Figures & Data
Figures
- Figure 1.
Strategy for controlling the areal identity of PSC-derived neurons. A, Schematic diagram of areal patterning in the cerebral cortex. The R-C gradient of FGF8 signaling determines areal identity. B, Overview of the culture protocol. FGF8 modulators (FGF8 and sFGFR3) were added at the secondary neurosphere stage.
- Figure 2.
Effect of FGF8 on R-C marker expression. A, qRT-PCR analysis of ESC-derived neurospheres for R-C marker expression (n = 3; mean ± SEM; ***p < 0.001; **p < 0.01; *p < 0.05; ANOVA with Dunnett’s test). The concentration (ng/ml) of FGF8 is presented as a superscript. B, Representative immunofluorescent images for R-C markers (scale bar = 50 µm). C, Histogram showing the distribution of the immunofluorescent intensity of SP8 and COUP-TFI measured at the single-cell level.
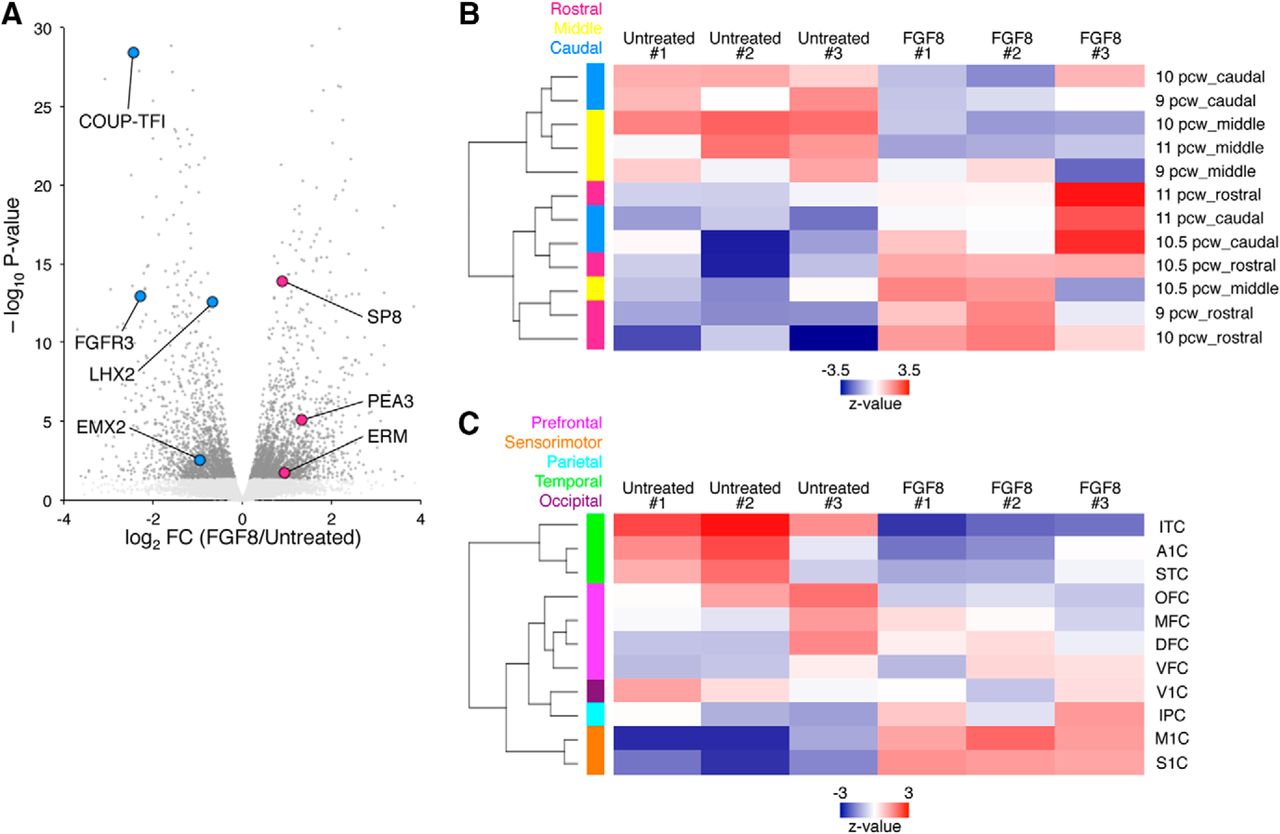
- Figure 3.
Transcriptome comparison between PSC-derived neural progenitors and human fetal brains. A, Volcano plot of the expression profile of FGF8-treated cells relative to control, with differentially expressed genes (p < 0.05; Student’s t test) highlighted (dark gray). The rostral (red) and caudal (blue) markers were enriched in FGF8-treated and untreated cells, respectively. B, C, Correlation matrix of the global gene expression with macro-dissected (B) and micro-dissected (C) human fetal brains. FGF8-treated cells well correlated with the rostral portions of macro-dissected brains and with the sensorimotor cortex of micro-dissected brains. OFC, orbital prefrontal cortex; MFC, mediolateral prefrontal cortex; DFC, dorsolateral prefrontal cortex; VFC, ventrolateral prefrontal cortex; M1C, primary motor cortex; S1C, primary sensory cortex; IPC, inferior parietal cortex; A1C, primary auditory cortex; STC, superior temporal cortex; ITC, inferolateral temporal cortex; V1C, primary visual cortex.
- Figure 4.
Recapitulation of ALS phenotypes in FUS- and ALS2-mutated cells. A, Schematic diagram of motor neurons affected in ALS. B, Overview of the LMN derivation protocol. C, Representative immunofluorescent images of apoptotic LMNs at day 42 [scale bar = 50 µm (upper) and 10 µm (lower)]. Arrowheads indicate the cleaved CASPASE3-positive cells. D, Quantification of the cleaved CASPASE3-positive products in LMNs at day 42 (n = 3; mean ± SEM; ***p < 0.001; **p < 0.01; ANOVA with Tukey’s test). HB9-positive LMNs derived from FUS-mutated cells selectively showed increased apoptosis. E, Representative immunofluorescent images of apoptotic cortical cells at day 48 [scale bar = 50 µm (upper) and 10 µm (lower)]. Arrowheads indicate the cleaved CASPASE3-positive cells. F, Quantification of the cleaved CASPASE3-positive products in untreated and FGF8-treated cortical cells at day 48 (n = 3–5; mean ± SEM; ***p < 0.001; ANOVA with Tukey’s test). CTIP2-positive cortical cells derived from FGF8-treated ALS2-mutated neurospheres selectively showed increased apoptosis. G, Representative immunofluorescent images of apoptotic cortical cells at day 48 (scale bar = 10 µm). Arrowheads indicate the cleaved CASPASE3-positive cells. H, Quantification of the cleaved CASPASE3-positive products in untreated and FGF8-treated cortical cells at day 48 (n = 4–5; mean ± SEM; ***p < 0.001; ANOVA with Tukey’s test). OTX1-positive cortical cells, but not FOXP2-positive cells, derived from FGF8-treated ALS2-mutated neurospheres selectively showed increased apoptosis. I, Representative immunofluorescent images of SOX1/cleaved CASPASE3 in neural progenitors in neurospheres at day 18 (scale bar = 10 µm). J, Quantification of the cleaved CASPASE3-positive products in untreated and FGF8-treated SOX1-positive neural progenitors in neurospheres at day 18 (n = 3; mean ± SEM). Selective cell death was not observed in neural progenitors.


In this issue


