

Article Figures & Data
Figures
- Figure 1.
Expression of recombinant human GRNs and identification of antibodies that detect GRNs. A, Schematic of human GRN expression constructs. Human GRN sequences (Table 2), with and without adjacent C-terminal linker regions, were synthesized to include the N-terminal PGRN signal peptide (SP), followed by twin-Strep (SAWSHPQFEK) tags and a single FLAG (DYKDDDDK) tag. Throughout the manuscript, individual GRNs are referred to by their numerical sequential designation (i.e., GRN-1, GRN-2, etc.), which correspond to their original alphabetical designation (i.e., GRN-G, GRN-F, etc.). B, C, HEK293T cells were transfected with the human GRN constructs and 48 h later either (B) whole-cell lysates or (C) conditioned media were analyzed by immunoblot for protein expression using the StrepMAB-immo antibody. D, Cell lysates from GRN(+linker) overexpressing cells were mock (-) or PNGase F (+) treated to detect glycosylated proteins. E, F, GRN-expressing HEK293T cell lysates were analyzed by immunoblot to identify PGRN antibodies that either (E) detect single linker regions of PGRN or (F) detect GRNs. The specific PGRN linker or GRN(s) detected are listed under each antibody. Detailed information about the PGRN antibodies screened can be found in Table 3. Asterisks (*) denote nonspecific protein bands.
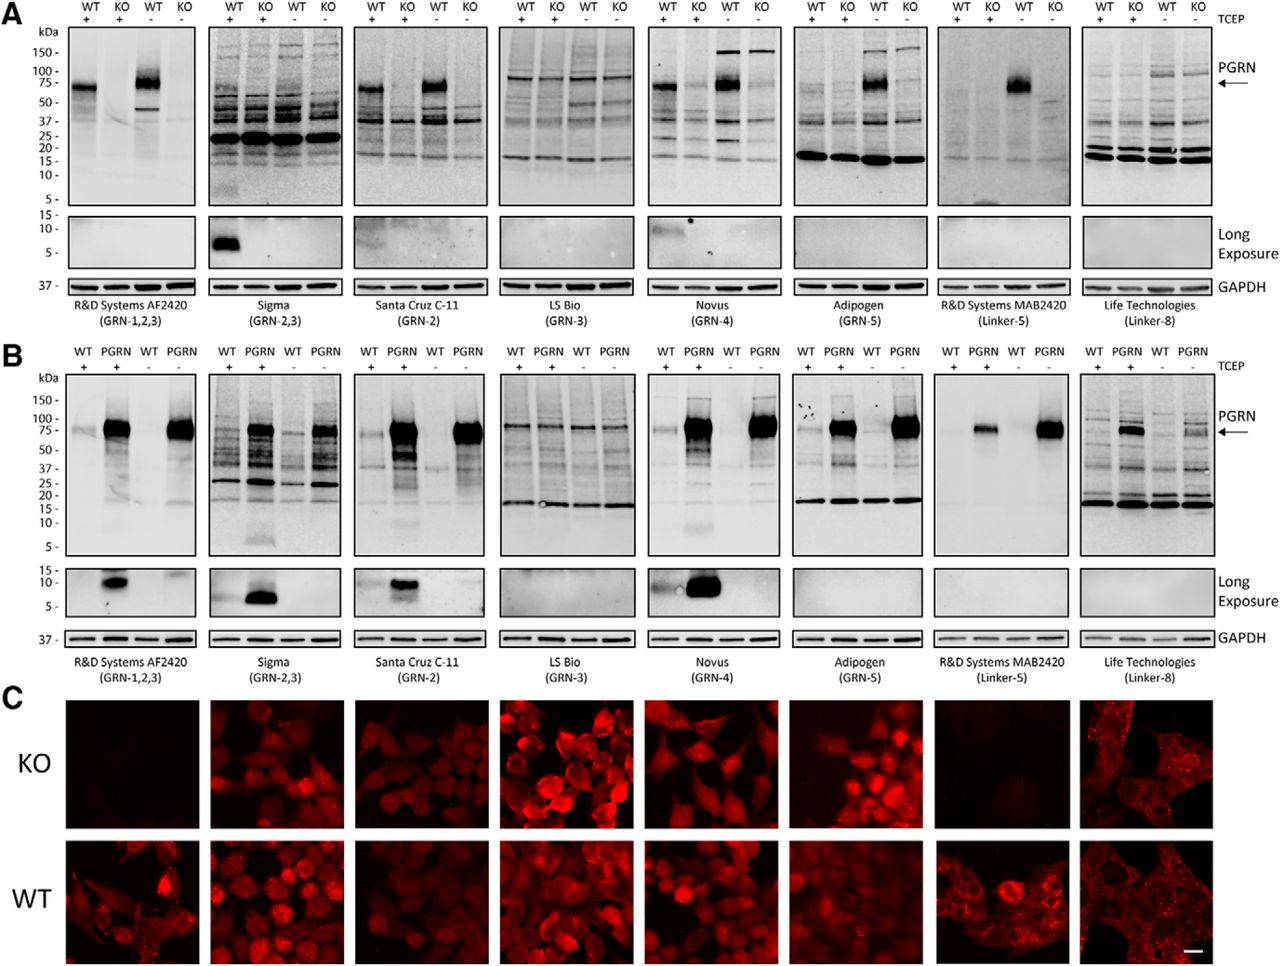
- Figure 2.
Specificity of PGRN antibodies and detection of multiple endogenous GRNs. A, Whole-cell lysates from HAP1 WT and HAP1 PGRN KO cells, either reduced (+TCEP) or nonreduced (-TCEP), were analyzed for PGRN antibody specificity by immunoblot. The bottoms of the blots (<15 kDa) were exposed longer to reveal levels of endogenous GRNs. B, Whole-cell lysates from HEK293T WT and N-TAP PGRN stable overexpressing (PGRN) cells were analyzed as in A by immunoblot. C, Representative immunofluorescent images of HAP1 PGRN KO and WT cells stained with the corresponding PGRN antibodies as in A and B. Scale bar, 10 µm.
- Figure 3.
Endogenous GRNs are found intracellularly in a variety of cell types. A, Whole-cell lysates (30 µg total protein) from commonly used cell types were analyzed for intracellular PGRN and GRN-2,3 by immunoblot. The entire Sigma immunoblot is shown to highlight the prominent nonspecific bands detected by the antibody (see PGRN KO lane). B, Serum-free Opti-MEM media alone or conditioned media from HEK-PGRN cells grown for 24 h was concentrated, run on SDS-PAGE, and transferred to nitrocellulose membrane. Total proteins were visualized with REVERT total protein stain (LiCor) to ensure retention of low MW proteins. The bands designated with asterisks (*) indicate proteins found in Opti-MEM media alone whereas the arrow points to secreted N-TAP PGRN. C, Concentrated serum-free conditioned media from HEK-PGRN cells was analyzed for secreted cathepsin D, PGRN (R&D AF2420), and GRNs by immunoblot. All images are representative of at least two independent experiments.
- Figure 4.
Endocytosed PGRN is rapidly processed into stable, mature GRNs. A, HAP1 PGRN KO cells were pulsed with mCherry-PGRN (5 µg/ml) in the media for 24 h and then chased with fresh media without PGRN for various lengths of time. Lysates were analyzed for PGRN (R&D AF2420), GRN-2,3 (Sigma), and GRN-4 (Novus) by immunoblot. Equal volumes of lysates were run for each time point to account for differences in cell growth and measurements were normalized to untreated control (PGRN KO) background signal. Asterisks (*) denote nonspecific proteins. B, Quantification of PGRN and GRNs from A. Data represent mean ± SEM of three independent replicates for each time point normalized to t = 0 h control. C, D, HAP1 PGRN KO cells pulsed with mCherry-PGRN (5 µg/ml) for 24 h (t = 0 h) and then chased with fresh media for 6 h (t = 6 h) were immunolabeled with either (C) R&D AF2420 (recognizes multiple PGRN linkers and GRNs) or (D) R&D MAB2420 (recognizes only linker-5 of PGRN). Untreated HAP1 WT and PGRN KO cells are shown as specificity controls for antibody labeling. E, top, HAP1 PGRN KO cells were transfected with GRN(-linker) constructs and immunolabeled with R&D AF2420. Scale bar, 5 µm. Bottom, nonreduced (-TCEP) lysates from HEK293T cells transfected with GRN(-linker) constructs were immunoblotted with R&D AF2420.
- Figure 5.
GRNs localize to lysosomes. A, HeLa cells were double immunolabeled with PGRN (R&D AF2420) and LAMP1 antibodies. B, Endogenous HeLa proteins were separated by density-based gradient centrifugation and individual fractions (1-12) were analyzed for PGRN (R&D AF2420), GRN-2,3 (Sigma), and organelle markers by immunoblot. Results are representative of two independent experiments. C, HAP1 PGRN KO cells were pulse-chased (24-h pulse/6-h chase) with mCherry-PGRN (5 µg/ml) and then double immunolabeled for GRNs (R&D AF2420) and organelle markers. White arrows indicate colocalization of GRNs and LAMP1. Scale bar, 10 µm. D, HAP1 GRN KO cells were pulse-chased as in C, double immunolabeled for GRNs (R&D AF2420) and LAMP1, and imaged using Super Resolution microscopy. All z-stacks included. Scale bar, 2 µm. E, Magnified regions of D show that GRNs are mostly found associated with the inner membrane of LAMP1-positive lysosomes (white arrows). Select z-stacks of D shown for clarity. Scale bar, 1 µm.
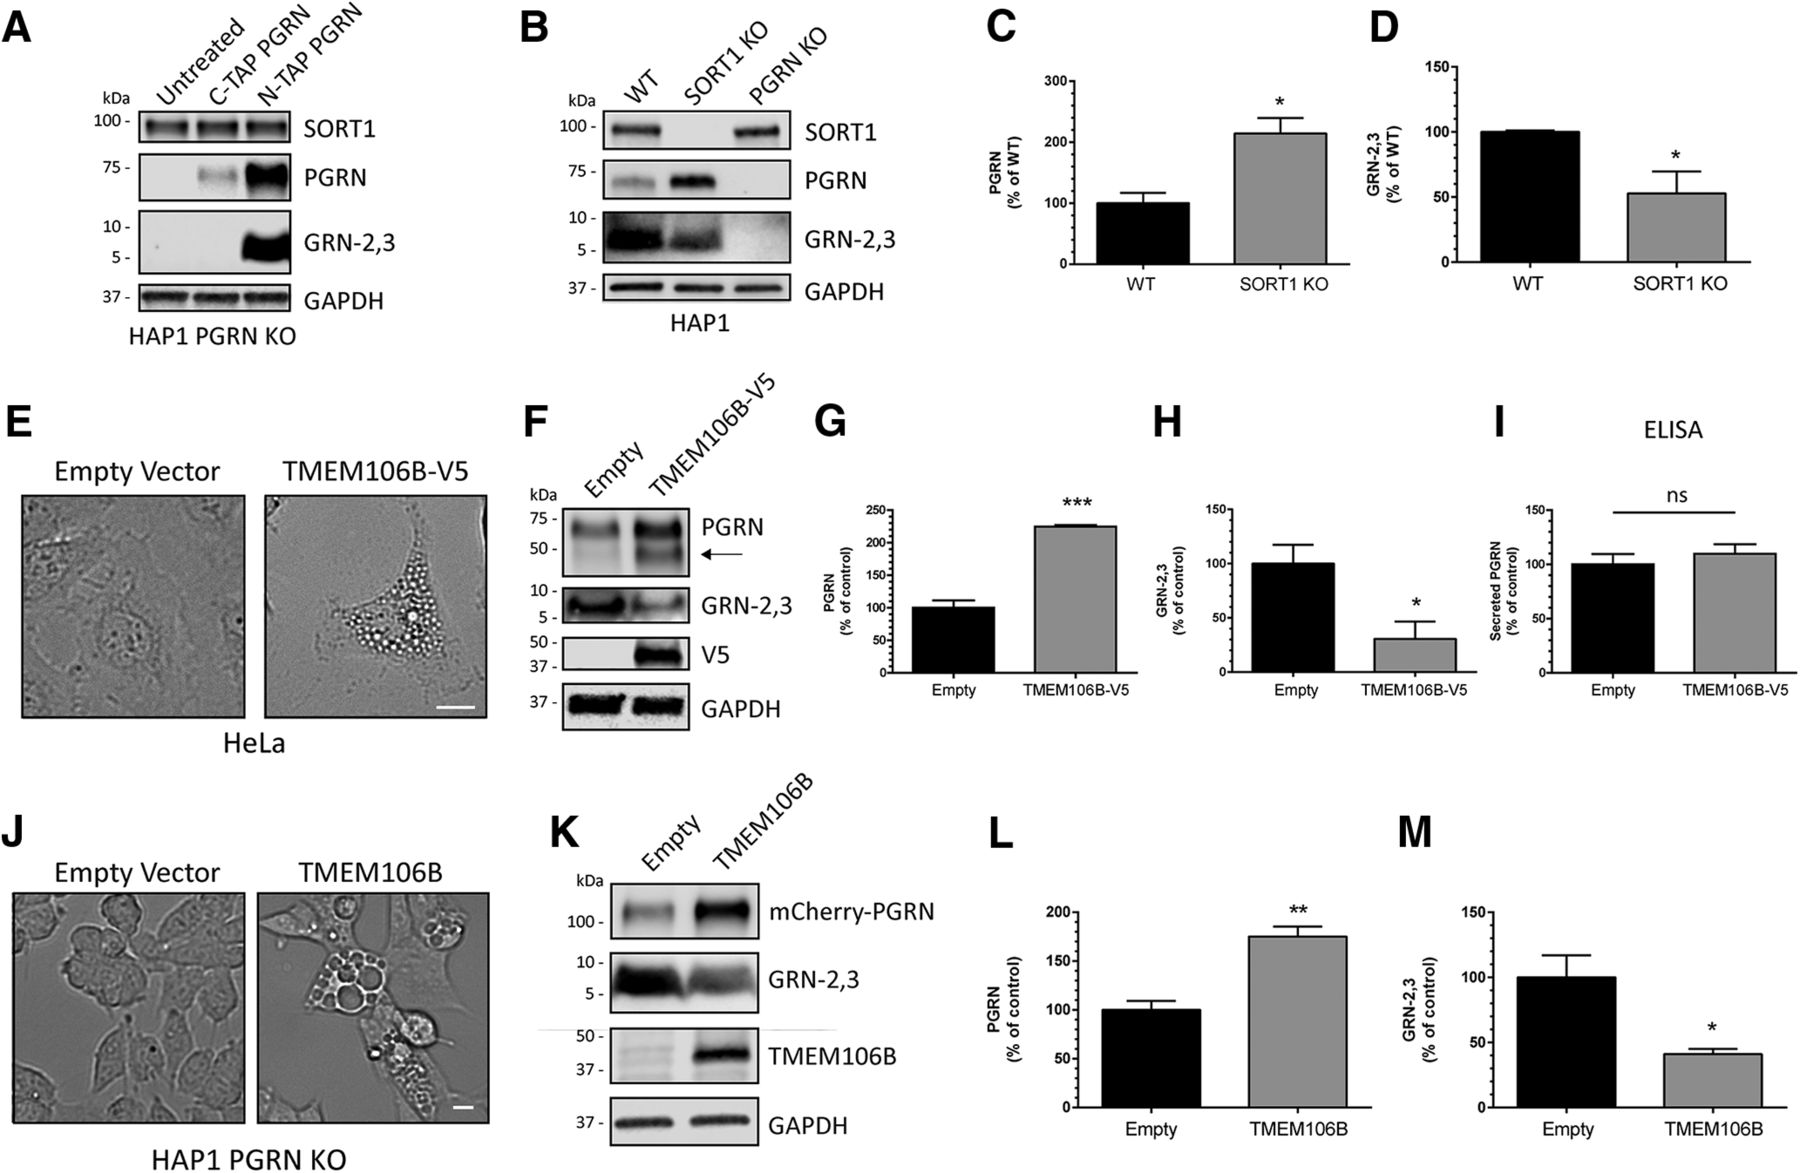
- Figure 6.
GRN levels are regulated by SORT1 and TMEM106B expression. A, HAP1 PGRN KO cells were treated with C-TAP PGRN or N-TAP PGRN (5 µg/ml) for 24 h and lysates were analyzed for PGRN and GRN-2,3 by immunoblot. B, HAP1 WT, SORT1 KO, and PGRN KO cell lysates were analyzed for endogenous levels of SORT1, PGRN, and GRN-2,3 by immunoblot. C, D, Quantification of (C) PGRN and (D) GRN-2,3 from the experiment in B. E, Overexpression of TMEM106B in HeLa cells for 48-h results in the formation of large vacuoles. Scale bar, 20 µm. F, HeLa cells were transfected with empty vector or TMEM106B for 48 h and lysates were analyzed for PGRN and GRN-2,3 by immunoblot. G-I, Quantification of (G) intracellular PGRN, (H) intracellular GRN-2,3, and (I) secreted PGRN (by ELISA) from the experiment in F. Arrow in F denotes endogenous, intermediate PGRN cleavage product. J, Overexpression of TMEM106B for 24 h in HAP1 PGRN KO cells results in the formation of large vacuoles. Scale bar, 10 µm. K, HAP1 PGRN KO cells were transfected with TMEM106B for 24 h and then treated with mCherry-PGRN (5 µg/ml) for an additional 24 h. Lysates were analyzed for PGRN and GRN-2,3 by immunoblot. L, M, Quantification of (L) PGRN and (M) GRN-2,3 from the experiment in K. For all immunoblots, PGRN and GRN-2,3 were detected with R&D AF2420 and Sigma antibodies, respectively. All immunoblot images are representative of at least three independent experiments and quantitative data are presented as mean ± SEM of three independent experiments; *differs from control p < 0.05; **p < 0.01; ***p < 0.001; ns = not significant.
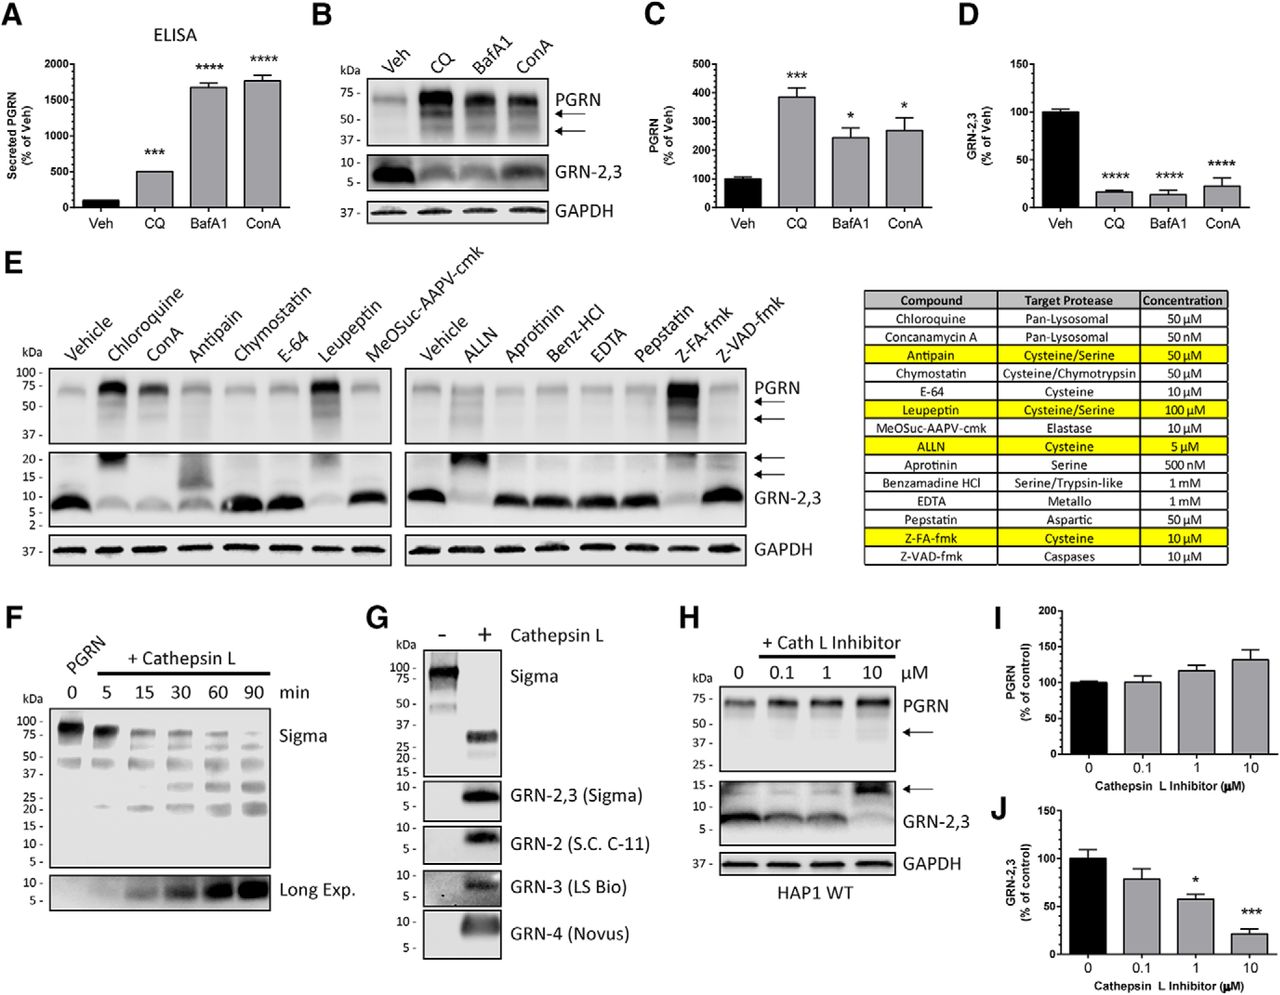
- Figure 7.
PGRN processing into GRNs is mediated by proper lysosome function and cysteine protease activity. A, HAP1 WT cells were treated for 24 h with the pan-lysosome inhibitors chloroquine (CQ; 50 µM), BafA1 (50 nM), or concanamycin A (ConA; 50 nM) and conditioned media were analyzed for secreted PGRN by ELISA. B, Lysates from HAP1 WT cells treated as in A were analyzed for PGRN and GRN-2,3 by immunoblot. C, D, Quantification of (C) PGRN and (D) GRN-2,3 from the experiment in B. E, HAP1 WT cells were treated with the indicated protease inhibitors for 24 h and analyzed for PGRN and GRN-2,3 by immunoblot. The inhibitors, their primary targets, and concentrations used are shown in the table at right. F, Time-dependent cleavage of C-TAP PGRN by recombinant cathepsin L in vitro. G, C-TAP PGRN was incubated with or without cathepsin L for 2 h in vitro and analyzed for multiple GRNs by immunoblot. H, HAP1 WT cells were treated with increasing concentrations of cathepsin L inhibitor II (Z-FY-CHO) for 40 h and lysates were analyzed for PGRN and GRN-2,3 by immunoblot. I, J, Quantification of (I) PGRN and (J) GRN-2,3 from the experiment in H. B, E, H, Arrows denote endogenous, intermediate PGRN cleavage products. For all immunoblots, PGRN and GRN-2,3 were detected with R&D AF2420 and Sigma antibodies respectively. All immunoblot images are representative of at least three independent experiments and quantitative data are presented as mean ± SEM of three independent experiments; *differs from control p < 0.05; **p < 0.01; ***p < 0.001; ****p < 0.0001.
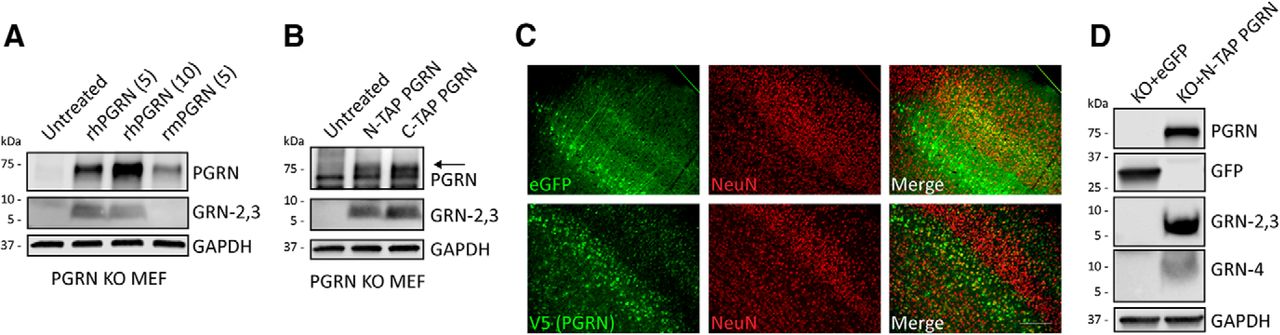
- Figure 8.
Human PGRN is processed into GRNs in mouse cells and in mouse brain. A, PGRN KO MEF cells were treated with recombinant human PGRN (5 or 10 µg/ml) or recombinant mouse PGRN (5 µg/ml) in the media for 24 h and lysates were analyzed for PGRN (R&D AF2420) and GRN-2,3 (Sigma) by immunoblot. R&D AF2420 displays some cross-reactivity with mouse PGRN. B, PGRN KO MEF cells were treated with N-TAP or C-TAP human PGRN (5 µg/ml) in the media for 24 h and lysates were analyzed for PGRN and GRN-2,3 by immunoblot. C, Cortical sections from three-month-old GRN KO mice injected with AAV2/1-eGFP or AAV2/1-NTAP-PGRN at P = 0 show colocalization of eGFP or PGRN (V5) expression with the neuronal marker NeuN. Scale bar, 200 µm. D, Brain tissue lysates from 14-month-old GRN KO mice injected as in C were analyzed for human PGRN (R&D AF2420) and GRNs (-2,3; Sigma and -4; Novus) by immunoblot. Immunoblots in A, B are representative of two independent experiments each. Images in C, D are representative of at least three independent eGFP- or PGRN-injected mice.
- Figure 9.
FTD patients with a GRN mutation (FTD-GRN) are haploinsufficient for multiple GRNs. A, Primary fibroblast lysates from three control and three FTD-GRN patients were analyzed for PGRN and GRNs by immunoblot. B-D, Quantification of (B) PGRN, (C) GRN-2,3 (Sigma), and (D) GRN-4 (Novus) from the experiment in A. E, Full-blot images of soluble brain lysates from five control and five FTD-GRN patients using Sigma or Novus anti-GRN antibodies showing predominant nonspecific protein detection (denoted by *). F, The same samples from E were run on SDS-PAGE and analyzed for mature GRNs by immunoblot as outlined in Materials and Methods. Immunoblots for insoluble p62 indicate disease-associated pathology in the FTD-GRN cases. G-I, Quantification of (G) GRN-2,3 (Sigma) and (H) GRN-4 (Novus) from the experiment in F. I, Quantification of PGRN in the same soluble brain lysates from F by ELISA. All data represent the mean ± SEM; *differs from control p < 0.05; **p < 0.01; ***p < 0.001.
- Figure 10.
Model of intracellular processing of PGRN into stable, lysosomal GRNs. Sortilin and other receptors target endocytosed and newly synthesized PGRN to lysosomes. Within lysosomes, PGRN is proteolytically cleaved, in part, by cysteine proteases (i.e., cathepsin L) into mature, stable GRN proteins. Ablation of sortilin results in the reduced production of GRNs. Further, lysosome dysfunction caused by alkalizing agents or TMEM106B overexpression inhibits the processing of PGRN into GRNs. FTD-GRN patients are haploinsufficient for GRNs, which may drive lysosome dysfunction leading to neurodegeneration.


Tables
Figure Structure of the data Type of test p value 95% confidence intervals Fig. 6C, intracellular PGRN in WT vs SORT1-KO lysates (n = 3 independent replicates) Normal distribution Unpaired t test p = 0.0196 30.13 to 198.5 Fig. 6D, intracellular GRN-2,3 in WT vs SORT1-KO lysates (n = 3 independent replicates) Normal distribution Unpaired t test p = 0.0486 -93.93 to -0.4729 Fig. 6G, intracellular PGRN in TMEM106B-expressing HeLa lysates (n = 3 independent replicates) Normal distribution Unpaired t test p = 0.0005 91.99 to 157.9 Fig. 6H, intracellular GRN-2,3 in TMEM106B-expressing HeLa lysates (n = 3 independent replicates) Normal distribution Unpaired t test p = 0.0426 -134.8 to -3.742 Fig. 6I, secreted PGRN in TMEM106B-expressing HeLa cell media (n = 3 independent replicates) Normal distribution Unpaired t test p = 0.4803 -25.64 to 45.58 Fig. 6L, intracellular PGRN in TMEM106B-expressing PGRN KO cells pulsed with PGRN (n = 3 independent replicates) Normal distribution Unpaired t test p = 0.0055 36.84 to 113.6 Fig. 6M, intracellular GRN-2,3 in TMEM106B-expressing PGRN KO cells pulsed with PGRN (n = 3 independent replicates) Normal distribution Unpaired t test p = 0.0282 -107.5 to -10.32 Fig. 7A, secreted PGRN in treated HAP1 cell media (n = 3 independent replicates) Normal distribution One-way ANOVA p = 0.0009, p < 0.0001, p < 0.0001 -602.5 to -207.5; -1774 to -1380; -1865 to -1471 Fig. 7C, intracellular PGRN in treated HAP1 cell lysates (n = 3 independent replicates) Normal distribution One-way ANOVA p = 0.0007, p = 0.0332, p = 0.0151 -417.2 to -153.8; -276.1 to -12.74; -301.2 to -37.84 Fig. 7D, intracellular GRN-2,3 in treated HAP1 cell lysates (n = 3 independent replicates) Normal distribution One-way ANOVA p < 0.0001 for all 3 treatments 62.35 to 104.7; 65.25 to 107.6; 56.25 to 98.55 Fig. 7I, intracellular PGRN in cathepsin L inhibitor-treated HAP1 cell lysates (n = 3 independent replicates) Normal distribution One-way ANOVA p > 0.9999, p= 0.5501, p = 0.1055 -39.01 to 37.81; -54.91 to 21.91; -70.11 to 6.712 Fig. 7J, intracellular GRN-2,3 in cathepsin L inhibitor-treated HAP1 cell lysates (n = 3 independent replicates) Normal distribution One-way ANOVA p = 0.2116, p = 0.0144, p = 0.0003 62.35 to 104.7; 65.25 to 107.6; 56.25 to 98.55 Fig. 9B, intracellular PGRN in human fibroblasts (3 independent patient lines for control and FTD-GRN) Normal distribution Unpaired t test p = 0.0030 -71.47 to -28.33 Fig. 9C, intracellular GRN-2,3 in human fibroblasts (3 independent patient lines for control and FTD-GRN) Normal distribution Unpaired t test p = 0.0023 -75.34 to -31.98 Fig. 9D, intracellular GRN-4 in human fibroblasts (3 independent patient lines for control and FTD-GRN) Normal distribution Unpaired t test p = 0.0176 -90.57 to -15.19 Fig. 9F, GRN-2,3 expression in human brain tissue (5 independent patient samples for control and FTD-GRN) Normal distribution Unpaired t test p = 0.0123 -106.3 to -17.49 Fig. 9G, GRN-4 expression in human brain tissue (5 independent patient samples for control and FTD-GRN) Normal distribution Unpaired t test p = 0.0005 -83.70 to -35.11 Fig. 9H, PGRN expression by ELISA in human brain tissue (5 independent patient samples for control and FTD-GRN) Normal distribution Unpaired t test p = 0.0403 -78.11 to -2.261 Construct Amino acid sequence Para-GRN + linker-1 MWTLVSWVALTAGLVAGSAWSHPQFEKGGGSGGGSGGSAWSHPQFEKGASDYKDDDDKTRCPDGQFCPVACCLDPGGASYSCCRPLLDKWPTTLSRHL Granulin-1 + linker 2 MWTLVSWVALTAGLVAGSAWSHPQFEKGGGSGGGSGGSAWSHPQFEKGASDYKDDDDKGGPCQVDAHCSAGHSCIFTVSGTSSCCPFPEAVACGDGHHCCPRGFHCSADGRSCFQRSGNNSVG Granulin-2 + linker 3 MWTLVSWVALTAGLVAGSAWSHPQFEKGGGSGGGSGGSAWSHPQFEKGASDYKDDDDKAIQCPDSQFECPDFSTCCVMVDGSWGCCPMPQASCCEDRVHCCPHGAFCDLVHTRCITPTGTHPLAKKLPAQRTNRAVALSS Granulin-3 + linker 4 MWTLVSWVALTAGLVAGSAWSHPQFEKGGGSGGGSGGSAWSHPQFEKGASDYKDDDDKSVMCPDARSRCPDGSTCCELPSGKYGCCPMPNATCCSDHLHCCPQDTVCDLIQSKCLSKENATTDLLTKLPAHTVG Granulin-4 + linker 5 MWTLVSWVALTAGLVAGSAWSHPQFEKGGGSGGGSGGSAWSHPQFEKGASDYKDDDDKDVKCDMEVSCPDGYTCCRLQSGAWGCCPFTQAVCCEDHIHCCPAGFTCDTQKGTCEQGPHQVPWMEKAPAHLSLPDPQALKR Granulin-5 + linker 6 MWTLVSWVALTAGLVAGSAWSHPQFEKGGGSGGGSGGSAWSHPQFEKGASDYKDDDDKDVPCDNVSSCPSSDTCCQLTSGEWGCCPIPEAVCCSDHQHCCPQGYTCVAEGQCQRGSEIVAGLEKMPARRASLSHPR Granulin-6 + linker 7 MWTLVSWVALTAGLVAGSAWSHPQFEKGGGSGGGSGGSAWSHPQFEKGASDYKDDDDKDIGCDQHTSCPVGQTCCPSLGGSWACCQLPHAVCCEDRQHCCPAGYTCNVKARSCEKEVVSAQPATFLARSPHVGVK Granulin-7 + linker 8 MWTLVSWVALTAGLVAGSAWSHPQFEKGGGSGGGSGGSAWSHPQFEKGASDYKDDDDKDVECGEGHFCHDNQTCCRDNRQGWACCPYRQGVCCADRRHCCPAGFRCAARGTKCLRREAPRWDAPLRDPALRQLL Para-GRN – linker-1 MWTLVSWVALTAGLVAGSAWSHPQFEKGGGSGGGSGGSAWSHPQFEKGASDYKDDDDKTRCPDGQFCPVACCLDPGGASYSCCRPLLD Granulin-1 –
linker 2MWTLVSWVALTAGLVAGSAWSHPQFEKGGGSGGGSGGSAWSHPQFEKGASDYKDDDDKGGPCQVDAHCSAGHSCIFTVSGTSSCCPFPEAVACGDGHHCCPRGFHCSADGRSCFQ Granulin-2 – linker 3 MWTLVSWVALTAGLVAGSAWSHPQFEKGGGSGGGSGGSAWSHPQFEKGASDYKDDDDKAIQCPDSQFECPDFSTCCVMVDGSWGCCPMPQASCCEDRVHCCPHGAFCDLVHTRCIT Granulin-3 –
linker 4MWTLVSWVALTAGLVAGSAWSHPQFEKGGGSGGGSGGSAWSHPQFEKGASDYKDDDDKSVMCPDARSRCPDGSTCCELPSGKYGCCPMPNATCCSDHLHCCPQDTVCDLIQSKCLS Granulin-4 –
linker 5MWTLVSWVALTAGLVAGSAWSHPQFEKGGGSGGGSGGSAWSHPQFEKGASDYKDDDDKDVKCDMEVSCPDGYTCCRLQSGAWGCCPFTQAVCCEDHIHCCPAGFTCDTQKGTCEQ Granulin-5 – linker 6 MWTLVSWVALTAGLVAGSAWSHPQFEKGGGSGGGSGGSAWSHPQFEKGASDYKDDDDKDVPCDNVSSCPSSDTCCQLTSGEWGCCPIPEAVCCSDHQHCCPQGYTCVAEGQCQR Granulin-6 –
linker 7MWTLVSWVALTAGLVAGSAWSHPQFEKGGGSGGGSGGSAWSHPQFEKGASDYKDDDDKDIGCDQHTSCPVGQTCCPSLGGSWACCQLPHAVCCEDRQHCCPAGYTCNVKARSCEK Granulin-7 – linker 8 MWTLVSWVALTAGLVAGSAWSHPQFEKGGGSGGGSGGSAWSHPQFEKGASDYKDDDDKDVECGEGHFCHDNQTCCRDNRQGWACCPYRQGVCCADRRHCCPAGFRCAARGTKCLR Each construct contains the human PGRN signal peptide followed by a twin-strep/FLAG tag (italicized) before the GRN ± linker domains.
Vendor Catalog number/(RRID) Species Clonality Immunogen Antibody stock Immunoblot dilution ICC dilution R&D Systems AF2420/(2114489) Goat Poly aa 18-593 1 µg/µl 1:500-1:1000 1:500 R&D Systems MAB2420/(2114488) Mouse Mono aa 18-593 1 µg/µl 1:500-1:1000 1:300 Sigma (Atlas) HPA008763/(1234492) Rabbit Poly aa 128-271 0.1 µg/µl 1:500-1:1000 1:250 Life Technologies 40-3400/(2533461) Rabbit Poly C-terminal protein 0.25 µg/µl 1:500-1:1000 1:50 Novus/SDIX 26320002/(2114484) Rabbit Poly aa 289-426 0.5 µg/µl 1:500 1:250 Abcam/Epitomics ab108608/EPR3781/(10888818) Rabbit Mono Synthetic protein 0.5 µg/µl 1:500 N/A ENZO ALX-804-737-C100/(2052325) Mouse Mono Human PGRN 1 µg/µl 1:1000 N/A Santa Cruz (C-11) sc-377036/(Not listed) Mouse Mono aa 21-320 0.2 µg/µl 1:250 1:50 GenScript Linker-3 (custom)/(n/a) Rabbit Poly aa 187-200 LAKKLPAQRTNRAVC 0.18 µg/µl 1:10,000 N/A Custom 4C1 (custom)/(n/a) Mouse Mono Human C-TAP PGRN Unknown 1:50 N/A LS BIO LS-C154960/(Not listed) Goat Poly aa 248-259 0.5 µg/µl 1:500 1:50 Adipogen AG-25A-0090-C100/(249045) Rabbit Poly Human GRN C 1 µg/µl 1:1000 1:250 aa = amino acid, ICC = immunocytochemistry
Primary neuropathologic diagnosis Sex Age at death (years) PMI (h) Disease duration (years) Control F 60 8 - Control F 57 17 - Control M 59 6 - Control M 65 - - Control M 70 4.5 - FTD-GRN M 63 - 5 FTD-GRN M 71 15.5 4.5 FTD-GRN F 61 6 6 FTD-GRN F 61 7 6 FTD-GRN F 62 11.5 10 Group Sex (M/F) Mean ± SEM Mean ± SEM Mean ± SEM Control 5 (3/2) 62.2 ± 2.36 8.9 ± 2.80 - FTD-GRN 5 (2/3) 63.6 ± 1.89 10.0 ± 2.19 6.3 ± 0.97
In this issue


