

Article Figures & Data
- Figure 1.
The distribution of NPC endfeet and blood vessels across the pial surface changes during development. A, Vimentin-labeled blood vessels and NPC endfeet in stage 40, 45, and 47 tadpole optic tectum. Images are maximum projections of the first 50 μm from the dorsal surface of the tectum. Scale bar: 100 μm. B, Higher magnification of the box in A. Serial optical sections (advancing ventrally from left to right, at the indicated depths) through stage 47 tectum with Vimentin-labeled blood vessels and NPC endfeet. The vasculature is present in the two dorsal sections (left panels). The outline of the vasculature (red) is overlaid across all sections to show the distribution of Vimentin-labeled endfeet along the ventral aspect of the blood vessels (two rightmost panels). Scale bar: 20 µm. C, Maximum projection image of Vimentin-labeled NPCs (green) and vasculature in a stage 47 Flk1:GFP (magenta) transgenic X. laevis tadpole. Scale bar: 100 μm. D, Magnification of the labeled box in C in single orthogonal sections, showing the association between blood vessels (magenta) and NPC endfeet (green) across cross-sectional planes in XY, YZ, and XZ. Scale bar: 20 μm. E-G, Magnification of the labeled box in C, as a maximum projection, showing a representative tectum for the calculation of endfoot density. Scale bar: 20 μm. E, The vascular ROI (red) was designated using the Flk1:GFP channel (magenta) to manually trace a blood vessel. F, Overlay of the vascular ROI (red) on the Vimentin channel (white), with red asterisks indicating endfeet counts within the ROI. G, Overlay of the avascular ROIs (yellow) on the Vimentin channel (white), with yellow asterisks indicating endfeet counts within the ROI.
- Figure 2.
NPC endfeet appose the vasculature in the developing tectum. A, Schematics of the X. laevis experimental system. Brain regions are indicated in the sketch of the dorsal view of the tadpole head (top). The heart and intracardial dextran injection are shown in a sketch of the ventral view (lower left) and labeled vasculature in a drawing of the dorsal tectum (lower right). B, A representative image (right) of dextran-labeled blood vessels (magenta) and NPCs (green) labeled by electroporation of pCAG::GFP. 42.7% of labeled NPCs (n = 511) have endfeet (arrows) that are apposed to the vasculature. Scale bar: 50 μm. C, C’, D, D’, Examples of pCAG::GFP-labeled NPCs (green) whose endfeet (arrows) are apposed to the vasculature (magenta). C’, D’, 3D rotations of regions with NPC endfeet highlighted by arrows in C, D, respectively, showing vascular apposition. Scale bars: 50 and 20 μm. E, Projection of a confocal stack through tectum with pCAG::GFP-labeled NPCs (green) and dextran-labeled vasculature (magenta). Automated vessel and endfoot tracing (white) on a representative cell, with the shortest distance between the endfoot centroid and vessel edge (yellow), computed in 3D. Scale bar: 20 μm. F, Histogram of the distances, computed in 3D, between endfoot centroids and the closest vessel edge (n = 200 NPCs). G, Representative in vivo time lapse images of a pSox2bd::mGFP-labeled NPC endfoot, collected at two time points: 0 min (green) and 4 min (magenta). The overlay in the right panel highlights rapid extensions (arrows) and retractions (asterisk) of the NPC endfoot’s filopodia. Scale bar: 10 μm. H, DiI-labeled NPCs (green) in late stage 46 Flk1:GFP (magenta) transgenic X. laevis tadpoles. Scale bar: 100 μm. H’, Magnification of the boxed region in H showing the association between blood vessels (magenta) and NPC endfeet (green) in single orthogonal sections of cross-sectional planes in XY, YZ, and XZ. Scale bar: 10 μm.
- Figure 3.
Neuronal processes and growth cones are closely associated with the vasculature in developing Xenopus tectum. A, In vivo imaging of neuronal processes (green) and the vasculature (magenta) in stage 47 NBT:GFP transgenic X. laevis tadpoles. Images are maximum projections of the first 60 μm below the dorsal surface of the tectum. Scale bar: 100 μm. B, Magnification of the box in A in single orthogonal sections, showing the association between blood vessels (magenta) and neuronal processes (green) across cross-sectional planes in XY, YZ, and XZ. Scale bar: 20 μm. C, D, Examples of GFP+ electroporated cells (green) and their association with dextran-labeled blood vessels (magenta). Boxes show examples of GFP+ neuronal growth cones that are closely apposed to the vasculature. Scale bars: 100 μm. C’, D’, Magnification of the boxes in C, D, respectively. Single orthogonal sections show association between blood vessels (magenta) and neuronal growth cones (green) across cross-sectional planes in XY, YZ, and XZ. Scale bars: 10 μm.
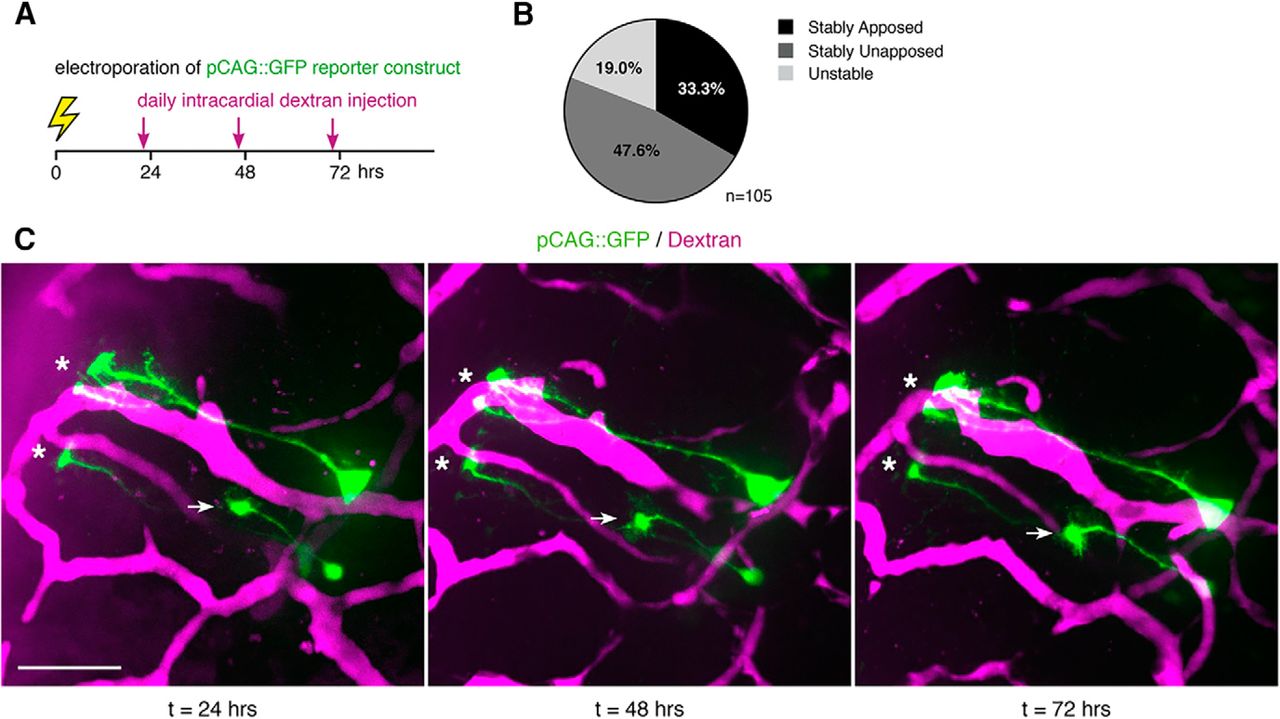
- Figure 4.
NPC endfeet maintain proximity to the vasculature. A, Schematic of the experimental timeline. NPCs in late stage 46 tadpoles were electroporated with pCAG::GFP, and the vasculature was labeled by intracardial injection with fluorescent dextran just before each imaging time point at 24, 48, and 72 h after electroporation. B, The percentages of NPCs (n = 105) that are stably apposed (33.3%), stably unapposed (47.6%), and unstable (19.0%) across 3 d of in vivo imaging. C, A representative in vivo time lapse image series of pCAG::GFP-labeled NPCs (green) and dextran-labeled vasculature (magenta) collected at daily intervals over 72 h. Asterisks indicate endfeet that remain stably apposed, arrow indicates endfoot that remains stably unapposed to the vasculature across the 72-h imaging interval. Scale bar: 50 μm.
- Figure 5.
NPCs take up vascular-circulating molecules. A, Schematic of the intracardial injection procedure to introduce fluorescent dextrans into the vasculature. After allowing the fluorescent dextrans to circulate for 5 h, the animals were killed and processed for immunohistochemistry. B, Serial optical sections from dorsal to ventral tectum show widespread labeling of tectal cells by vascular-circulating dextrans (green). In dorsal tectum, box 1 shows dextran-labeled cells in caudolateral tectum, within the proliferative zone along the ventricle. More ventrally, box 2 shows dextran-labeled cells along the midline, also within the tectal proliferative zone. Scale bar: 100 μm. C, Dextran-labeled cells (green) in the caudolateral proliferative zone are colabeled with antibodies against Sox2/3 (magenta), an NPC marker. Scale bar: 50 μm. C’, Enlargement of the box from C. Arrows indicate examples of Dextran+Sox2/3+ cells. Scale bar: 20 μm. D, E, Examples of dextran-labeled cells (green) that colabel with Sox2/3 (magenta) within the midline proliferative region. Arrows indicate Dextran+Sox2/3+ cells, and asterisks indicate Dextran+Sox2/3+ cells that are actively dividing and contain two nuclei. Scale bars: 20 μm.
- Figure 6.
Neurons take up vascular-circulating molecules. A, A single optical section through the optic tectum taken 5 h after intracardial dextran injection. Cell close to the neuropil layer that are labeled by taking up vascular-circulating dextrans (green) are colabeled with HuC/D (magenta), a neuronal marker. Scale bar: 100 μm. B, Magnification of box in A. Arrows indicate examples of dextran+ cells (green) that are also HuC/D immunoreactive (magenta). Scale bar: 50 μm. C, Summary schematic of the colocalization of cell-type specific markers in dextran-labeled cells. In dorsal tectum, 93.8 ± 1.38% (n = 12 tadpoles) of dextran-labeled cells in the caudolateral proliferative zone are Sox2/3 immunoreactive. In ventral tectum, 90.3 ± 1.73% (n = 7 tadpoles) of dextran-labeled cells close to the neuropil are HuC/D immunoreactive.
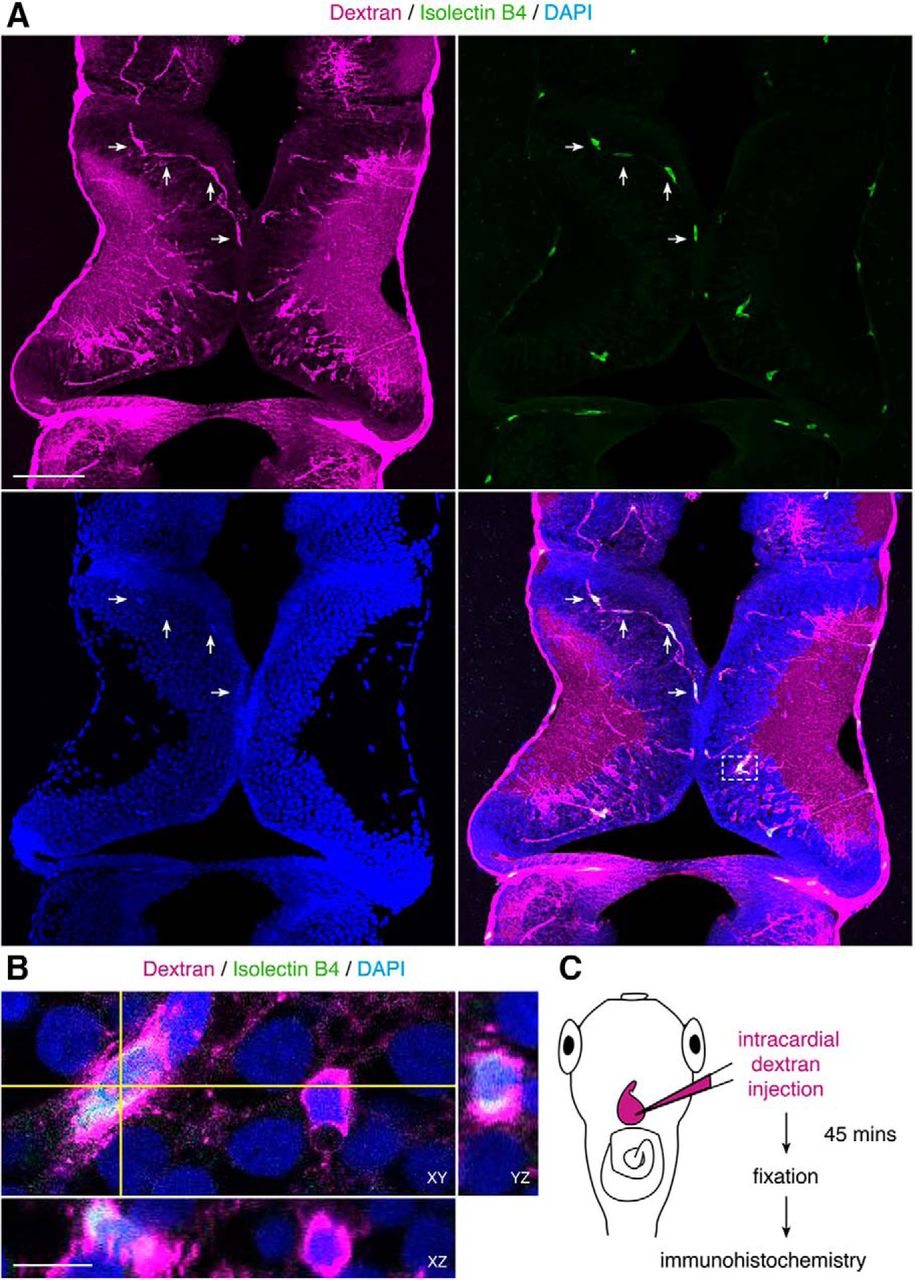
- Figure 7.
Microglia take up vascular-circulating molecules. A, Projection of a 20-μm confocal stack through the optic tectum. Uptake of vascular-circulating dextrans (magenta) by tectal cells labeled with Isolectin B4 (green), a marker for microglia. Nuclei are labeled with DAPI (blue). Arrows indicate examples of Isolectin B4+dextran+ cells that track along dextran-labeled vasculature (magenta). Scale bar: 100 μm. B, Magnification of box in A. Single orthogonal sections show dextran (magenta) uptake in Isolectin B4+ cells (green), across cross-sectional planes in XY, YZ, and XZ. Scale bar: 10 μm. C, Schematic of the intracardial injection procedure to introduce fluorescent dextrans into the vasculature. After allowing the fluorescent dextrans (magenta) to circulate for 45 min, the animals were killed and processed for immunohistochemistry.
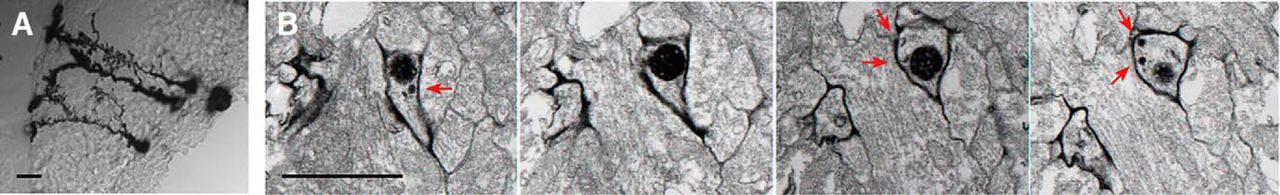
- Figure 8.
NPC endfeet are sites of active endocytosis. A, Image of mHRP-labeled NPCs. Scale bar: 1 μm. B, Micrographs from serial electron microscopic sections demonstrate the ultrastructure of an mHRP-labeled endfoot. Arrows indicate mHRP-labeled multivesicular organelles within the labeled endfoot, consistent with endocytosis in endfeet. Scale bar: 1 μm.
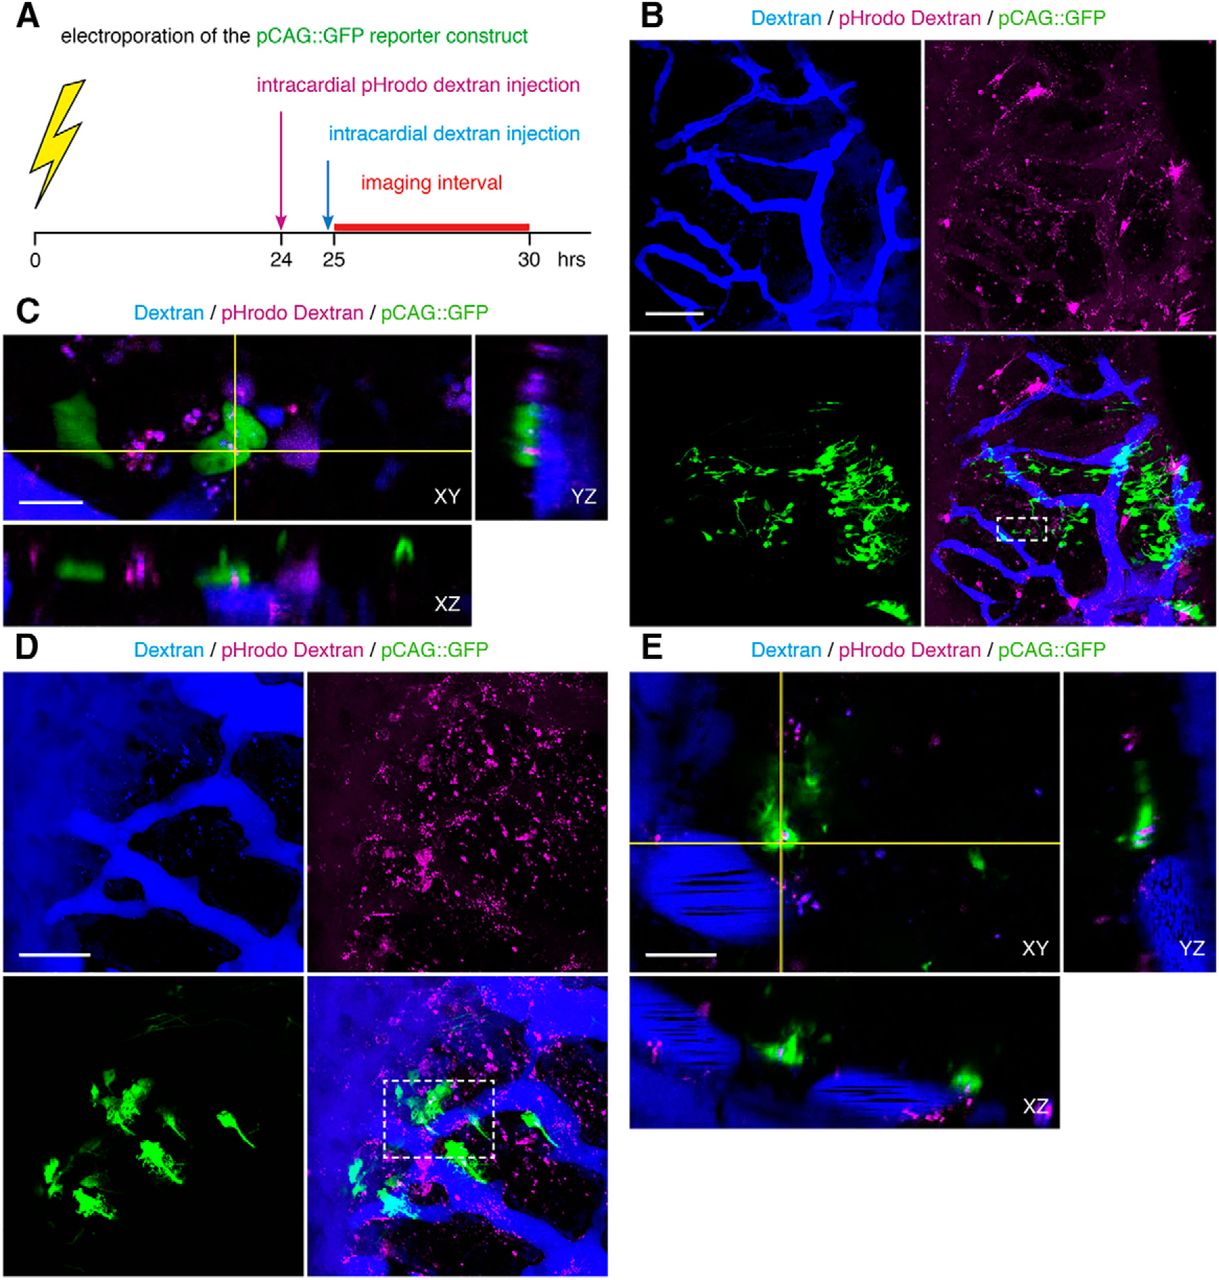
- Figure 9.
NPC endfeet endocytose vascular-circulating molecules. A, Schematic of the experimental timeline. Late stage 46 tadpoles are electroporated with pCAG::GFP to label NPCs, and then intracardially injected with pHrodo dextran 24 h later to label endocytic vesicles with the vascular-derived pHrodo dextran. Within the next few hours, tadpoles are injected again with fluorescent dextran to label the vasculature, and immediately imaged. B, Maximal projection image of a 40-μm confocal stack through tectum with intracardial injections of dextran (blue) and pHrodo dextran (magenta). In images collected 1.5 h after pHrodo dextran injection. pHrodo+ puncta identify endocytic vesicles (magenta) in pCAG::GFP-labeled NPCs (green) that appose the vasculature (blue). The merged image (lower right) shows the distribution of pHrodo+ puncta relative to the vasculature. Scale bar: 100 μm. C, Enlargement of box in B, lower right. Single orthogonal sections, showing the presence of pHrodo+ puncta (magenta) within NPC endfeet (green) that appose the vasculature (blue), across cross-sectional planes in XY, YZ, and XZ. Scale bars: 10 μm. D, Projection of a 30-μm confocal stack through tectum with intracardial injection of dextran (blue) and pHrodo dextran (magenta). In images collected 3.5 h after pHrodo dextran injection, pHrodo+ puncta label endocytic vesicles (magenta) in pCAG::GFP-labeled NPCs (green) that do not appose the vasculature (blue). The merged image (lower right) shows the distribution of pHrodo+ puncta relative to the vasculature. Scale bar: 50 μm. E, Enlargement of box in D, lower right. Single orthogonal sections, showing pHrodo+ puncta (magenta) within NPC endfeet (green) that do not appear to appose the vasculature (blue), across cross-sectional planes in XY, YZ, and XZ. Scale bars: 10 μm.
- Figure 10.
Neuronal growth cones endocytose vascular-circulating molecules. A, Late stage 46 tadpoles are electroporated with pCAG::GFP to label neurons, and then intracardially injected with pHrodo dextran 72 h later to label vascular-derived endocytic vesicles. After 2 h for circulation, tadpoles are injected again with dextran to label the vasculature, and immediately imaged. B, Projection of a 40-μm confocal stack through tectum with intracardial injections of dextran (blue) and pHrodo dextran (magenta). In images collected 2 h after pHrodo dextran injection, pHrodo+ puncta identify endocytic vesicles (magenta) in pCAG::GFP-labeled cells (green) relative to the vasculature (blue). Merged image shows relative location of enlarged neuronal growth cone in C. Scale bar: 100 μm. C, Enlargement of box in B. Single orthogonal sections demonstrate the presence of pHrodo+ puncta (magenta) within a neuronal growth cone (green) that apposes the vasculature (blue), across cross-sectional planes in XY, YZ, and XZ. Scale bars: 10 μm.
- Figure 11.
Actively dividing NPCs are not preferentially apposed to the vasculature. A-D, Maximum projections of (A) the dextran-labeled vasculature (magenta), (B) pCAG::GFP-labeled NPCs (green) and (C) pCMV::RFP-nls-labeled nuclei (cyan), and (D) the merged image. Double nuclei in a single cell identifies actively dividing NPCs. Asterisks indicate NPC endfeet (green) that are apposed to the vasculature (magenta). Arrows (white) indicate NPC endfeet that are unapposed to the vasculature. The far right panel shows magnifications of cells labeled 1-4 in D, with arrows (yellow) indicating the nuclei. From top to bottom, annotated cells contain double, single, double, and single nuclei (cyan). Scale bars: 20 and 10 μm.
- Figure 12.
Vascular apposition does not bias NPCs toward specific neurogenic events. A, Clonal lineages of individual NPCs imaged at 24, 48, and 72 h after electroporation. Each NPC is represented as a horizontal black line, which can split into two horizontal lines to represent a division event. Blue horizontal lines indicate neuronal progeny that were either generated via asymmetric division or direct differentiation of an NPC. B, Proportions of neurogenic events in NPCs whose endfeet are either stably apposed (n = 23 cells), stably unapposed (n = 39 cells), or unstable (n = 14 cells) with respect to the vasculature. No significant (ns) differences by χ2 test (pd = 0.8609). C, Proportions of asymmetric and symmetric division events in dividing NPCs whose endfeet are either stably apposed (n = 5 cells), stably unapposed (n = 9 cells), or unstable (n = 3 cells) with respect to the vasculature. No significant (ns) differences by χ2 test (pg = 0.7454).
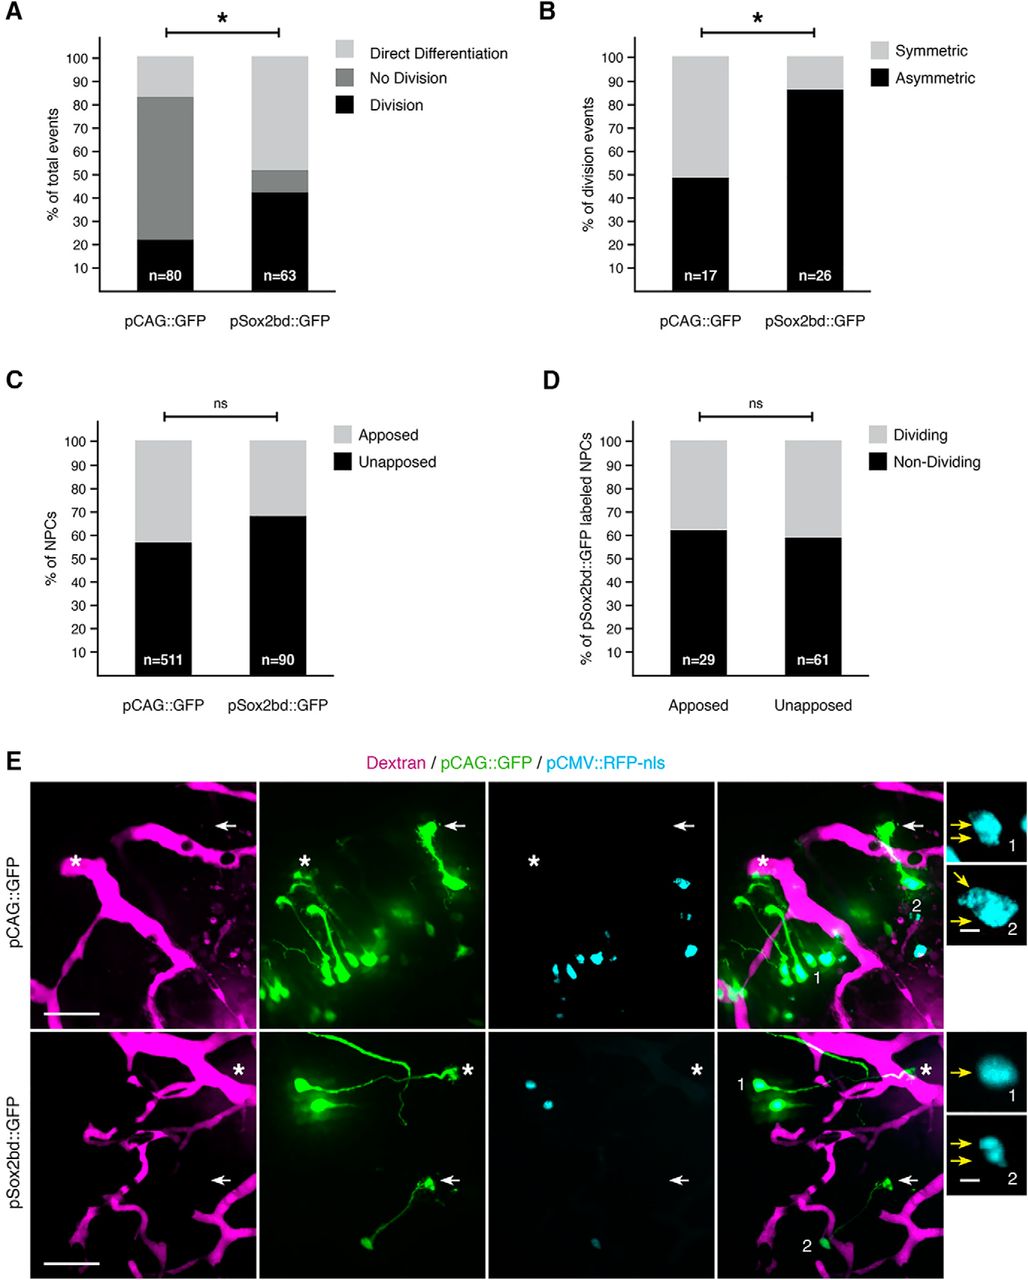
- Figure 13.
Vascular apposition does not correlate with proliferation or differentiation in a neurogenically active subpopulation of NPCs. A, B, Comparison of neurogenic activity between two labeled populations of NPCs. A, Percentages of neurogenic events in NPCs labeled with either pCAG::GFP (n = 80 division events) or pSox2bd::GFP (n = 63 division events). Asterisk indicates a significant difference between the two NPCs populations via χ2 test (ph < 0.0001). B, Percentages of symmetric and asymmetric division events undergone by dividing NPCs labeled with either pCAG::GFP (n = 17 cells) or pSox2bd::GFP (n = 26 cells). Asterisk indicates a significant difference by Fisher’s exact test (pl = 0.0162). C, Percentages of NPCs that are apposed or unapposed to the vasculature, between different populations of labeled NPCs. No significant (ns) differences between pCAG::GFP (n = 511 cells)- and pSox2bd::GFP (n = 90 cells)-labeled NPCs, by Fisher’s exact test (pm = 0.0809). D, Proportions of dividing and nondividing pSox2bd::GFP-labeled NPCs. Percentages for dividing and nondividing NPCs, respectively: apposed: 37.9%, 62.1%; unapposed: 41.0%, 59.0%. No significant (ns) difference between populations of NPCs whose endfeet are either apposed (n = 29 cells) or unapposed (n = 61 cells) to the vasculature, by Fisher’s exact test (pn = 0.8217). E, Electroporation of pCAG::GFP and pCMV::RFP-nls (top row) or pSox2bd::GFP and pSox2bd::RFP-nls (bottom row) to label NPCs (green) and their nuclei (cyan), to evaluate their association with dextran-labeled blood vessels (magenta). Asterisks indicate NPC endfeet that are apposed to the vasculature, while arrows indicate NPC endfeet that are unapposed to the vasculature. The far right panel shows magnifications of cells numbered in the preceding panels. From top to bottom, the annotated NPCs contain double, double, single, and double nuclei. Scale bars: 50 and 5 μm.


Data structure Type of test Power a Normally distributed t test 0.090 b Categorical χ2 test 1.000 c Categorical Fisher’s exact test 0.059 d Categorical χ2 test 0.085 e Categorical Post hoc χ2 test with Bonferroni-corrected α 0.053 f Categorical Post hoc χ2 test with Bonferroni-corrected α 0.148 g Categorical χ2 test 0.097 h Categorical χ2 test 0.999 i Categorical Post hoc χ2 test with Bonferroni-corrected α 0.999 j Categorical Post hoc χ2 test with Bonferroni-corrected α 0.737 k Categorical Post hoc χ2 test with Bonferroni-corrected α 0.989 l Categorical Fisher’s exact test 0.745 m Categorical Fisher’s exact test 0.476 n Categorical Fisher’s exact test 0.059
- Movie 1.
Colabeling of vasculature, neurons, and NPCs in optic tectum. Video of a spinning disk confocal Z stack (292.4 × 292.4 μm) shows pCAG::GFP-labeled NPCs and neurons (green) with respect to the dextran-labeled vasculature (magenta) in intact Xenopus tectum. Each frame is a single optical section advancing at 1-µm intervals from dorsal to ventral through the confocal stack, displayed at 7 fps. At 24 h after electroporation of pCAG::GFP, tadpoles were injected intracardially with fluorescent dextran and imaged immediately. Note GFP-labeled NPC endfeet in close apposition to a blood vessel. This video is a full-frame view of the entire tectum from which Fig. 2D,D’ is a cropped maximum projection.
- Movie 2.
Uptake of vascular-circulating molecules in the tectum. Video of a 60-μm confocal stack, progressing from dorsal to ventral tectum. Five hours after intracardial injection of fluorescent dextrans (green), tadpoles are fixed and processed for immunohistochemistry against Sox2/3 (magenta). Dextran-labeled cells in the caudolateral proliferative zone are colabeled with Sox2/3, an NPC marker. Other dextran-labeled cells, lacking Sox2/3 immunoreactivity, are primarily located near the neuropil.
In this issue


