

Article Figures & Data
Figures
- Figure 1.
Axonal targeting sequence present in the rat TH mRNA can be removed by a lentiviral vector containing CRISPR/Cas9. A, LentiCRISPR/Cas9-mediated deletion of the axonal targeting element (i.e., zip-code) of TH mRNA. Location of sgRNAs sequences targeting the flanking ends of the 50-bp region containing the axonal targeting sequence in the 3’UTR of rat TH mRNA. Diagram shows the gRNA-targeting sites. The 50-bp zip-code sequence is bolded. B, PCR analysis of genomic DNA extracted from SCG neurons infected with lentiCRISPR (control) or sgRNA 1 and sgRNA 2 lentiCRISPR (CRISPR) virus. One week after infection, genomic DNA from the cells was extracted and amplified using PCR to test for the deletion of the 50-bp region. The faster migrating band (indicated by arrow) is the shortened TH allele. GAPDH was used as a loading control. The percentage of edited DNA that resulted in an indel (% indel) was determined by quantitating the amount of uncut versus cut DNA (*).
- Figure 2.
Deletion of the axonal transport element (zip-code) of TH mRNA significantly reduces TH mRNA levels in the axon. A, RT-PCR analysis of intact and zip-code (ZC)-less TH mRNA in the axons and soma of SCG neurons one week after lentiCRISPR (control) or sgRNA 1 and sgRNA 2 lentiCRISPR (CRISPR) virus infection. Total RNA from the axons and soma of SCG neurons cultured in Campenot culture dishes was extracted, RNA was reverse transcribed into cDNA, and TH cDNA was amplified using PCR to examine the presence of intact and zip-code-less mRNA in the axons and soma of SCG neurons. GAPDH was used as a loading control. PCR amplification products were fractionated on a 4% agarose gel and visualized using an ultraviolet (UV) light. CRISPR-infected neurons produce both intact and zip-code-less TH mRNA, with zip-code-less TH mRNA detected only in the soma of SCG neurons. B, C, Quantification of TH mRNA levels in the distal axons and soma of SCG neurons infected with lentiCRISPR (control) or sgRNA 1 and sgRNA 2 containing lentiCRISPR (CRISPR). TH mRNA levels were determined by qRT-PCR one week after viral infection, using total RNA samples prepared from SCG axons and soma and gene-specific primers for TH. The relative levels of TH transcript were normalized to β-actin mRNA to provide an internal control for reverse transcription and axonal density. Data are the mean ± SEM (n = 3). *p ≤ 0.01. D, E, In situ hybridization analysis of single axons from dissociated primary SCG neurons grown in monolayer cell culture. In axons hybridized with a TH-specific riboprobe, TH mRNA appears as discrete puncta, whereas CRISPR-mediated deletion of the zip-code of TH mRNA abolishes TH puncta in the distal axons of primary SCG neurons. Arrows denote TH mRNA puncta in the axon. F, mRNA for Ppib, an endoplasmic reticulum-associated protein, is not localized to the axons. G, The number of TH mRNA containing granules is decreased in CRISPR neurons as compared with control neurons. Data are mean ± SEM from the measurement of 35–45 axons. TH mRNA containing puncta are measured as a function of axon length. The experiment was repeated three times with similar results. Student's t test, ***p ≤ 0.0001.
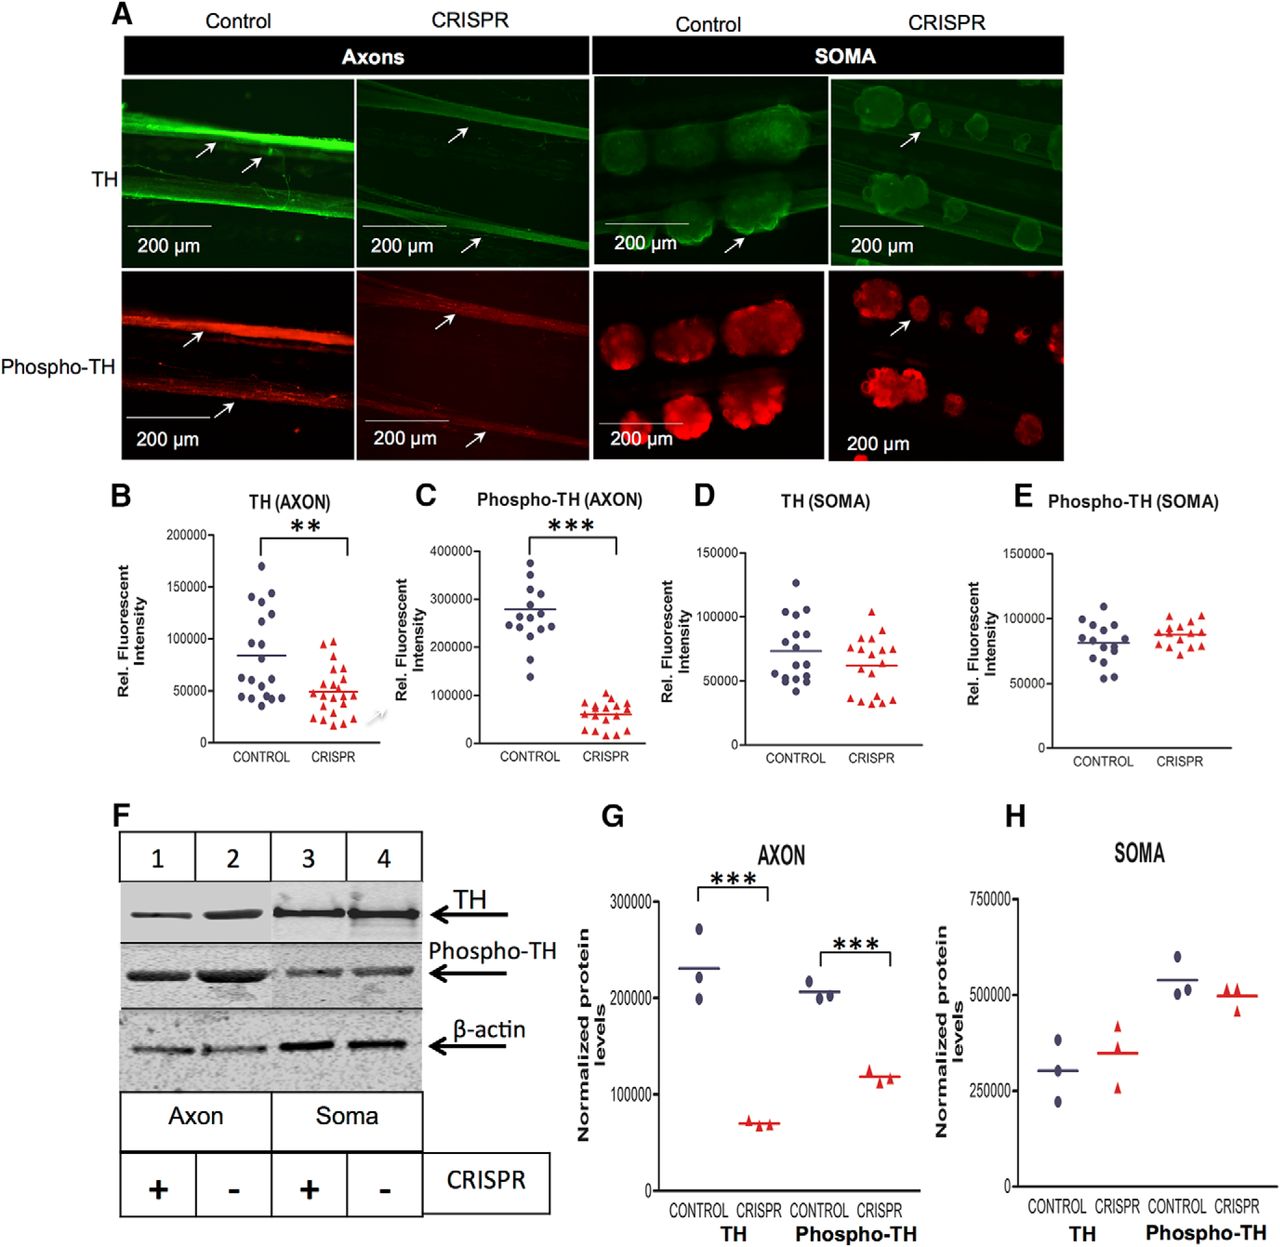
- Figure 3.
CRISPR-mediated deletion of the zip-code in the 3’UTR of TH mRNA selectively reduces axonal levels of TH protein and TH phosphorylation at SER40 (phospho-TH) in SCG neurons. A, Intraaxonal TH and phospho-TH levels were measured using immunocytochemistry in axons and soma of SCG neurons infected with lentiCRISPR (control) or sgRNA 1 and sgRNA 2 containing lentiCRISPR (CRISPR). Decreased TH and phospho-TH levels are detected in axons of CRISPR neurons grown in Campenot chambers. Arrows denote axonal TH and phospho-TH. B–E, Fluorescence intensity as a measure of TH (B, D) and phospho-TH (C, E) levels in axons and soma of SCG neurons were quantified using ImageJ, and fluorescence levels are provided as relative fluorescence intensity. Data are mean ± SEM from the measurement of 18–22 axons and 16–18 SCG ganglia from three independent experiments. Student’s t test, **p ≤ 0.002, ***p ≤ 0.0001. F, Western blot analysis of axonal and cell body protein lysates from SCG neurons infected with lentiCRISPR (control) or sgRNA 1 and sgRNA 2 containing lentiCRISPR (CRISPR). β-actin was used as a loading control. G, H, TH and phopho-TH immunoblots of axonal or soma protein lysates of SCG neurons were quantified using ImageJ. Quantification showed significant reduction of TH and phospho-TH protein levels in axons one week after viral infection of SCG neurons grown in Campenot chambers, whereas TH and phospho-TH levels in parental cell soma remained unchanged. TH and phospho-TH band intensities were normalized to the protein levels detected for β-actin. Student's t test, ***p ≤ 0.0001.
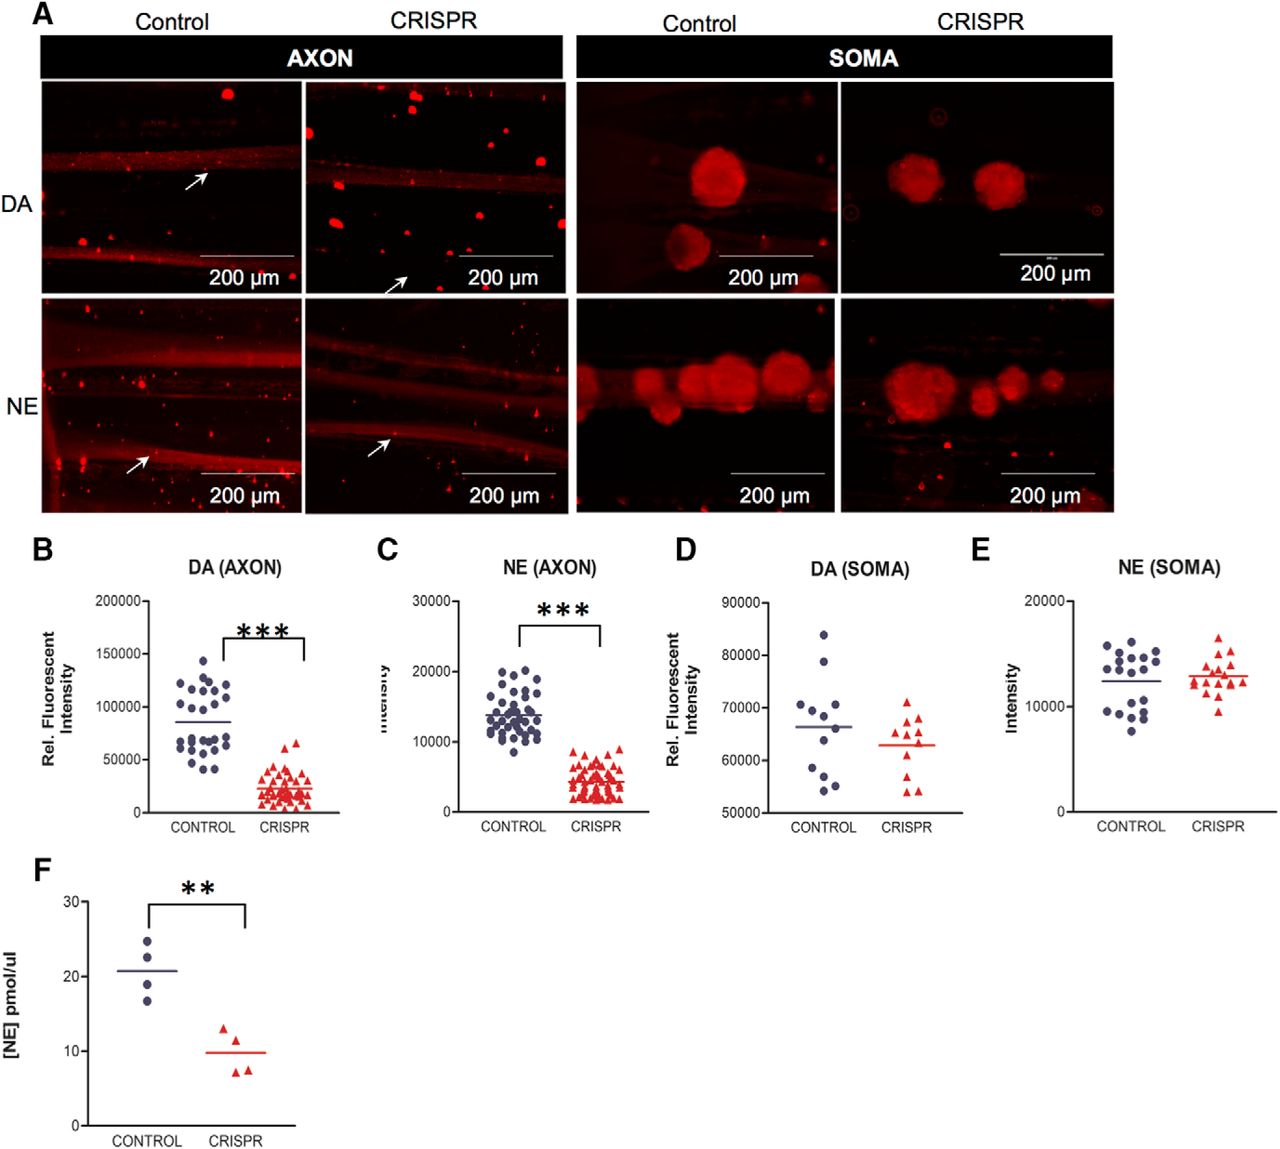
- Figure 4.
Reduced axonal transport of TH mRNA decreases axonal catecholamine levels in SCG axons. A, Intra-axonal DA and NE levels were measured using immunocytochemistry in axons and soma of SCG neurons infected with with lentiCRISPR (control) or sgRNA 1 and sgRNA 2 containing lentiCRSPR (CRISPR). Arrows denote axonal DA and NE. B–H, Fluorescence intensity as a measure of DA (B, D) and NE (C, E) levels was quantified in the soma and distal axons of SCG neurons, respectively, using ImageJ, and fluorescence levels are indicated as relative fluorescence intensity. Reduced DA and NE levels are detected in distal axons of CRISPR-treated neurons, whereas the parental soma DA and NE levels remained at control levels. Data are the mean ± SEM from the measurement of neurons cultured in six Campenot chambers from three independent experiments. F, Distal axons located in the lateral compartment of Campenot chambers were treated for 10 min with 100 mM KCl. NE release into culture media was subsequently measured using an ELISA immunoassay, and NE concentration in the culture media was calculated using linear regression analysis. Reduced NE levels are detected in distal axons of CRISPR neurons, as compared with NE levels measured in the axons of control neurons. Values are mean ± SEM of four different experiments. Student’s t test, **p ≤ 0.003.
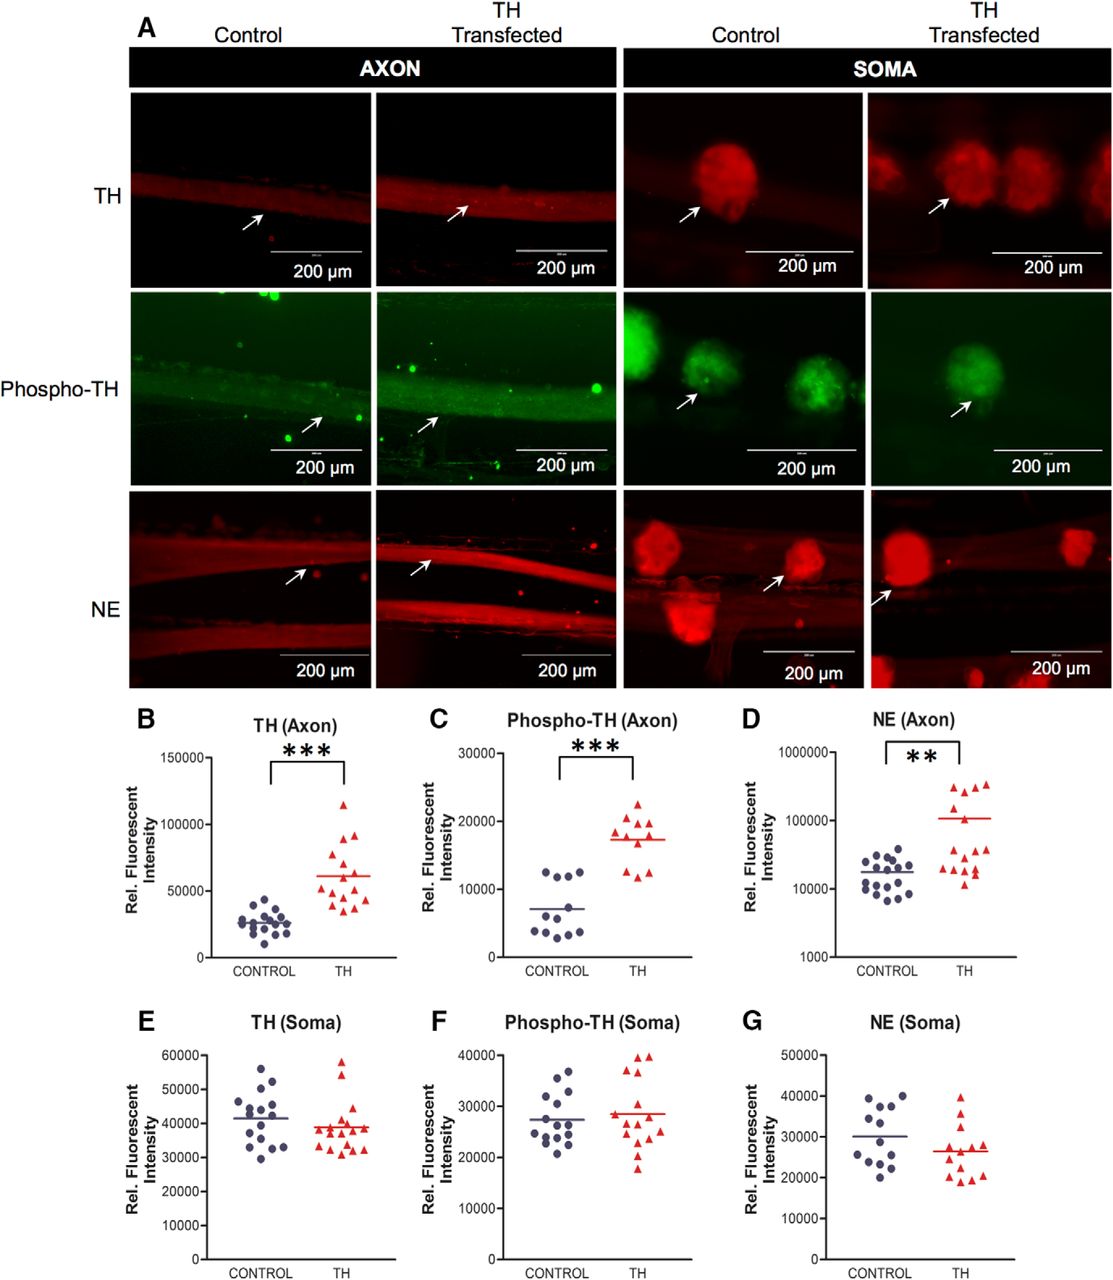
- Figure 5.
Local translation of TH mRNA enhances axonal levels of TH protein, TH phosphorylation at Ser40, and facilitates NE synthesis. A, Intra-axonal TH, phospho-TH, and NE levels were measured 2 d after transfection using immunocytochemistry in axons lipofected with TH mRNA or sham-transfected controls. Increased levels of TH, phospho-TH and NE are detected in axons locally overexpressing TH, whereas the soma levels of TH, phospho-TH and NE remained at control levels. Arrows, denote axonal TH, phospho-TH and NE. B–D, Fluorescence intensity as a measure of TH (B), phospho-TH (C), and NE (D) levels was quantified in the axons of SCG neurons using ImageJ, and fluorescence levels are provided as relative fluorescence intensity. Data are mean ± SEM from the measurement of 16–22 axons from three independent experiments. Student’s t test, **p ≤ 0.004; ***p ≤ 0.0001. E–G, Fluorescence intensity as a measure of TH (B), phospho-TH, and NE (D) levels was quantified in the soma of SCG neurons using ImageJ, and fluorescence levels are provided as relative fluorescence intensity. Data are the mean ± SEM from the measurement of 16–22 SCG ganglia from three independent experiments.
- Figure 6.
Intact and zip-code-less TH mRNAs are locally translated, enhance axonal levels of TH proteins and facilitate presynaptic NE synthesis. A, Schematic representation of the Campenot culture chambers, the sites of mRNA transfection are indicated with arrows. B, Intra-axonal and soma TH and NE levels were measured 1 d after transfection, using immunocytochemistry in soma and axons, in which axons were lipofected with intact or zip-code-less TH mRNA or sham transfected. Increased levels of TH and NE are detected in axons locally overexpressing TH, whereas the soma levels of TH, and NE remained at control levels. C, D, Fluorescence intensity as a measure of TH (C) and NE (D) was quantified in the axons and soma of SCG neurons using ImageJ. Fluorescence levels are provided as relative fluorescence intensity. Data are mean ± SEM from the measurement of 16–22 axons and 16–18 SCG ganglia from three independent experiments. One-way ANOVA, ***p ≤ 0.0001. E, Schematic representation of the Campenot culture chambers, the site of mRNA transfection in the center compartment is indicated with an arrow. F, Intra-axonal and soma TH and NE levels were measured 1 d after transfection, using immunocytochemistry in axons and cognate soma, in which soma were lipofected with intact or zip-code-less TH mRNA. Sham-transfected neurons served as negative controls. Increased levels of TH and NE are detected in soma and proximal axons locally overexpressing TH, whereas the distal axon levels of TH, and NE remained at control levels. G, H, Fluorescence intensity as a measure of TH (G) and NE (H) levels was quantified in the axons and soma of SCG neurons using ImageJ, and fluorescence levels are provided as relative fluorescence intensity. Data are the mean ± SEM from the measurement of 16–22 axons and 16–18 SCG ganglia from three independent experiments. One-way ANOVA, ***p ≤ 0.0001.


In this issue


