

Article Figures & Data
Figures
- Figure 1.
Transplanted MGE cells primarily derived into PV+ and SST+ interneurons. A, Schematic illustration of the MGE transplantation. E13.5 MGE cells carrying ChR2-eYFP were harvested from donor mice and transplanted into P2 recipient pups. Immunostaining for ChR2-eYFP, PV, and SST was performed between 28 and 70 DAT, and electrophysiological recordings were conducted in the CA1 regions of hippocampi between 30 and 70 DAT. B, Representative labeling for ChR2-eYFP and PV in a mouse transplanted with GAD2-ChR2 MGE aged at P2 + 43 DAT. ChR2-eYFP expression was showed in green and PV was showed in red. The image on the left shows the overview of hippocampus under 4× objective (scale bar, 500 μm). Expanded views for the boxed area were imaged under 40× objective (scale bar, 200 μm). Single-channel images for green and red are shown in the middle, and merged image is showed on the right. White arrows mark cells double-labeled. C, Representative labeling for ChR2-eYFP and SST from the same animal as in B. The overview of hippocampus is shown on the left (4× objective; scale bar, 500 μm). Expended views for the boxed area are shown in the middle and on the right (40× objective; scale bar, 200 μm). White arrows mark cells double-labeled. D, Quantitative analysis showing the percentage of interneuron subtypes in transplanted cells. PV+ cells comprise 28.8 ± 1.9% (n = 6) of the transplanted MGE cells, whereas SST+ cells account for 36.3 ± 1.9% (n = 6). We also quantified the ratios for nNOS-positive (9.4 ± 1.6%), reelin-positive (10.7 ± 1.8%), CR-positive (calretinin, 5.4 ± 1.5%), and VIP-positive (0.25 ± 0.25%) cells (n = 4-5 animals).
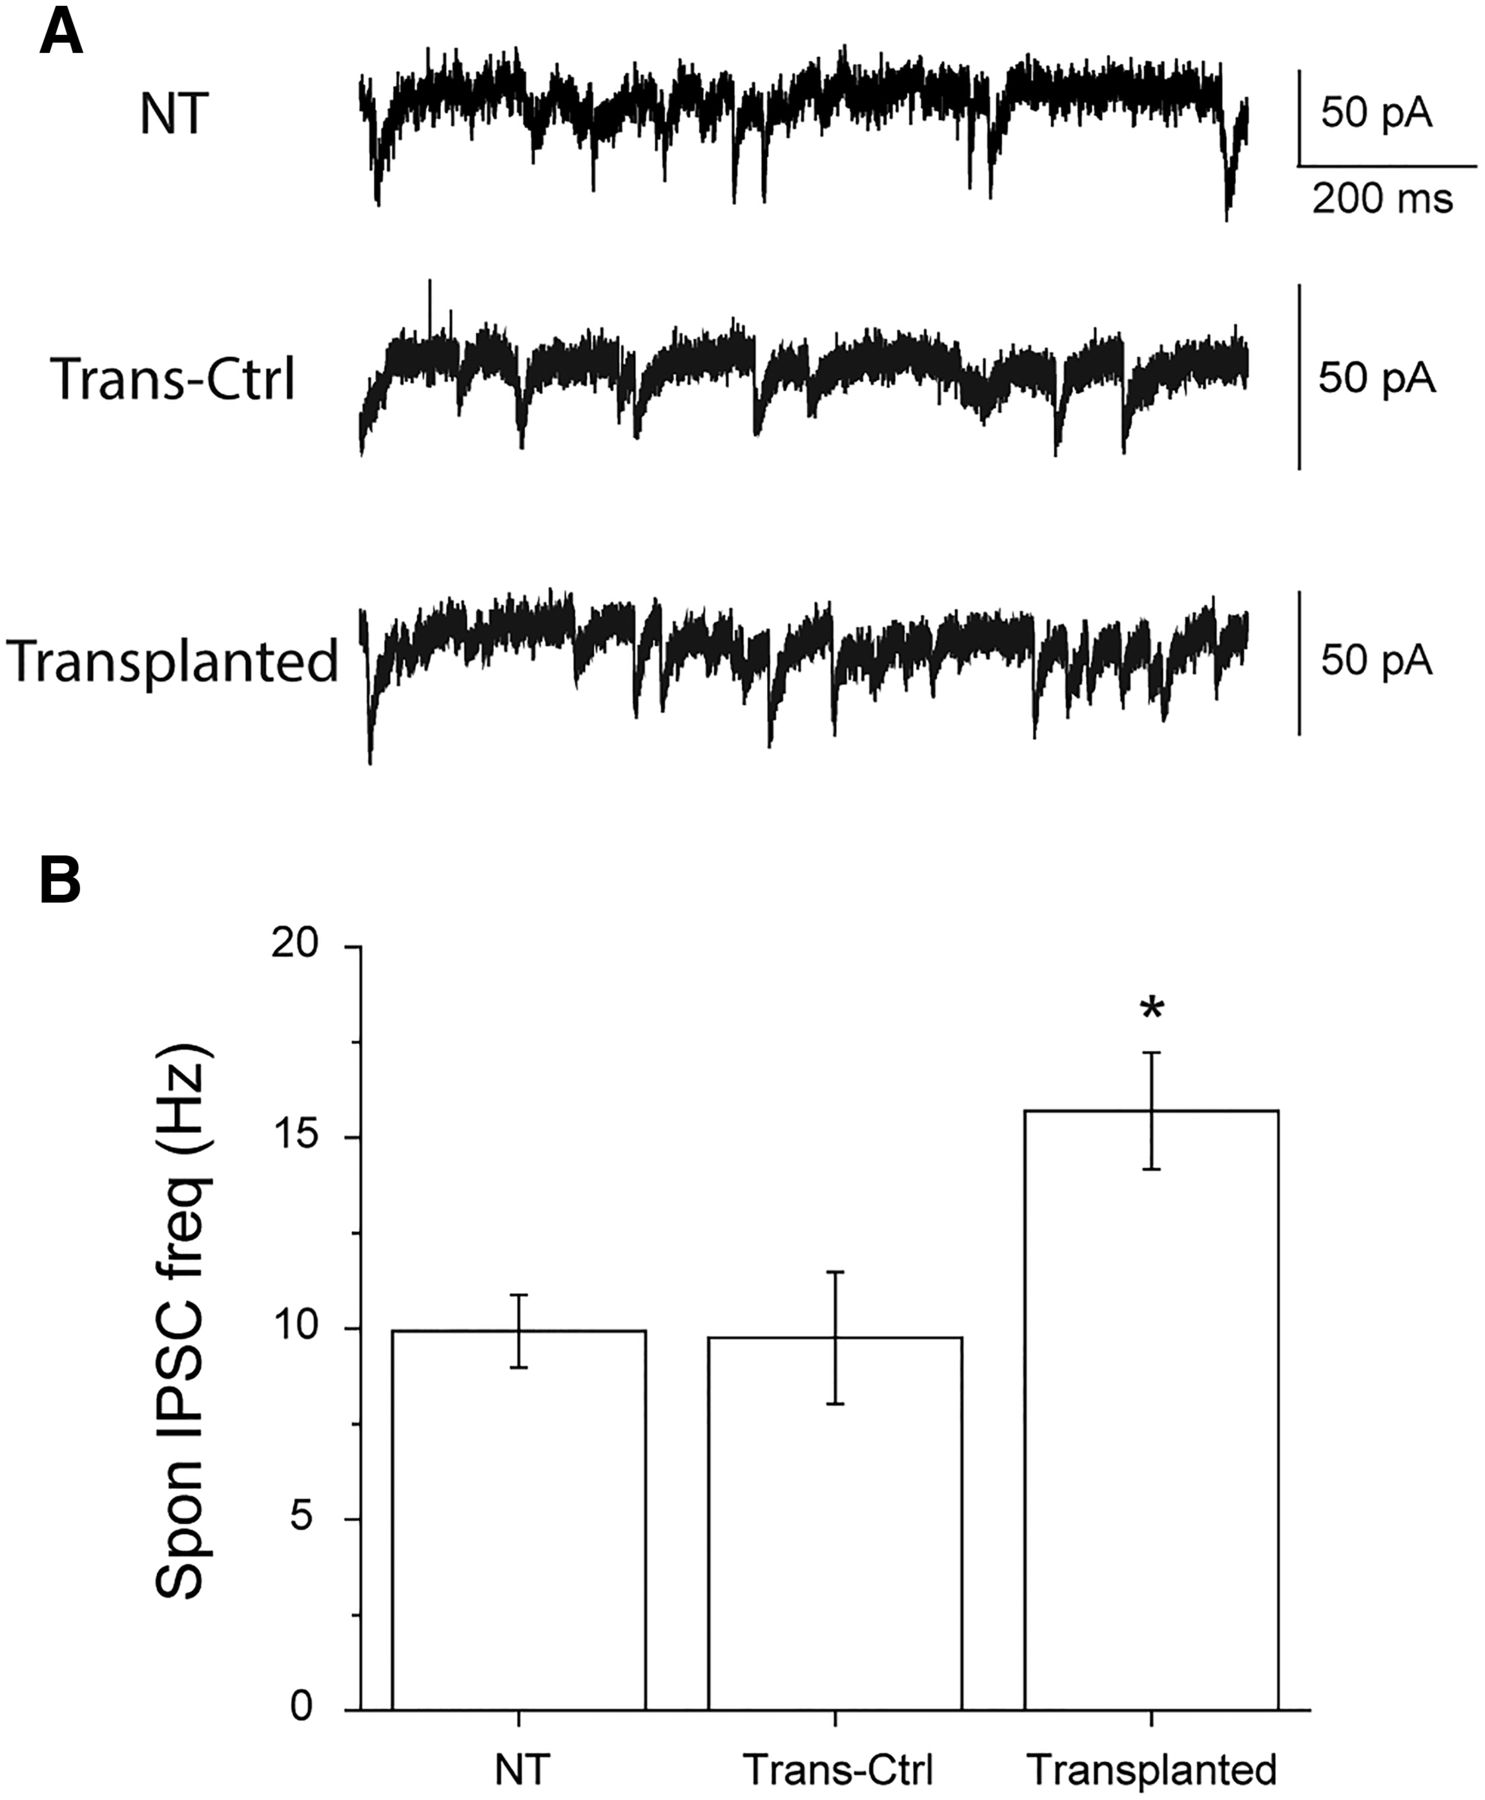
- Figure 2.
Transplanted MGE-derived interneurons increase spontaneous IPSC frequency in the hippocampus. A, Representative electrophysiological recordings showing spontaneous IPSC activities. Recordings were all done in the stratum pyramidale of CA1. The frequency of IPSC recorded from a nontransplanted mouse, NT, is 14.8 Hz (top trace), whereas that from a transplanted mouse is 22.5 Hz (bottom trace). The middle trace was recorded from a pyramidal cell in transplanted mouse that received no inputs from exogenous interneurons. The lack of connection was verified by optogentically activating all nearby ChR2-expressing interneurons. This cell serves here as an internal control and referred to as Trans-Ctrl. The spontaneous IPSC frequency of it is 12.6 Hz. B, Quantitative comparison in the spontaneous IPSC frequency. The average frequencies are 9.9 ± 0.9 Hz (n = 11), 9.8 ± 1.7 Hz (n = 12), and 15.7 ± 1.5 Hz (n = 21) for NT, Trans-Ctrl, and Transplanted, respectively. The frequency for Transplanted is significantly higher than those for the other two (one-way ANOVA, F = 5.541, p = 0.007 followed by Tukey post hoc, p = 0.029 and p = 0.019 for NT versus Transplanted and Trans-Ctrl versus Transplanted, respectively). There is no difference between NT and Trans-Ctrl (Tukey post hoc, p = 0.997).
- Figure 3.
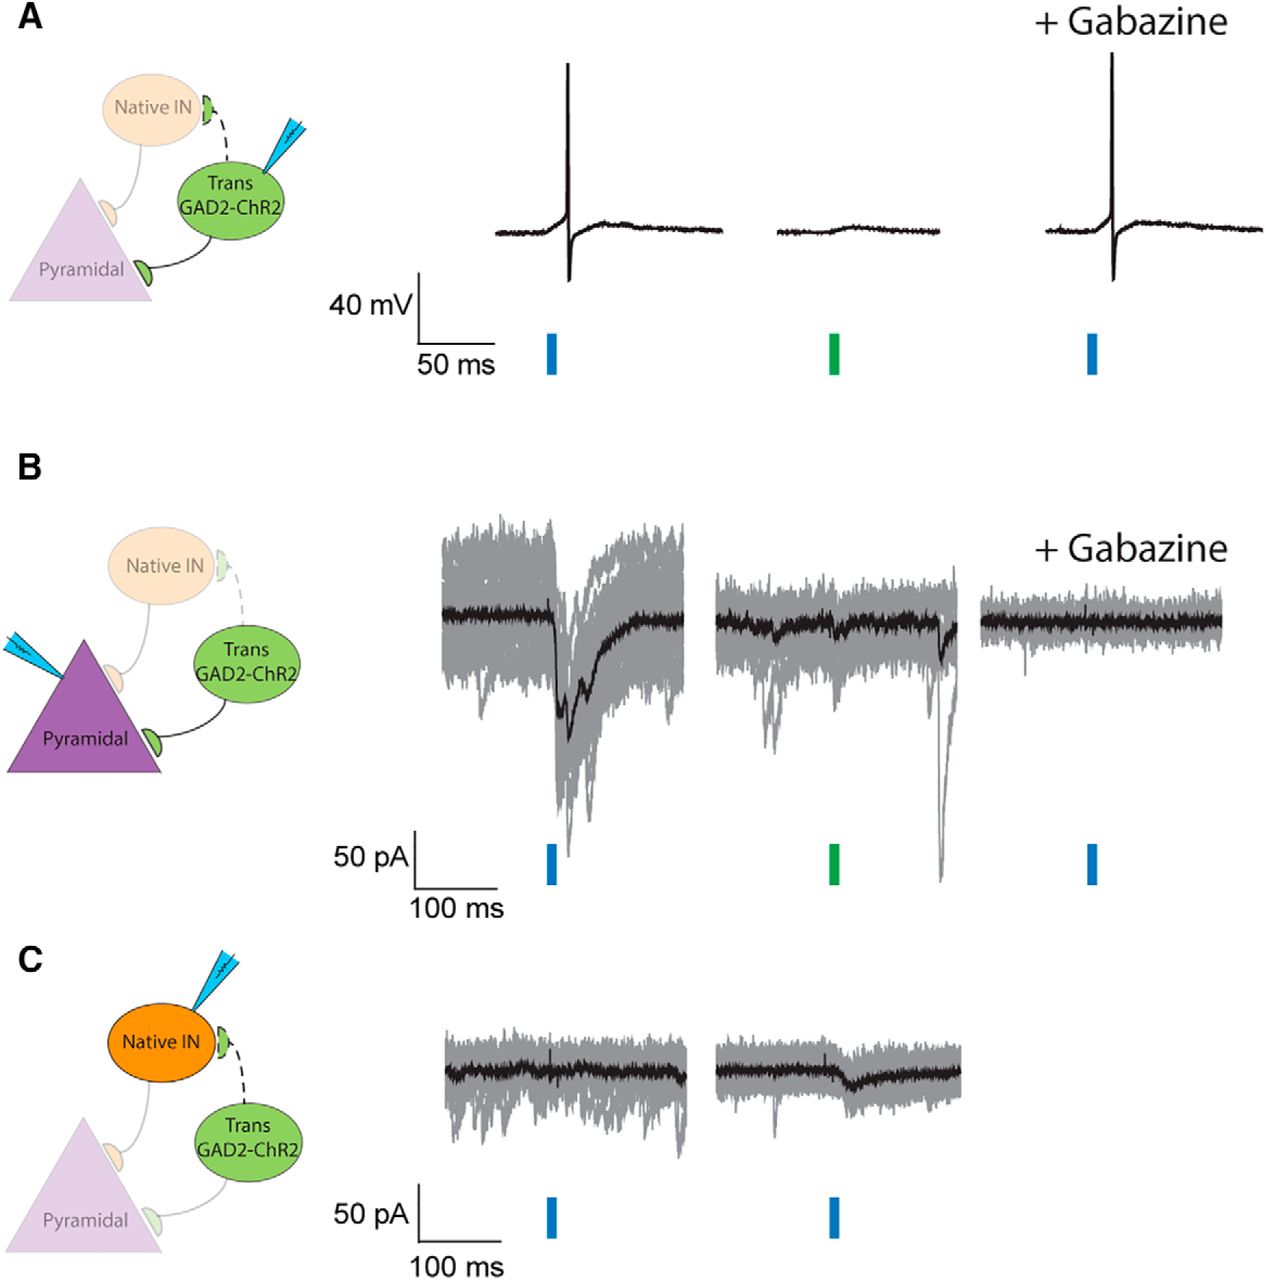
Activation of transplanted cells evokes consistent IPSC responses in native pyramidal cells but not native interneurons. A, Electrophysiological traces obtained from a transplanted ChR2-expressing cell. A brief 10-ms blue-light pulse elicited an AP (left trace) that was insensitive to the subsequent addition of 100 μM gabazine (right trace). Application of green-light pulses to the same cell failed to bring this interneuron over threshold (middle trace). Recordings from three other transplanted cells show the same result (data not shown). B, Traces recorded from a native pyramidal cell in the vicinity of transplanted interneurons. While brief blue-light pulses consistently evoked IPSC responses (left traces), green-light pulses failed to do the same (middle traces). Subsequent application of 100 μM gabazine to the same cell compromised blue-light pulses and blocked the generation of IPSCs (right traces). Traces for single trials are shown in gray and the averaged response of the cell is showed in black. We recorded a total of 11 cells and all showed consistent responses to blue light. C, Recordings obtained from native interneurons. Blue-light pulses did not generate consistent IPSCs in 15 out of 16 native interneurons. Recordings from one of these six cells are shown on the left. Only one of the 16 interneurons recorded showed small light-dependent responses (right traces). They were drastically smaller and slower compared with blue-light responses shown in pyramidal cells (see also text in the Results).
- Figure 4.
Transplanted and native PV+ interneurons generate IPSCs with comparable rising kinetics. A, Representative recordings from a native pyramidal cell in a mouse expressing ChR2-eYFP in all the PV+ interneurons. Blue-light pulses evoked fast and significant IPSC responses consistently. Traces for single trials are shown in gray and the averaged response is presented in black. The amplitude of the averaged IPSC for this cell is 1683.4 pA. Recordings from nine other cells also showed consistently light-dependent IPSCs that ranged from 204.8 to 1817.1 pA. B, Recordings from a native pyramidal cell in a Parv-ChR2 MGE transplanted mouse. Traces for single trials are shown in gray and the averaged response is presented in red. Blue-light pulses evoked consistent and fast IPSCs with averaged amplitude of 78.8 pA (left traces), whereas green-light pulses failed to do so (middle traces). Applying 100 μM gabazine to the same cell blocked all IPSC activities, either light dependent or independent (right traces). We recorded eleven other native pyramidal cells, and all of them showed the same result. The averaged IPSC amplitude ranged from 19.1 to 181.4 pA. C, Averaged IPSC responses to blue-light from A and B were rescaled and superimposed. The black trace (IPSC from a native PV+ cell, nParv) shares similar rising kinetics with the red trace (IPSC from a transplanted PV+ cell, tParv). D, The averaged rising τ for nParv and tParv are 1.64 ± 0.29 ms (n = 10) and 1.51 ± 0.16 ms (n = 12), respectively, and they are not significantly different (two-sample t test, p = 0.678).
- Figure 5.
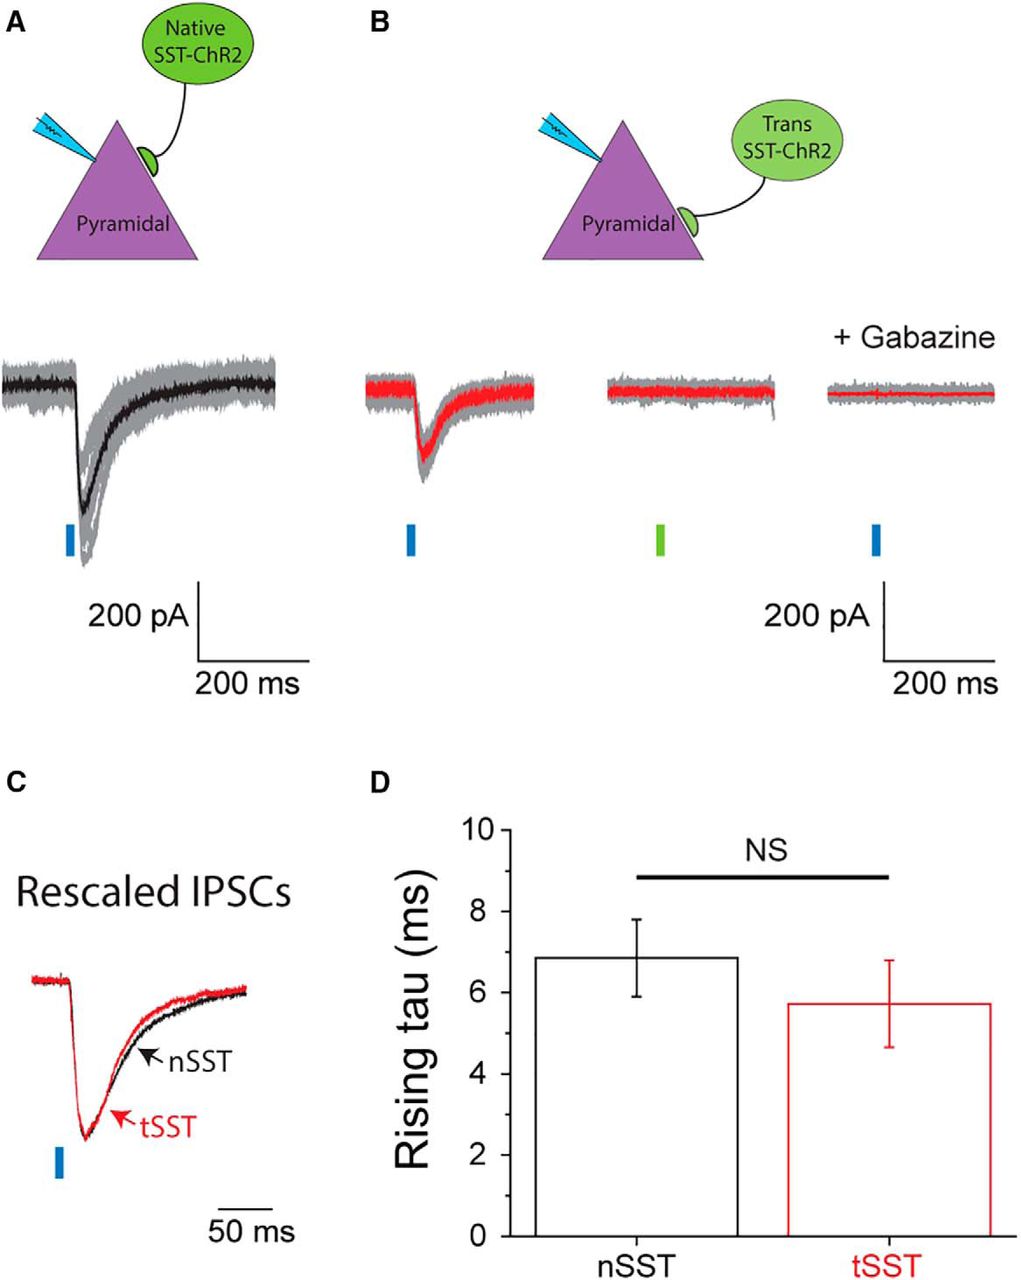
Transplanted and native SST+ interneurons generate IPSCs with comparable rising kinetics. A, Representative recordings from a native pyramidal cell in a mouse expressing ChR2-eYFP in all the SST+ interneurons. Blue-light pulses evoked consistent IPSCs. Traces for single trials are in gray and the averaged response is in black, for which the amplitude is 1683.4 pA. Recordings from nine other cells also showed consistent light-dependent IPSCs (52.5-464.2 pA). B, Recordings from a native pyramidal cell in a mouse transplanted with SST-ChR2 MGEs. Traces for single trials are shown in gray and the averaged response in red. Blue-light pulses evoked consistent IPSCs averaged at 78.8 pA (left traces), whereas green-light pulses failed to elicit any notable responses (middle traces). Applying 100 μM gabazine to the same cell blocked all IPSC activities (right traces). Seven other native pyramidal cells show the same responses to light and to gabazine. The averaged IPSC amplitude recorded from them ranged from 51.7 to 187.3 pA. C, Averaged IPSC responses to blue-light from A and B were rescaled and superimposed. The black trace (IPSC responded to a native SST+ cells, nSST) the red trace (IPSC responded to a transplanted SST+ cell, tSST) show comparable rising kinetics. D, The averaged rising τ for nSst is 6.80 ± 0.90 ms (n = 10) and that for tSST is 5.71 ± 1.10 ms (n = 8). They are not significantly different (two-sample t test, p = 0.414).
- Figure 6.
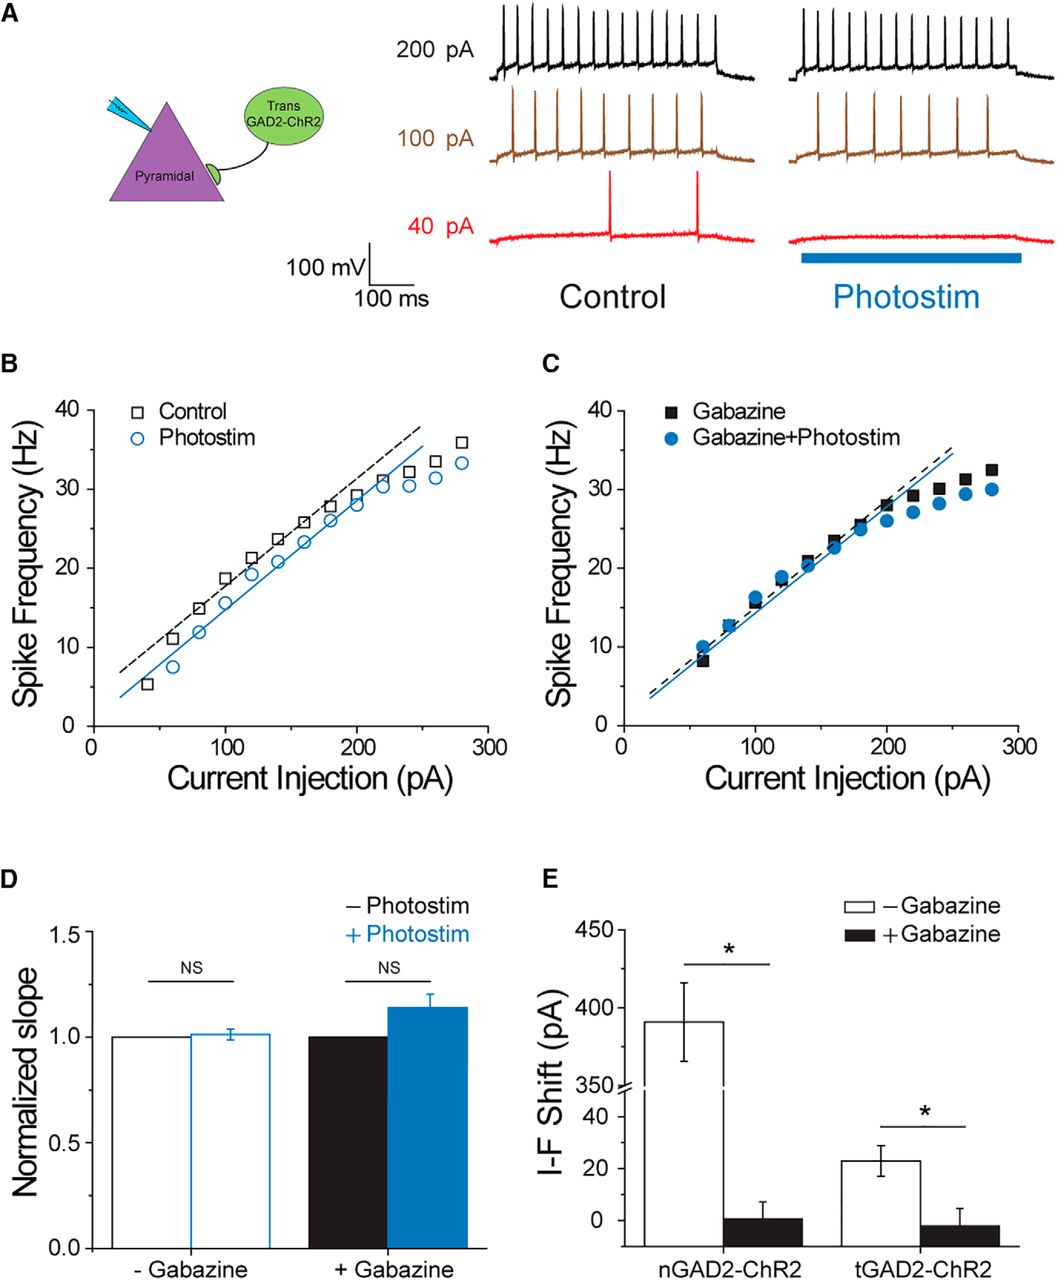
Activation of transplanted interneurons introduce inhibitory gain control to native pyramidal cells. A, Representative traces recorded from a native pyramidal cell at various levels of current injection in the absence and presence of photostimulation. In the absence of photostimulation, 40-pA current injection (red trace) brought the cell over threshold and generated two APs, giving a frequency of 5 Hz; 100-pA (brown trace) and 200-pA (black trace) current injection induced higher spiking frequency at 18.7 and 29.2 Hz, respectively. With simultaneous blue-light photostimulation, 40 pA was no longer sufficient to evoke AP, and the spike frequencies induced by 100 and 200 pA were reduced to 15.6 and 28 Hz, respectively. B, C, I-F curves of the cell showed in A under various conditions. Curves were fit linearly with a data range picked manually. The slope factor of the fit line for control condition is 0.136 (open squares, r 2 = 0.955), whereas the slope factor with photostimulation is 0.138 (open circles, r 2 = 0.990). After the addition of 100 μM gabazine, the slope factor is 0.136 (closed squares, r 2 = 0.988), and that with photostimulation is 0.135 (closed circles, r 2 = 0.970). By comparing the fit lines, we found that photostimulation right shifts the curve by 23.7 pA, which can be reversed by the addition of gabazine. The shift in the presence of gabazine is 3.6 pA. D, The slope factors from fit results were normalized, averaged, and compared. In the absence of gabazine, the normalized slope factor with photostimulation is 1.013 ± 0.026, which is not different from the control group (paired t test, n = 9, p = 0.630). In the presence of 100 μM gabazine, the normalized slope factor with photostimulation is 1.125 ± 0.066 and is not significantly different from that without photostimulation (paired t test, n = 5, p = 0.334). E, Parallel shifts in I-F curves were compared with and without gabazine. On average, activation of transplanted interneurons, tGAD2, right shifts the I-F curve by 21.1 ± 5.5 pA, which can be rectified by 100 μM gabazine to -2.2 ± 6.8 pA (two-sample t test, n = 9 and 5, p = 0.023). The minor shift in the presence of gabazine is not different from 0 (one-sample t test, p = 0.661). Similarly, activation of native interneurons, nGAD2, shifts the I-F curves to the right (342.8 ± 30.3 pA, n = 5), and subsequent addition of 100 μM gabazine completely eliminated the effect (-5.4 ± 7.5 pA after gabazine, n = 4; two-sample t test, p = 0.00002). The shift recorded in the presence of gabazine is not different from 0 (one-sample t test, p = 0.460).
- Figure 7.
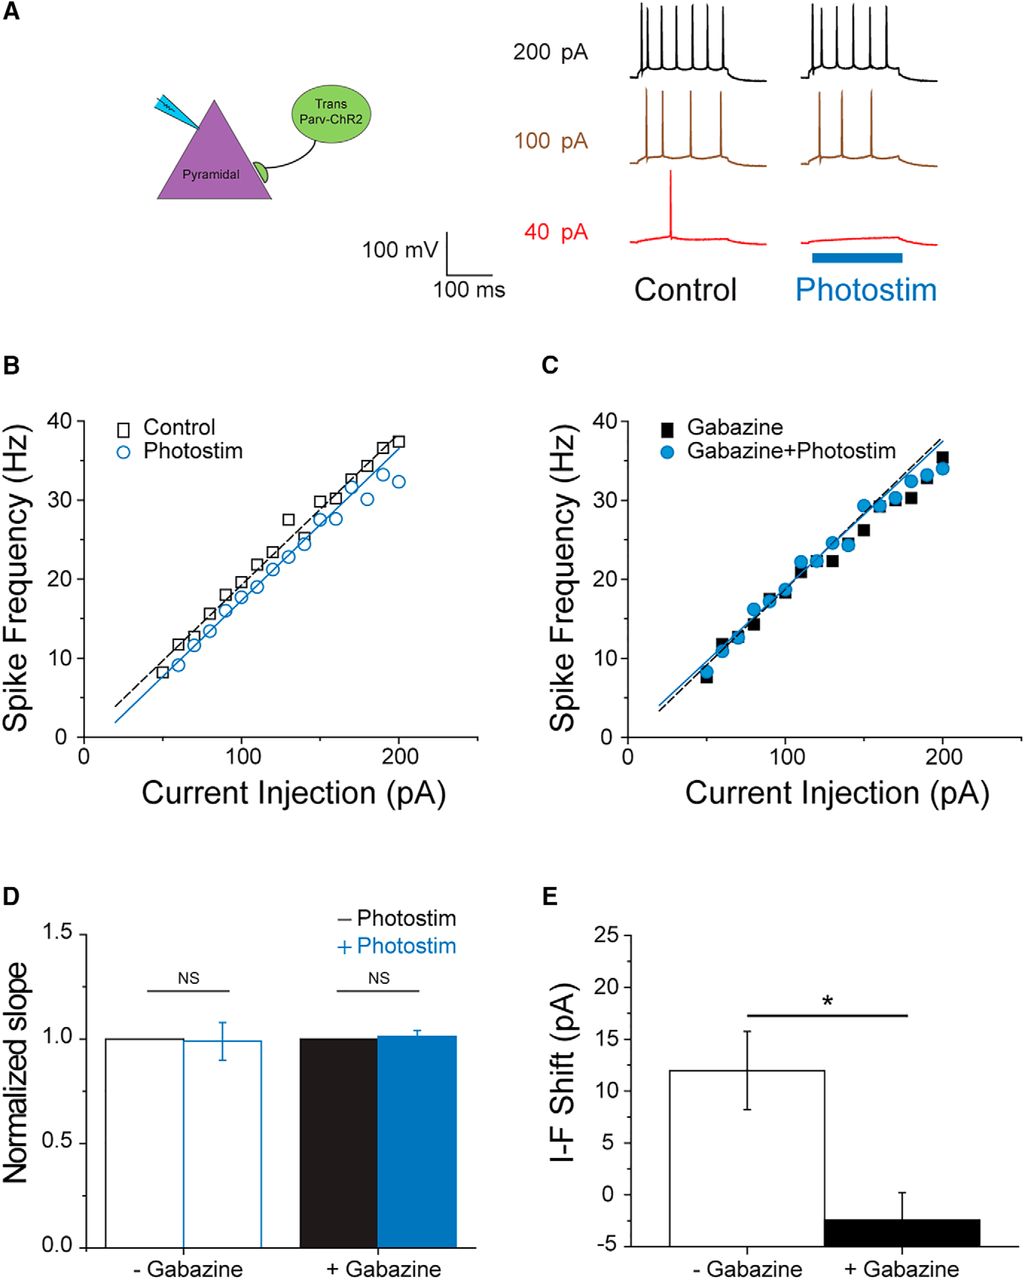
Transplanted PV+ interneurons contribute to the inhibitory gain control on native pyramidal cells. A, Representative traces recorded from a native pyramidal cell at various levels of current injection with and without simultaneous activation of nearby transplanted PV+ cells. In the absence of photostimulation, 40-pA current injection elicited single AP over a 200-ms period (red trace). When current injection was increased to 100 and 200-pA, the multiple spikes were elicited, and the frequencies were 19.6 Hz (brown trace) and 37.4 Hz (black trace), respectively. In the presence of photostimulation, 40-pA current injection failed to bring the cell over threshold. On 100- and 200-pA current injection, the spike frequencies were 17.7 and 35.4, respectively. B, C, The I-F curves under various conditions obtained from the same cells shown in A. Linear regression was employed to fit the data. The slope factor for the control condition is 0.118 (open squares, r 2 = 0.978), and that with photostimulation is 0.110 (open circles, r 2 = 0.982). After the application of 100 μM gabazine, the slope factors are 0.127 (closed squares, r 2 = 0.972) and 0.127 (closed circles, r 2 = 0.992) for conditions with and without photostimulation, respectively. In the absence of gabazine, photostimulation shifts the I-F curve to the right by 10.6 pA, whereas it only shifts the curve by 4.4 after the addition of gabazine. D, In the absence of gabazine, the normalized slope factor with photostimulation is 0.989 ± 0.090 and is not significantly different from that under control condition (paired t test, n = 8, p = 0.907). In the presence of 100 μM gabazine, the normalized slope factor with photostimulation is 1.013 ± 0.029 compared with that without photostimulation. There is no statistical significance between these two conditions (paired t test, n = 6, p = 0.399). E, On average, activating transplanted Parv+ cells shift the I-F curve of pyramidal cells by 12 ± 3.8 pA (n = 8). This effect can be significantly reduced by 100 μM gabazine (-2.4 ± 2.6 pA, n = 6; two sample t test, p = 0.013). The shift observed in the presence of gabazine is not different from zero (one-sample t test, n = 6, p = 0.252).
- Figure 8.
Transplanted SST+ interneurons also contribute to the introduced inhibition on native pyramidal cells. A, Representative traces recorded from a native pyramidal cell at various levels of current injection. Without photostimulating transplanted SST+ cells, 40 pA of current injection elicited a single AP over 200 ms (red trace). The spike frequencies under 100-pA (brown trace) and 200-pA current injection (black trace) are 9 and 16 Hz, respectively. With simultaneous photostimulation, 40 pA was no longer sufficient to elicit APs, and the frequencies evoked by 100 and 200 pA were reduced to 8.2 and 15.6 Hz. B, C, The I-F curves under various conditions obtained from the same cells shown in A. Data were fit with linear regression to obtain slope factors and intercepts along the x-axis (current axis). The slope factor for the control condition is 0.077 (open squares, r 2 = 0.969), and that with photostimulation is 0.078 (open circles, r 2 = 0.946). After 100 μM gabazine, the slope factors are 0.065 (closed circles, r 2 = 0.967) and 0.069 (closed squares, r 2 = 0.975) for conditions with and without photostimulation, respectively. In the absence of gabazine, photostimulation right shifts the I-F curve by 9.1 pA in this cell, whereas it only shifts the curve by 4.4 after the addition of 100 μM gabazine. D, In the absence of gabazine, the normalized slope factor with photosimulation is 1.036 ± 0.015 and is not significantly different from that under control condition (paired t test, n = 6, p = 0.079). In the presence of 100 μM gabazine, the normalized slope factor with photostimulation is slightly lower (0.806 ± 0.103, n = 5) than that without photostimulation. However, this decrease is not statistically significant (paired t test, n = 5, p = 0.073). E, Photostimulating transplanted SST+ interneurons shifts the I-F curve of pyramidal cells by 13.3 ± 5.2 pA (n = 6), which can be compromised by 100 μM gabazine (-1.7 ± 2.6 pA, n = 5; two sample t test, p = 0.037). The shift observed by photostimulation in gabazine is not different from zero (one-sample t test, n = 5, p = 0.513).


In this issue


