

Article Figures & Data
Figures
- Figure 1.
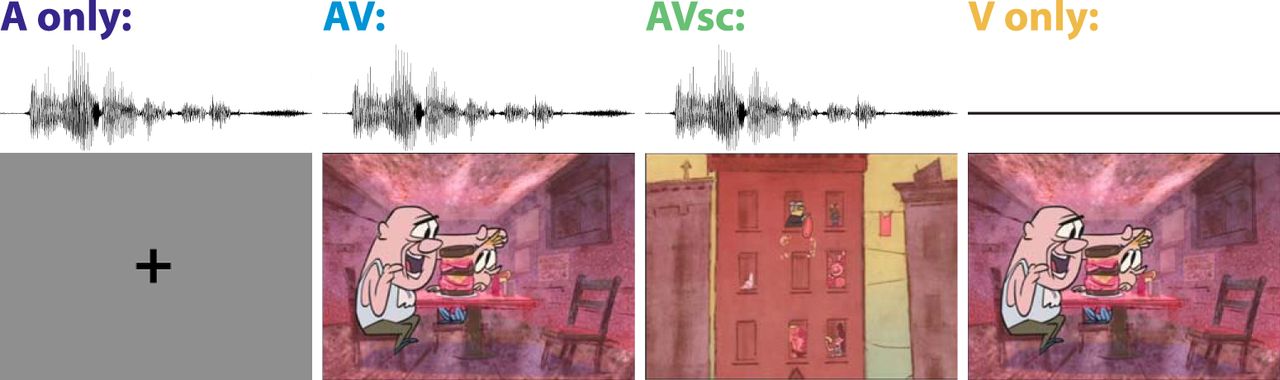
Illustration of the behavioral task. Subjects were exposed to one of five conditions: A Only, AV, AVsc, V Only, or No Stim (not shown). The sound clip represented by the waveform is “…and he would buy me a hotdog the size of my head…” Three weeks after stimulus presentation, and without prior warning, subjects were asked to complete an on-line questionnaire with 72 four-alternative forced-choice questions. The question asked about this segment of the stimulus was “What would Rocco do with the narrator when they went for walks?” Answer options were as follows: “a. Buy him a hot dog; b. Buy him a milkshake; c. Buy him candy; d. Tell him stories.” Still images from “Sundays at Rocco’s,” a StoryCorps animated short produced by Lizzie Jacobs and Mike Rauch, reproduced here with permission from StoryCorps.
- Figure 2.
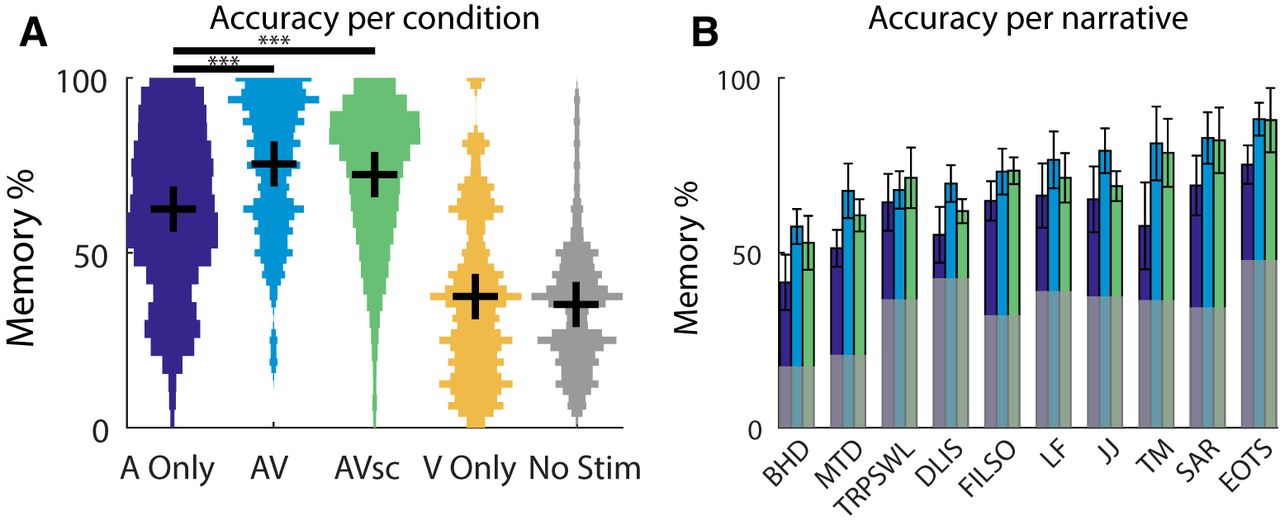
A, B, Memory performance for different stimulus modalities (A) and different narratives (B). A, Note that exposure to the visual stimuli (V Only, yellow) yields performance no better than chance performance (No Stim, gray). In addition to mean and SE (represented by the black horizontal and vertical lines, respectively), we also present the histogram of the distribution of accuracy values. B, For each narrative (for titles see Materials and Methods), performance is shown for A Only (purple), AV (blue), AVsc (green), and chance (No Stim, gray). Error bars represent the SEM across questions (N = 72 in A; N = 5–9 in B). *p < 0.05, **p < 0.01, ***p < 0.001.
- Figure 3.
ISC A Only (purple), AV (blue), AVsc (green), and visual (V Only, yellow) stimuli. The full distribution of the ISC values are indicated by the width of the histogram bars for each condition, and gray indicates the distribution of the chance level of correlation for each modality. ISC is calculated using the sum of the three largest correlated components elicited by the presentation of the narrative (Eq. 1). Error bars (vertical lines) represent the SEM across subjects. *p < 0.05, **p < 0.01, ***p < 0.001. B, C, The multisensory boost in memory and ISC occurs for all 10 narratives. The different presentation conditions for each narrative, corresponding to separate groups of subjects, are connected with a line, and SEs across subjects are represented as horizontal and vertical bars for ISC and Memory %, respectively.
- Figure 4.
Relationship between neural ISC and memory performance. A, Memory accuracy for auditory information increases with ISC in all conditions in which the auditory narrations were heard (A Only, AV, and AVsc), but not when it was missing (V Only). Each point indicates an individual subject’s ISC (Eq. 2) and memory. B, Same as A, but here, to control for the modality effect, mean values across subjects were subtracted from ISC and memory performance for each subject in that stimulus condition. Only conditions with performance significantly above chance are used.
- Figure 5.
The forward model for the three most correlated components of neural activity. Each column represents the forward model (correlation between surface electrodes and component activity) obtained using either all stimuli together (combining responses across all subjects, left) or different stimulus presentations (A Only, middle-left; AV, middle-right; V Only, right). Each row represents a different component in descending order from most correlated (top) to least correlated (bottom; C1–C3). Color indicates the correlation between each scalp electrode and the component.


In this issue


