

Article Figures & Data
Figures
- Figure 1.
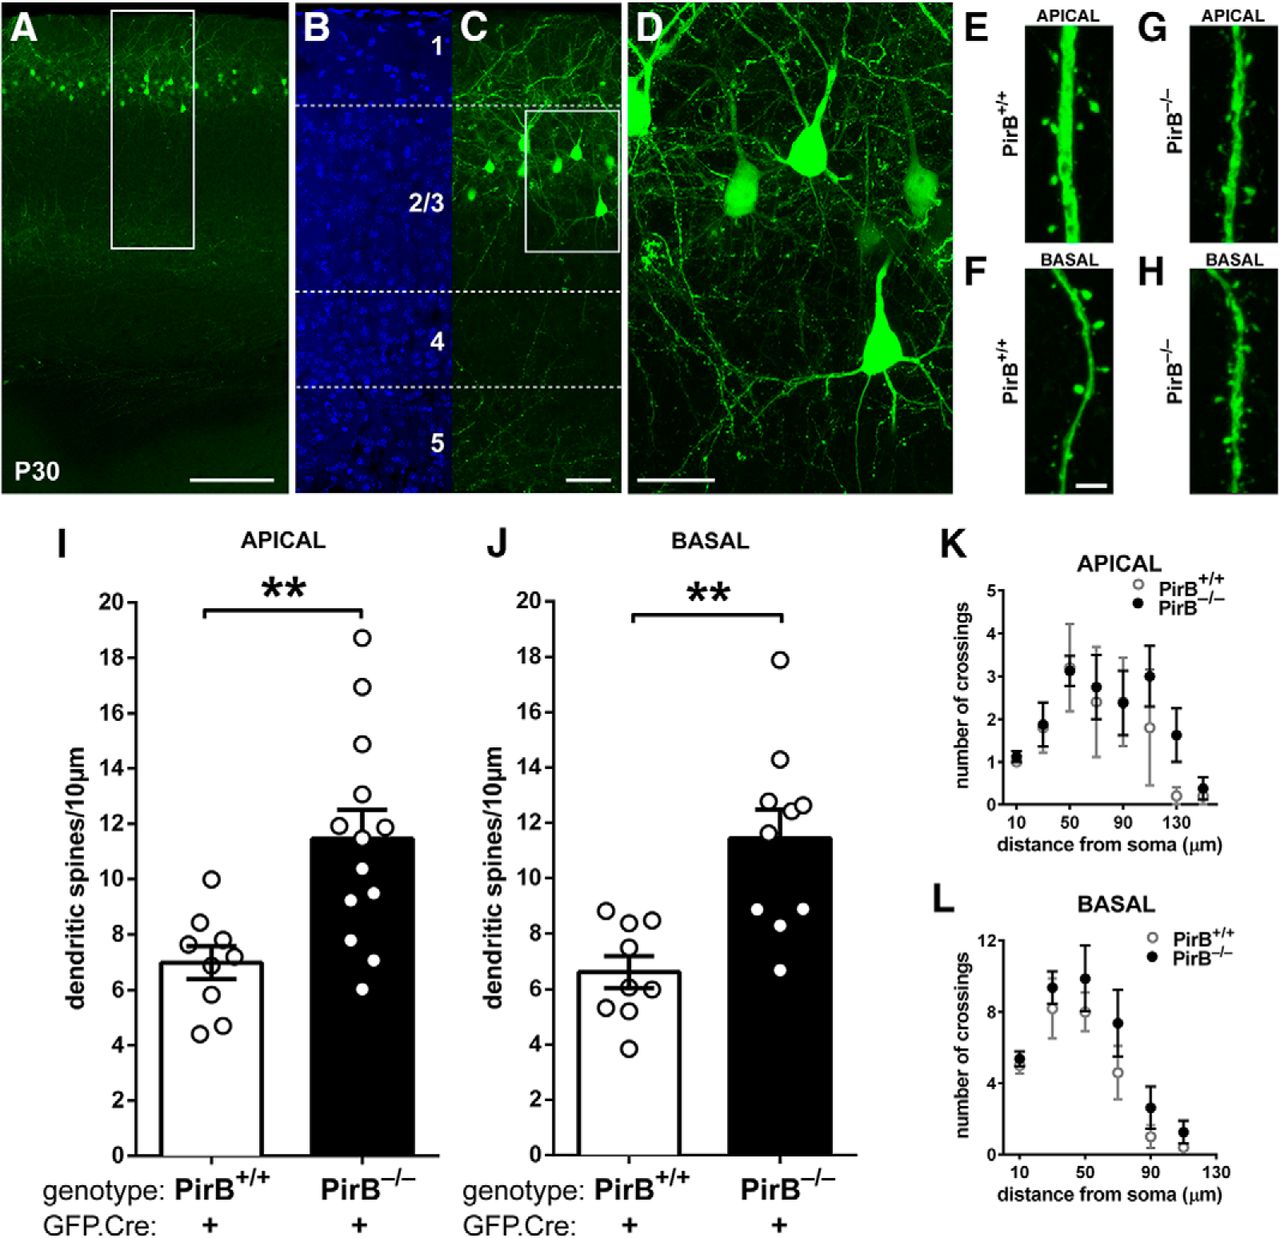
Density of dendritic spines on L2/3 pyramidal neurons is greater in visual cortex of germline PirB−/− mice than in PirB+/+ mice at P30. A, A low-magnification fluorescence micrograph of P30 mouse visual cortex showing GFP expression (green) in cells in L2/3 after GFP.Cre electroporation at E15.5. B, C, Higher-magnification views of boxed region shown in A; DAPI nuclear counterstain (B) shows that most of the GFP+ neurons (C) are in layer 2 and upper layer 3. Soluble GFP fills the cells: cell bodies and dendrites, as well as descending axons clustering within layer 5 are all clearly visible. D, High-magnification maximum intensity projection of boxed region shown in C. Dendritic spines and axonal boutons are visible. E–H, High-magnification fluorescent micrographs showing apical (E, G) and basal (F, H) dendritic spines in PirB+/+ and PirB−/− mice. I, Apical dendritic spine density on L2/3 pyramidal neurons of PirB−/− visual cortex is elevated compared with PirB+/+ (PirB+/+ GFP+;Cre+: 7.0 ± 0.6 dendritic spines/10 μm of dendrite length, n = 9 cells, 5 mice; PirB−/−: GFP+;Cre+: 11.5 ± 1.0, n = 13 cells, 5 mice; p = 0.004a, one-way ANOVA with post hoc Bonferroni’s multiple comparisons). J, Basal dendritic spine density is also increased in PirB−/− mice compared with PirB+/+ mice (PirB+/+ GFP+;Cre+: 6.6 ± 0.6 dendritic spines/10 μm of dendrite length, n = 9 cells, 5 mice; PirB−/− GFP+;Cre+: 11.4 ± 1.1, n = 10 cells, 5 mice; p = 0.002b, one-way ANOVA with post hoc Bonferroni’s multiple comparisons). K, L, Sholl analysis reveals no significant changes in apical (K) or basal (L) dendritic branching between PirB+/+ and PirB−/− L2/3 neurons (PirB+/+ GFP+;Cre+: n = 5 cells, 3 mice; PirB−/− GFP+;Cre+: n = 8 cells, 5 mice; p = 0.2443c (K), p = 0.0574d (L), two-way ANOVA with repeated measures). **p < 0.01. Scale bars: A, 0.2 mm; B, C, 50 μm; D, 25 μm; E–H, 3 μm.
- Figure 2.
Dendritic spine density at P30 is elevated on isolated PirB−/− neurons in layer 2/3 after sparse excision of PirB at E15.5. A, B, Fluorescent micrographs at P30 of nuclear counterstain (DAPI; A) and an isolated L2/3 pyramidal neuron electroporated with GFP.Cre (B) from a visual cortex section from a P30 PirBfl/fl mouse. C, High-magnification maximum intensity projection of the boxed area in B. D, E, Zoomed-in high-magnification micrographs of portions of apical (D) and basal (E) dendrites showing dendritic spines in PirBfl/fl mice. F, Number of neighboring GFP+;Cre+ cells as a function of distance from a neuron of interest in PirBfl/fl tissue (n = 8 cells, 7 mice). The graph shows that, on average, there was only one GFP+;Cre+ cell in every 50 μm increment analyzed. G, Spine density on apical dendrites is greater in GFP+;Cre+ neurons from PirBfl/fl mice than PirB+/+ mice (PirB+/+: 7.0 ± 0.6 dendritic spines/10 μm of dendritic length, n = 9 cells, 5 mice; same data as in Fig. 1I; PirBfl/fl, GFP+;Cre+: 10.6 ± 0.8, n = 9 cells, 7 mice; PirB−/−, GFP+;Cre+: 11.5 ± 1.0, n = 13 cells, 5 mice; same data as in Fig. 1I; PirB+/+ vs PirBfl/fl, p = 0.041a; PirBfl/fl vs PirB−/−, p = 1.000a, one-way ANOVA with post hoc Bonferroni’s multiple comparisons). H, Basal dendritic spine density is greater in GFP+; Cre+ neurons from PirBfl/fl mice than PirB+/+ mice (PirB+/+: 6.6 ± 0.6 dendritic spines/10 μm of dendritic length, n = 9 cells, 5 mice; data from Fig. 1J; PirBfl/fl, GFP+;Cre+: 10.6 ± 1.0, n = 8 cells, 7 mice; PirB−/−, GFP+;Cre+: 11.4 ± 1.1, n = 10 cells, 5 mice; data from Fig. 1J; PirB+/+ vs PirBfl/fl p = 0.02b, PirBfl/fl vs PirB−/− p = 1.000b, One-way ANOVA with post hoc Bonferroni's multiple comparisons). I, Cumulative histogram (by cell) of data presented in G. J, Cumulative histogram (by cell) of data presented in H. K, L, Sholl analysis reveals no significant changes in apical (K) or basal (L) dendritic branching between GFP+;Cre+ L2/3 neurons from PirB+/+ and PirBfl/fl mice (K: PirB+/+, n = 5 cells, 3 mice; data from Fig. 1K; PirBfl/fl, n = 5 cells, 3 mice, p = 0.8864e; L: PirB+/+, n = 5 cells, 3 mice; data from Fig. 1L; PirBfl/fl, n = 4 cells, 3 mice, p = 0.7799f, two-way ANOVA with repeated measures). *p < 0.05; **p < 0.01. Scale bars: A, B, 100 μm; C, 25 μm; D, E, 3 μm.
- Figure 3.
At P23, dendritic spine density on L2/3 pyramidal cells in PirB−/− visual cortex is similar to that of PirB+/+. A, Fluorescent micrograph at P23, an age near the onset of spine pruning, showing an isolated L2/3 pyramidal neuron electroporated with GFP.Cre at E15.5. B, High-magnification, maximum-intensity projection of boxed area in A showing spines on basal dendrites of GFP+;Cre+ L2/3 neuron. C, Basal dendrite spine density is higher in PirB+/+ neurons at P23 than in PirB+/+ neurons at P30 (P30 data indicated by dotted line; data from Fig. 2H); spine density from P23 PirB+/+ is not different from PirBfl/fl or PirB−/− neurons (P23 PirB+/+: 12.66 ± 1.5, n = 6 cells, 3 mice; P23 PirBfl/fl: 14.43 ± 0.9, n = 7 cells, 5 mice; P23 PirB−/−: 13.39 ± 1.1, n = 8 cells, 4 mice; P23 PirB+/+vs P23 PirB−/−, p = 1.000g; P23 PirB+/+ vs P23 PirBfl/fl, p = 0.924g; P23 PirBfl/fl vs PirB−/−, p = 1.000g, one-way ANOVA with post hoc Bonferroni’s multiple comparisons; P23 PirB+/+ vs P30 PirB+/+, p = 0.004g; P23 PirBfl/fl vs P30 PirBfl/fl, p = 0.19g; P23 PirB−/− vs P30 PirB−/−, p = 1.00g, one-way ANOVA with post hoc Bonferroni’s multiple comparisons). D, Cumulative histogram (by cell) of data presented in C. Scale bars: A, 50 μm; B, 5 μm.
- Figure 4.
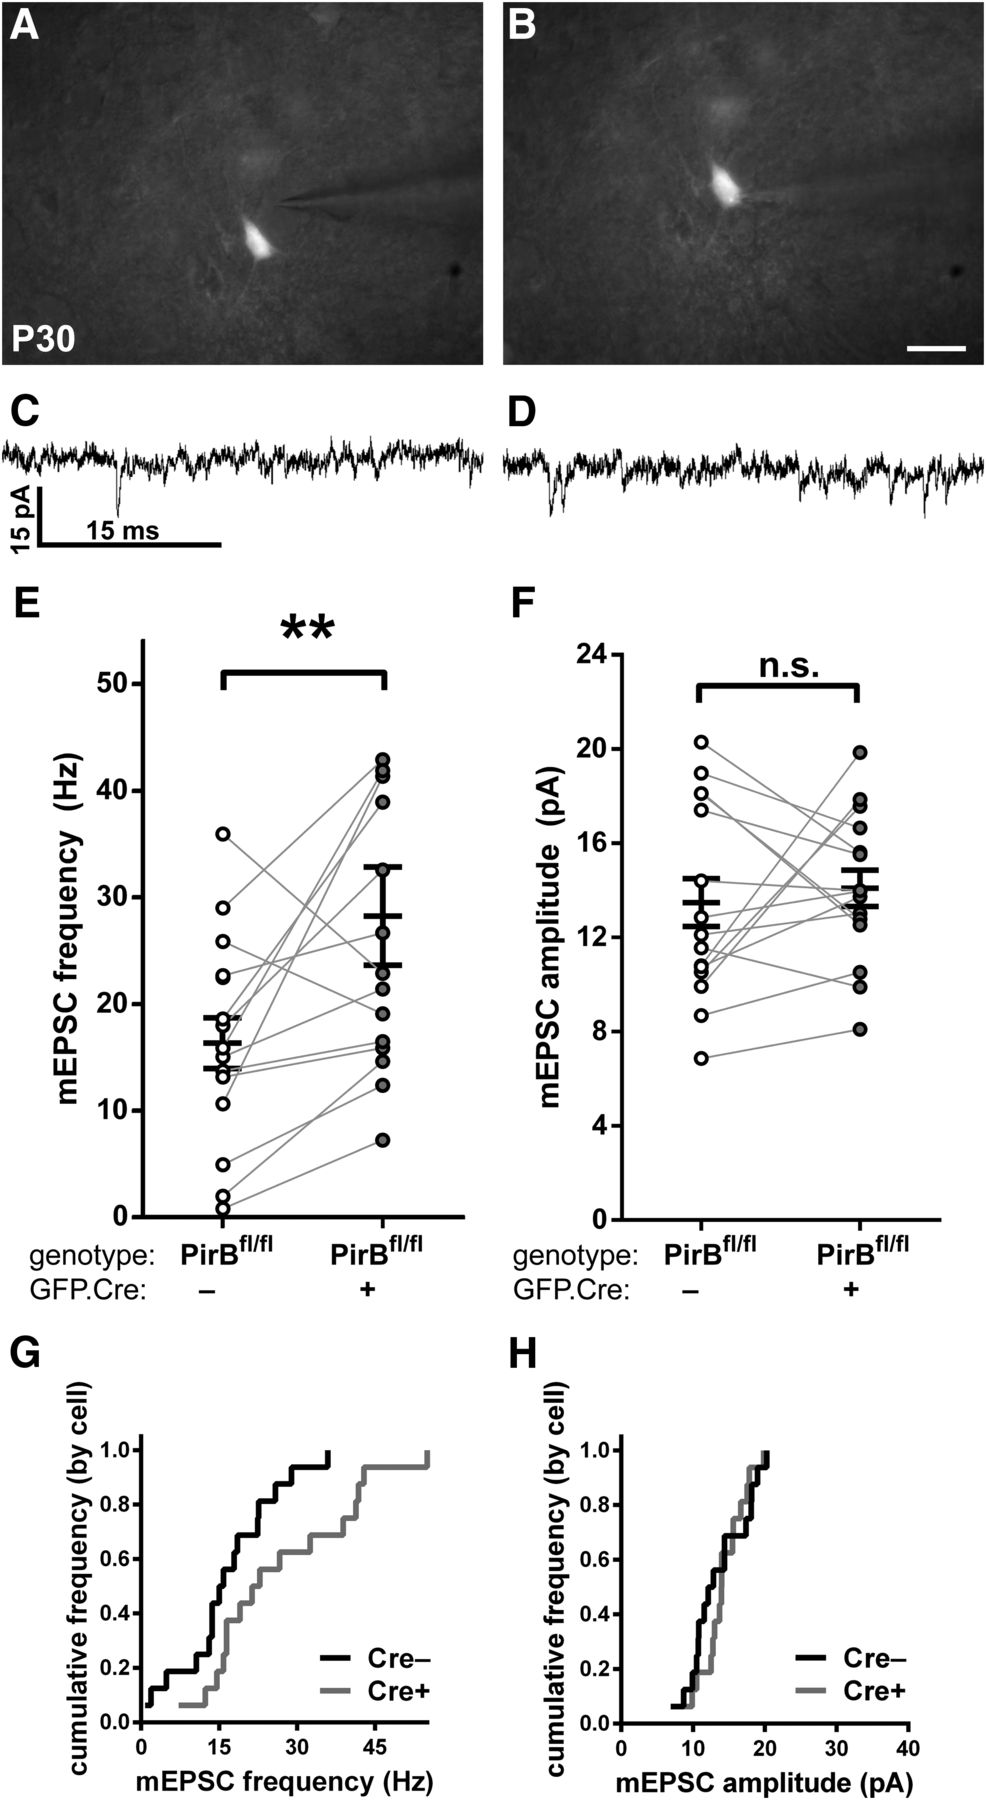
Sparse excision of PirB from PirBfl/fl at E15.5 increases mEPSC frequency but not amplitude in L2/3 pyramidal neurons in P30 visual cortex. A, C, Combined differential interference contrast and fluorescence micrographs of neurons in visual cortex used for whole-cell recordings of mEPSCs, showing GFP –;Cre− cells (A) and an isolated GFP+;Cre+ cell (C). B, D, Example mEPSC traces from GFP−;Cre− (B) or GFP+;Cre+ (D) L2/3 pyramidal neurons from primary visual cortex slices of P30 PirBfl/fl mice. E, Fluorescent micrograph showing an L2/3 pyramidal neuron filled with biocytin during mEPSC recording, and visualized with Texas Red-conjugated avidin. F, Zoomed-in, maximum-intensity projection of the boxed area in E, showing apical dendritic spines. G, In PirBfl/fl mice, mEPSC frequency is increased in GFP+;Cre+ cells compared with GFP−;Cre− cells (GFP−;Cre−: 16.91 ± 2.28 Hz, n = 17 cells, 14 slices, 8 mice; GFP+;Cre+: 28.51 ± 2.89 Hz, n = 22 cells, 14 slices, 8 mice; p = 0.0058h, Mann–Whitney test). H, Cumulative histogram (by cell) of data presented in G. I, mEPSC amplitude does not differ between GFP−;Cre− and GFP+;Cre+ cells in PirBfl/fl mice (GFP−;Cre−: 13.18 ± 0.97 pA, n = 17, cells, 14 slices, 8 mice; GFP+;Cre+: 14.32 ± 0.64 pA, n = 22 cells, 14 slices, 8 mice; p = 0.3286i, Mann–Whitney test). J, Cumulative histogram (by cell) of data presented in I. K, In control PirB+/+ mice, electroporation of GFP.Cre did not result in an increase in mEPSC frequency in GFP+;Cre+ relative to GFP−;Cre−, as expected (GFP−;Cre−: 12.53 ± 2.55 Hz, n = 11 cells, 11 slices, 6 mice; GFP+;Cre+: 15.01 ± 2.76, n = 13 cells, 11 slices, 6 mice; p = 0.4940j, Mann–Whitney test). L, Cumulative histogram of data presented in K. M, In control PirB+/+ mice, mEPSC amplitudes are not different between GFP+;Cre+ and GFP−;Cre− cells (GFP−;Cre−: 11.28 ± 1.26 pA, n = 11 cells, 11 slices, 6 mice; GFP+;Cre+: 9.73 ± 0.69, n = 13 cells, 11 slices, 6 mice; p = 0.3918k, Mann–Whitney test). N, Cumulative histogram of data (by cell) presented in M. Scale bars: A, C, 25 μm; E, 20 μm; F, 5 μm. **p < 0.01.
- Figure 5.
Sparse excision of PirB at E15.5 increases the mEPSC frequency of targeted L2/3 pyramidal neurons in visual cortex, but not in unmanipulated neighboring cells. A, B, Combined differential interference contrast and fluorescence micrograph of visual cortical slice used for whole-cell recordings, showing electrode targeting of a GFP−;Cre− cell (A) or an isolated GFP+;Cre+ cell (B). C, D, Example traces of mEPSC events in GFP−;Cre− (C) or GFP+;Cre+ (D) L2/3 pyramidal neurons in slices of visual cortex from P30 PirBfl/fl mice. E, In PirBfl/fl mice, GFP+;Cre+ cells have higher mEPSC frequency compared with GFP−;Cre− cells (GFP−;Cre−: 16.36 ± 2.38 Hz, n = 16 cells, 10 slices, 7 mice; GFP+;Cre+: 28.26 ± 4.60, n = 16 cells, 10 slices, 7 mice; p = 0.0060l, Wilcoxon signed-rank test). F, mEPSC amplitude is not significantly different in GFP−;Cre− vs GFP+; Cre+ cells (GFP−;Cre−: 13.49 ± 1.01 pA, n = 16 cells, 10 slices, 7 mice; GFP+;Cre+: 14.10 ± 0.77, n = 16 cells, 10 slices, 7 mice; p = 0.7722m, Wilcoxon signed-rank test). G, H, Cumulative histograms (by cell) of data presented in E and F, respectively. Scale bars: A, B, 25 μm. **p < 0.01
- Figure 6.
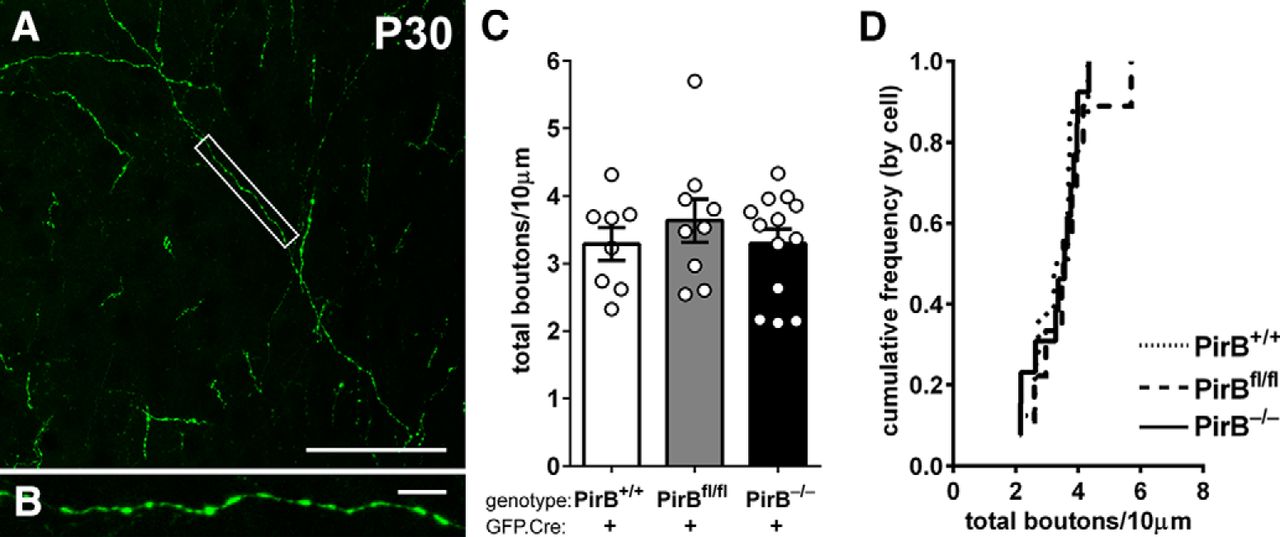
Bouton density on intracortical axons of L2/3 pyramidal cells is not changed with either sparse or germline deletion of PirB. A, Example fluorescence micrograph of boutons along axons within layer 5 arising from L2/3 pyramidal neurons. B, High-magnification, maximum-intensity projection of boxed area in A. C, Bouton density is not different among PirB+/+, PirBfl/fl, and PirB−/− L2/3 pyramidal neurons electroporated with GFP.Cre (PirB+/+: 3.3 ± 0.2, n = 8 cells, 3 mice; PirBfl/fl: 3.6 ± 0.3, n = 9 cells, 5 mice; PirB−/−: 3.3 ± 0.2, n = 13 cells, 5 mice; PirB+/+ vs PirB−/−, p = 1.000n; PirB+/+ vs PirBfl/fl, p = 1.000n; PirBfl/fl vs PirB−/−, p = 1.000n; one-way ANOVA with post hoc Bonferroni’s multiple comparisons test). D, Cumulative histogram of data (by cell). Scale bars: A, 50 μm; B, 5 μm.


Tables
Data structure Type of test Power (α = 0.05) p value a (Figs. 1I, 2G) Normality assumed (Levene’s test p = 0.118) One-way ANOVA with Bonferroni’s multiple-comparisons post hoc 0.9403 PirB+/+ Cre+ vs PirB−/− Cre+, p = 0.004; PirB+/+ Cre+ vs PirBfl/fl Cre+, p = 0.041; PirBfl/fl Cre+ vs PirB−/− Cre+, p = 1.000 b (Figs. 1J and 2H) Normality assumed (Levene’s test p = 0.233) One-way ANOVA with Bonferroni’s multiple-comparisons post hoc 0.9733 PirB+/+ Cre+ vs PirB−/− Cre+, p = 0.002; PirB+/+ Cre+ vs PirBfl/fl Cre+, p = 0.02; PirBfl/fl Cre+ vs PirB−/− Cre+, p = 1.000 c (Fig. 1K) Normal distribution Two-way ANOVA with repeated measures 0.2383 0.2443 d (Fig. 1L) Normal distribution Two-way ANOVA with repeated measures 0.9534 0.0574 e (Fig. 2K) Normal distribution Two-way ANOVA with repeated measures 0.0501 0.8864 f (Fig. 2L) Normal distribution Two-way ANOVA with repeated measures 0.0521 0.7799 g (Fig. 3C) Normality assumed (Levene’s test p = 0.494) One-way ANOVA with Bonferroni’s multiple-comparisons post hoc 0.9988 PirB+/+ Cre+ vs PirBfl/fl Cre+, p = 0.924; PirB+/+ Cre+ vs PirB−/− Cre+, p = 1.000; PirBfl/fl Cre+ vs PirB−/− Cre+, p = 1.000; P23 PirB+/+ vs P30 PirB+/+, p = 0.004; P23 PirBfl/fl vs P30 PirBfl/fl, p = 0.19; P23 PirB−/− vs P30 PirB−/−, p = 1.00 h (Fig. 4G) Normality not assumed Mann–Whitney 0.8509 0.0058 i (Fig. 4I) Normality not assumed Mann–Whitney 0.1634 0.3286 j (Fig. 4K) Normality not assumed Mann–Whitney 0.0961 0.4940 k (Fig. 4M) Normality not assumed Mann–Whitney 0.1855 0.3918 l (Fig. 5E) Normality not assumed Wilcoxon signed-rank 0.9959 0.0060 m (Fig. 5F) Normality not assumed Wilcoxon signed-rank 0.1109 0.7722 n (Fig. 6C) Normality assumed (Levene’s test p = 0.869) One-Way ANOVA with Bonferroni’s multiple comparisons post hoc 0.1347 PirB+/+ Cre+ vs PirBfl/fl Cre+, p = 1.000; PirB+/+ Cre+ vs PirB−/− Cre+, p = 1.000; PirBfl/fl Cre+ vs PirB−/− Cre+, p = 1.000
In this issue


