

Article Figures & Data
Figures
- Figure 1.
The Tritonia swim central pattern generator. A, The neural circuit underlying the swim motor pattern. The shaded oval indicates the neurons that comprise the swim CPG. The CPG consists of the following three types of interneurons: C2, DSIs, and VSI. The DSIs receive excitatory drive from the dorsal ramp interneuron (DRI), which serves as a gating neuron for the CPG (Frost and Katz, 1996). Through DRI, C2, and VSI make indirect synaptic actions onto DSI. All CPG neurons are electrically coupled to contralateral counterparts that are not represented here. Filled triangles represent excitatory synapses, and filled circles represent inhibitory synapses. Combinations of triangle and circle are multicomponent synapses. Dotted lines indicate that the connection is either polysynaptic or not determined. DFN-A, -B, dorsal flexion neurons A and B; VFN, ventral flexion neuron. Based on Getting et al. (1980), Getting (1981), Hume and Getting (1982), and Frost and Katz (1996). B, Schematic drawing of a dorsal view of the Tritonia brain, showing the locations of the swim CPG neurons and their axonal projections. DSIs and C2 are located on the dorsal surface of the cerebral ganglion. VSI is located on the ventral side of the pleural ganglion. All neurons in the swim CPG are bilaterally arranged. C2 and VSI project their axons through PdN6, whereas DSI projects through PdN5. PdN5 was removed upon isolation of the brain, as indicated by dotted lines. C, An example of the swim motor pattern recorded intracellularly from the three CPG neurons and extracellularly from PdN6 in an isolated brain preparation. The bursting pattern was elicited by stimulation of the left body wall nerve, PdN3, using voltage pulses. Arrows show onset and offset of the nerve stimulation.
- Figure 2.
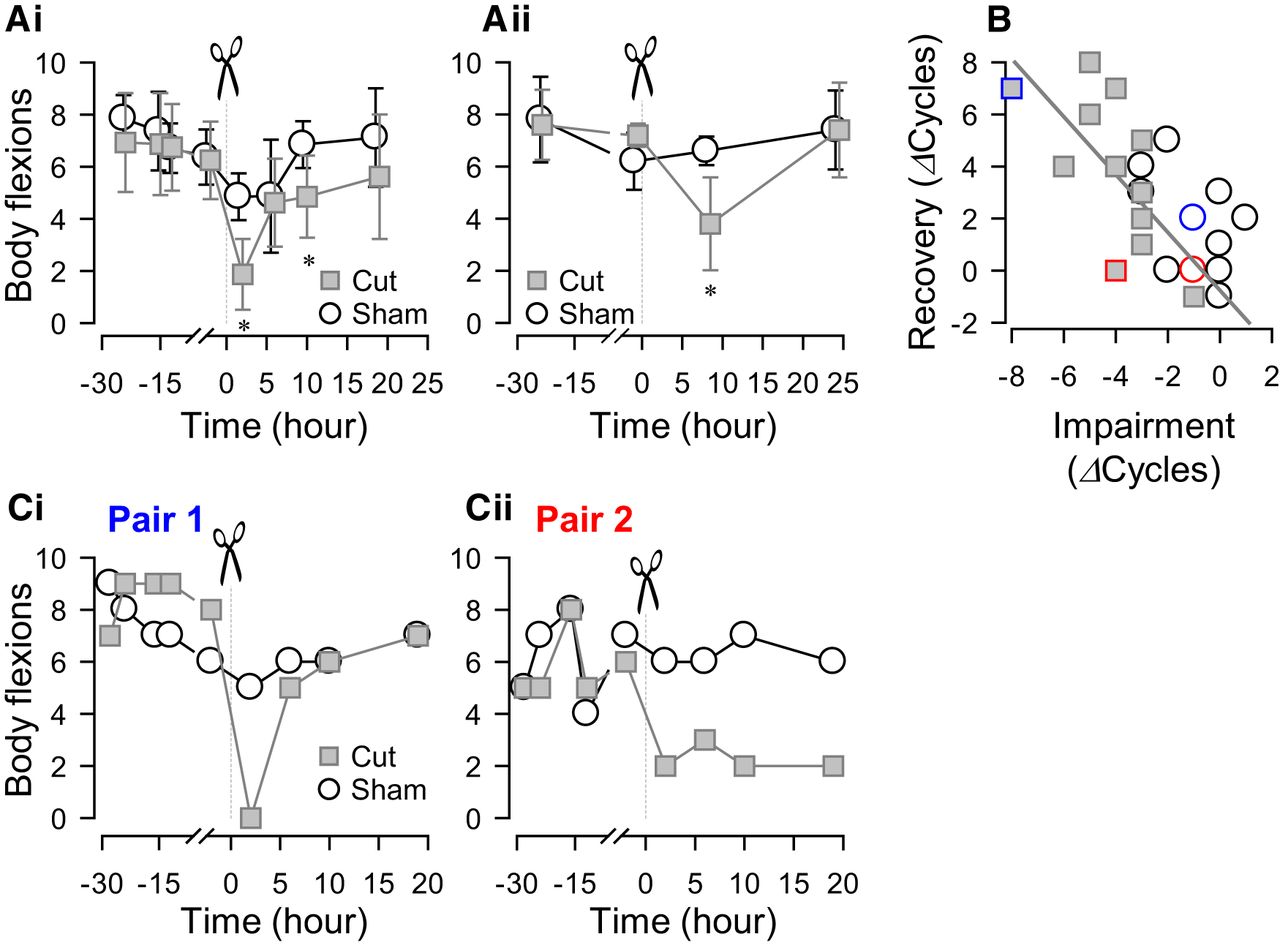
Individual variability in recovery of swimming after a lesion. A, Changes in the number of body flexions during the escape swim behavior for animals with PdN6 transected (gray squares) and sham-operated controls (white circles) measured over time. PdN6-transected animals were paired with sham-operated animals and tested in a blind fashion. In one set of experiments, the swim behavior was evoked four times (24, 15, 12, and 2 h) prior to the transection and four times (2, 6, 10, and 19 h) after the transection (N = 8 for both cut and sham; Ai). In the other set, the swim was evoked twice (24 and 1 h) prior to the transection and twice (8 and 24 h) after the transection (N = 4 for both cut and sham; Aii). A two-way repeated-measures ANOVA was conducted for each graph to test statistical significance between transected and sham animals. For both intervals, there was no statistical significance between transected and sham animals (Ai: F(1,93) = 3.24, p = 0.09; Aii: F(1,24) = 1.48, p = 0.26). However, pairwise multiple comparison procedures (Holm–Sidak method) revealed a significant difference (*) between sham and tested animals at 2 and 10 h in Ai (p = 0.002 and 0.04, respectively), and at 8 h in Aii (p = 0.003). B, The increase in the number of body flexions upon recovery showed a significant correlation, with the decrease caused by PdN6 disconnection (impairment) in test animals (gray squares; R 2 = 0.46, p = 0.01 by Pearson product moment correlation, N = 13), but not in sham animals (open circles; p = 0.09 by Pearson product moment correlation, N = 13). Blue and red symbols correspond to the examples in C (blue, pair 1; red, pair 2). C, Two examples (pair 1 and pair 2) showing different effects on the number of body flexions during the escape swim behavior for animals in response to PdN6 transection (gray squares) compared with sham-operated controls (white circles). In one example, cutting PdN6 caused a large decrease in the number of body flexions compared with sham, which was followed by recovery (pair 1, Ci). In the other example, the decreased number of body flexions did not recover after 20 h (pair 2, Cii).
- Figure 3.
Individuals differed in the extent of motor pattern recovery after disconnection of PdN6. A, Simultaneous intracellular recordings from C2, DSI, and VSI from two representative animals (animals 1 and 2). PdN6 was transected as indicated by inset drawings above the traces. The stimulus was delivered to the left PdN3 to trigger the swim motor pattern. Arrows (Stim) indicate the time of PdN3 stimulation. The brains from both animals 1 and 2 showed a decrease in the number of VSI bursts after cutting PdN6 (from 6 to 1). The number of swim cycles recovered back to five bursts in the brain from animal 1 at 19 h after PdN6 cut, whereas it remained impaired in the brain from animal 2. A dotted line on each trace indicates −50 mV membrane potential. B, Bar graph showing averages of the swim cycles binned at 1 h intervals after PdN6 transection from well recovered preparations that exhibited ≥25% recovery in the number of swim cycles. Each bar shows the mean ± SD across preparations. Asterisks indicate significant difference from control (−1 to 0 h; p < 0.005 by one-way repeated-measures ANOVA with Holm–Sidak method). C, Bar graph showing averages of the swim cycles at binned at 1 h intervals after PdN6 disconnection from poorly recovered preparations that showed <25% recovery in the number of swim cycles. Asterisks indicate significant difference from control (−1 to 0 h; p < 0.001 by one-way repeated-measures ANOVA with Holm–Sidak method). D, The CoV of the number of bursts increased after PdN6 disconnection for all preparations.
- Figure 4.
The number of swim cycles showed no correlation with the resting membrane potentials of the CPG neurons. Ai–iii, Bi–iii, Ci–iii, The resting potential of C2 (Ai–iii), DSI (Bi–iii), and VSI (Ci–iii) showed no correlation with the number of swim cycles, and no change before and after PdN6 disconnection. With PdN6 intact, the mean resting membrane potentials for C2, DSI, and VSI were 47.7 ± 3.4, 43.0 ± 3.6, and 49.0 ± 3.3 mV, respectively (mean ± SD; N = 75, 67, and 92). PdN6 disconnection caused no significant change in their resting potentials (Aiv, Biv, Civ; p > 0.5 by one-way ANOVA). Colored graph symbols in Figures 4, 5, 8, 9, 10 and 11 each represent data from the same individuals.
- Figure 5.
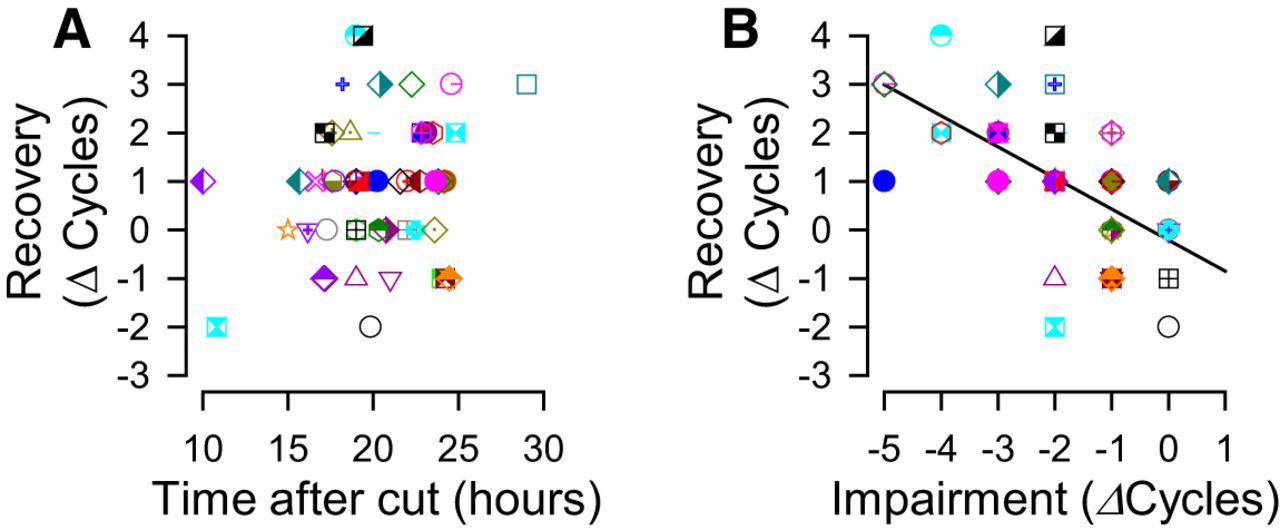
The extent of recovery was independent of time, but was dependent on the decrease in the number of swim cycles after cutting PdN6. A, There is no significant correlation between the change in the number of swim cycles in isolated brain preparations and the recorded times after PdN6 disconnection (p = 0.13 by Pearson product moment correlation, N = 54). B, The changes in the number of swim cycles after recovery was significantly correlated to the number of lost swim cycles caused by PdN6 disconnection (R 2 = 0.36, p < 0.001 by Pearson product moment correlation, N = 54).
- Figure 6.
PdN6 disconnection impairs synaptic actions of C2 onto VSI. A–C, Schematic drawings of a dorsal view of the Tritonia brain with the three CPG neurons (left) and simultaneously recorded activity of the three CPG neurons, while stimulating DSI and/or C2 (right) are shown. For stimulation, repetitive current pulses (8 nA, 20 ms) were injected into C2 or DSI, or both, at 10 Hz for 2 s while recording the membrane potential responses from VSI. A, In an intact brain, C2 makes synaptic connections onto VSI in both pedal ganglia, as indicated by dotted circles. Stimulation of C2 (Ai), or C2 and DSI together (Aiii), evoked a burst of action potentials in VSI. It was previously shown that VSI spikes are generated in the distal pedal ganglion (PdG), and they propagate antidromically to the cell body, where the intracellular recording was made (Sakurai and Katz, 2009; Sakurai et al., 2014). Stimulation of DSI depolarized C2 and hyperpolarized VSI (Aii). Although these synaptic interactions among the CPG neurons were determined to be monosynaptic, unitary synaptic potentials corresponding one to one to the presynaptic spikes have never been recorded (Getting, 1981, 1983). B, C, After PdN6 disconnection, the distal synaptic action was eliminated, and C2 stimulation mainly produced a hyperpolarizing response in VSI in the proximal pedal ganglion (Bi, Ci). The effect of DSI showed little change after PdN6 disconnection (Bii, Cii). Although C2 and DSI stimulation both had inhibitory actions onto VSI, the combination of both (C2+DSI stim.) produced a slightly larger depolarizing component than C2 alone (Biii), which grew larger in the next day (Ciii). A dotted line on each trace indicates −50 mV membrane potential. All recordings were obtained in normal saline from the same preparation.
- Figure 7.
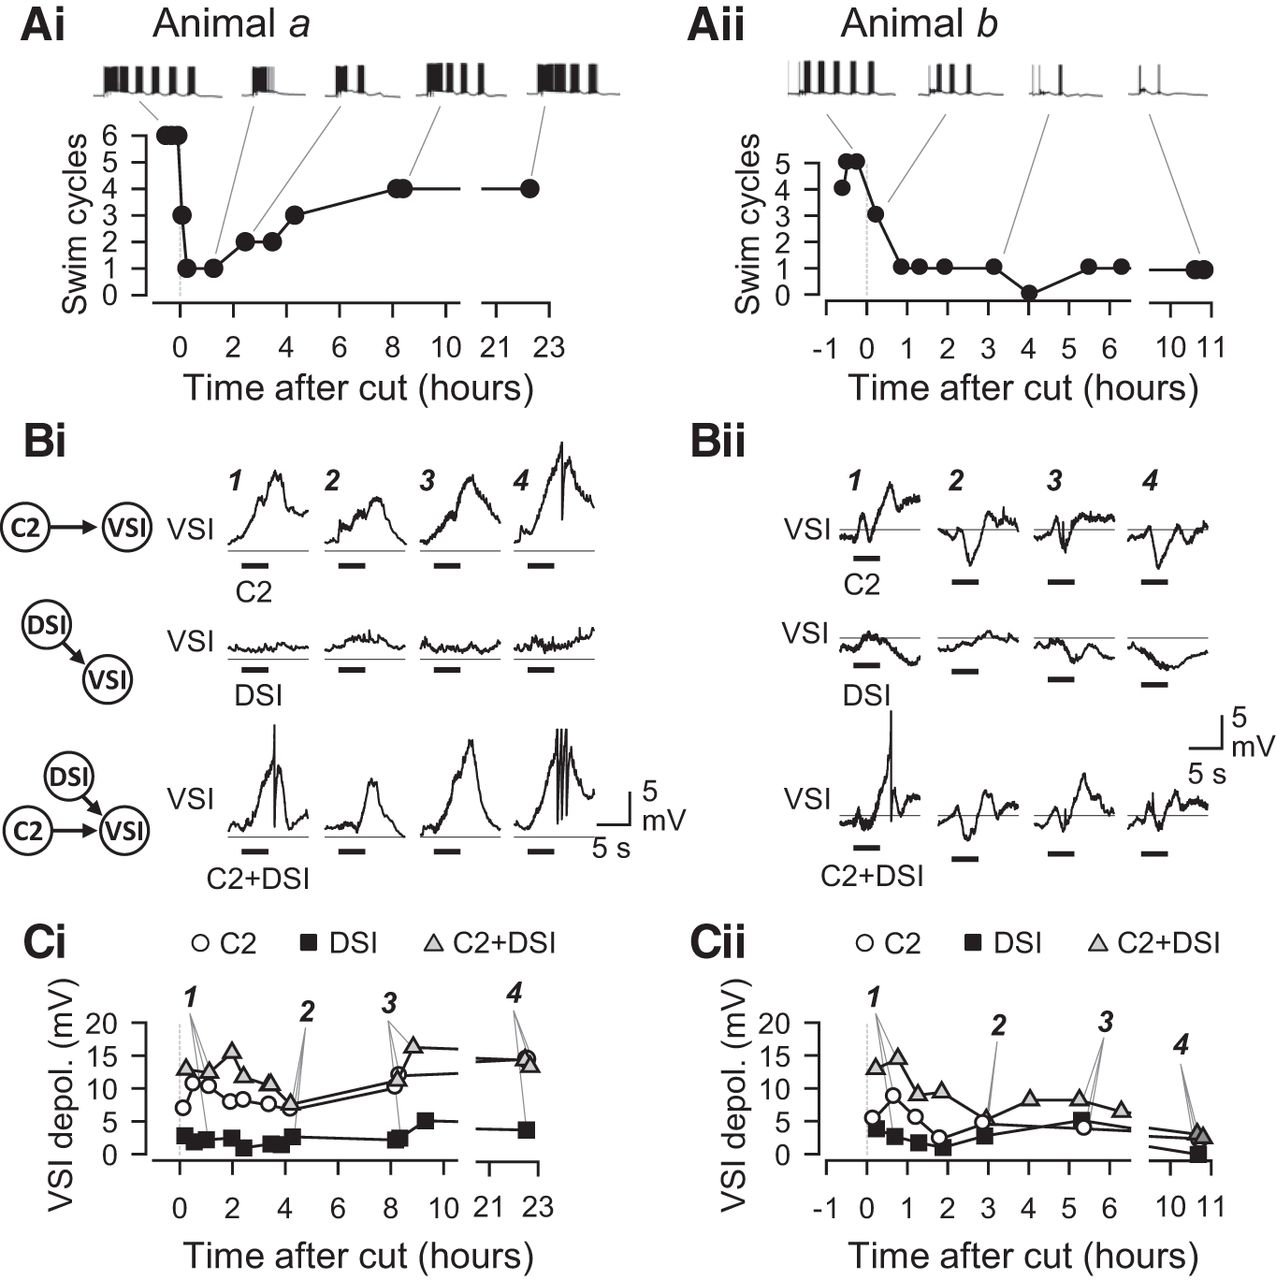
Time courses of changes in swim cycle and synaptic actions. Two examples showing temporal changes in the number of swim cycles together with the magnitudes of synaptic actions from C2 and/or DSI onto VSI. All recordings were made in normal saline. A, Plots show the time courses of changes in the number of swim cycles recorded from two different preparations, animal a (Ai) and animal b (Aii). Example traces of VSI bursts in the swim motor pattern are shown above each plot. In the brain from animal a, the number of swim cycles dropped down from 6 to 1 cycle; but it recovered back to four cycles at 8 h after PdN6 disconnection. In animal b, the number of swim cycles never recovered. B, Temporal changes in the synaptic actions within the CPG. Traces show membrane potential responses of VSI to C2 stimulation (top traces), DSI stimulation (middle traces), and combined stimulation of C2 and DSI (C2+DSI; bottom traces) in the brains from animal a (Bi) and animal b (Bii). The synaptic responses contain both monosynaptic and polysynaptic actions. In these examples, the polysynaptic component caused VSI to be depolarized even by DSI, which makes an inhibitory synapse onto VSI (Fig. 1A ). C2 and C2+DSI stimulation produced monotonic depolarization in animal a, but they produced more complex waveforms with a distinctive hyperpolarization phase in animal b. Their waveforms were not stable but constantly changed over time. The number (1–4) above each trace in B corresponds to the numbered data point in C. A horizontal line on each trace indicates a −50 mV level. C, Graphs showing changes in the amplitudes of synaptic responses in VSI evoked by the stimulation of C2 (open circles), DSI (filled squares), or C2+DSI (gray triangles). In the brain from animal a, C2 and C2+DSI produced a large depolarization in VSI, which later increased in amplitude (Ci). In contrast, synaptic responses all decreased over time in the brain from animal b (Cii).
- Figure 8.
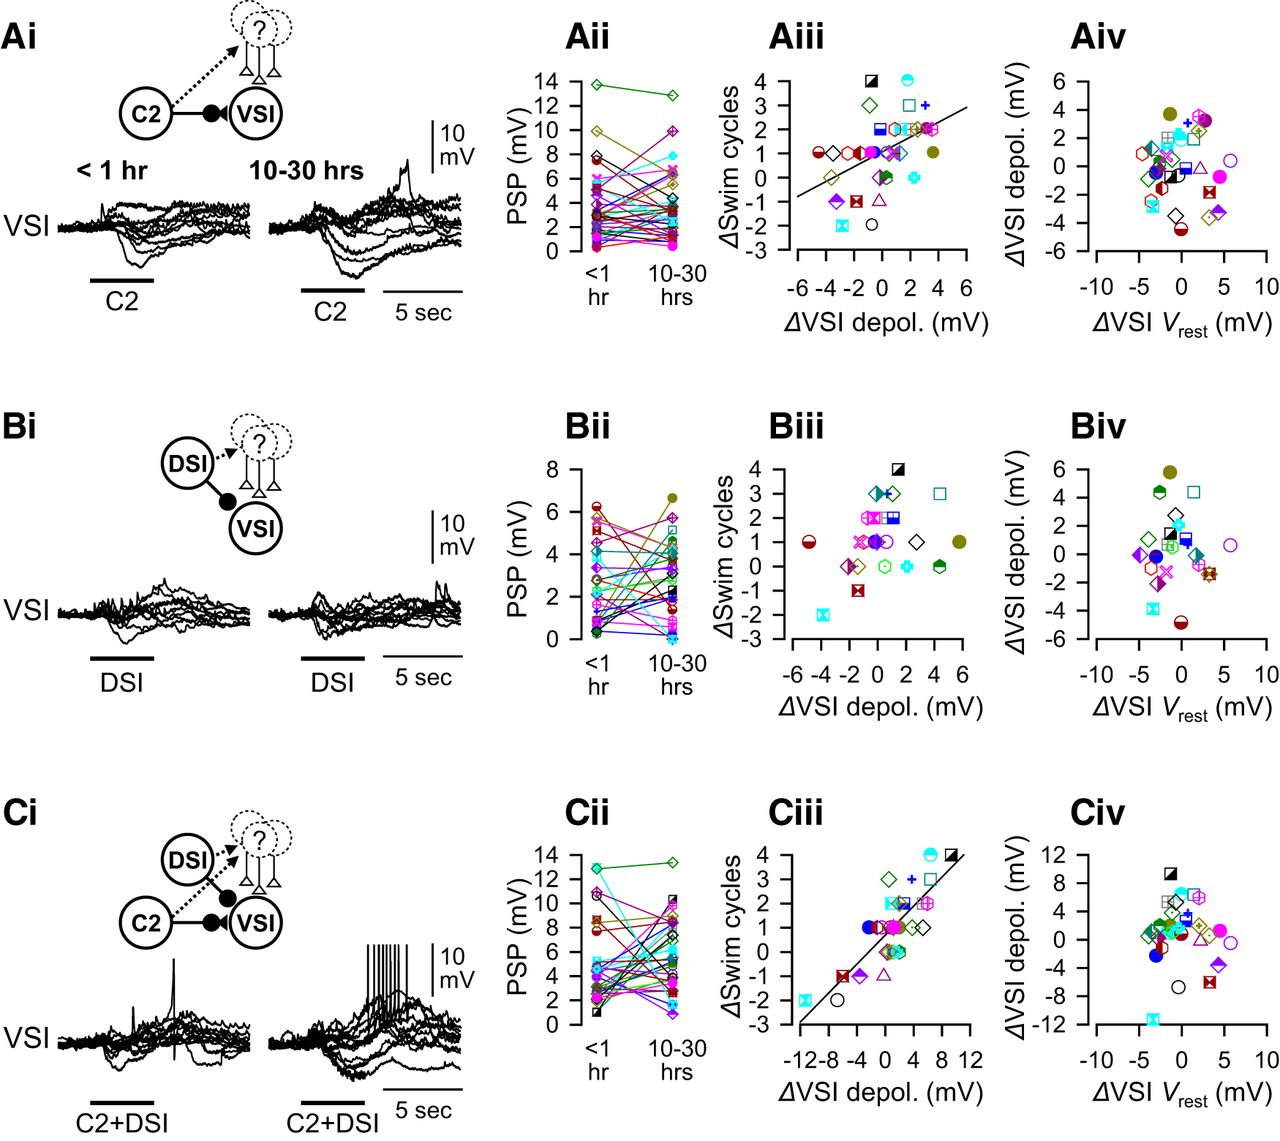
Changes in the extent of swim recovery correlated with polysynaptic actions. The amplitudes of synaptic actions of C2 and/or DSI onto VSI varied among individuals. A, C2-evoked responses in VSI. Overlaid traces of C2-evoked synaptic responses in VSI (Ai) and plots of their amplitude (Aii) are shown. The recordings were made <1 h (left) and 10–30 h (right) after PdN6 disconnection. There is a significant positive correlation between changes in the number of swim cycles 10–30 h after PdN6 disconnection (ΔSwim cycles) and changes in the amplitudes of C2-evoked depolarization (ΔVSI depolarization by C2; R 2 = 0.20, p = 0.008 by a linear regression, N = 33; Aiii). The change in the resting potential of VSI showed no correlation with the change in the amplitudes of C2-evoked depolarization (Aiv). B, DSI-evoked synaptic responses in VSI. Overlaid traces of DSI-evoked responses (Bi) and plots of their amplitudes (Bii) at two different times were shown. No correlation was seen between changes in the number of swim cycles and the DSI synaptic action (Biii; p = 0.10 by a linear regression, N = 25). The change in the resting potential of VSI showed no correlation with the DSI-evoked depolarization (Biv). C, Synaptic responses of VSI to the combined stimulation of C2 and DSI (C2+DSI). Overlaid traces of the responses (Ci) and plots of their amplitudes (Cii) at two different times were shown. There is a strong positive correlation between these parameters (Ciii; R 2 = 0.67, p < 0.001 by a linear regression, N = 30). The change in the resting potential of VSI showed no correlation with C2+DSI-evoked depolarization (Civ). The synaptic responses recorded in normal saline include both direct monosynaptic and polysynaptic actions, as indicated by insets above the overlaid traces. In Ai, Bi, and Ci, overlaid traces from 10 representative preparations were shifted to align together at the onset of the synaptic potentials.
- Figure 9.
The direct synaptic actions of C2 and/or DSI onto VSI and their changes showed wide variations, but had little or no correlation with the changes in the number of swim cycles. All recordings were made in Hi-Di saline to minimize polysynaptic components. A, C2-evoked responses in VSI. Overlaid traces of C2-evoked synaptic responses in VSI (Ai) and plots of their amplitudes of evoked depolarization (Aii, top) and hyperpolarization (Aii, bottom) are shown. Recordings were made <1 h (left) and 10–30 h (right) after the disconnection. C2 was stimulated by injecting repetitive current pulses (20 ms in duration at 10 Hz for 4 s). No correlation was seen between changes in swim cycles (ΔSwim cycles) and the amplitudes of C2-evoked depolarization (ΔVSI depolarization by C2; p = 0.43 by linear regression, N = 18; Aiii) or C2-evoked hyperpolarization (Δhyperpolarization by C2; p = 0.44 by linear regression, N = 18; Aiv). The change in the resting potential of VSI showed no correlation with C2-evoked depolarization (Av) or hyperpolarization (Avi). B, DSI-evoked synaptic responses in VSI. Overlaid traces of DSI-evoked responses (Bi) and plots of their amplitudes (Bii) at two different times were shown. No correlation was seen between changes in swim cycles and DSI-to-VSI synaptic action (Biii and Biv; p = 0.99 and 0.57 by linear regression, N = 13). The change in the resting potential of VSI showed no correlation with DSI-evoked depolarization (Bv) or hyperpolarization (Bvi). C, Synaptic response of VSI to the combined C2+DSI stimulation. Overlaid traces of the responses (Ci) and plots of their amplitudes (Cii) at two different times were shown. No correlation was seen between changes in swim cycles and the synaptic actions (Ciii and Civ; p = 0.51 and 0.57 by linear regression, N = 13). The change in the resting potential of VSI showed no correlation with C2+DSI-evoked depolarization (Cv) or hyperpolarization (Cvi). Gray circles represent control data with no PdN6 disconnection. In Ai, Bi, and Ci, overlaid traces from 10 representative preparations were shifted to align at the onset of the synaptic potential.
- Figure 10.
The recovery in the number of swim cycles was correlated with the change in the recruitment of polysynaptic inputs by C2 stimulation alone or by C2 and DSI stimulated together. A, C2 stimulation (black bar) caused a delayed increase in the number of small EPSPs recorded in VSI from unknown sources in normal saline (black trace). C2 was stimulated with repeated current pulses (20 ms, 10 nA at 10 Hz) for 4 s. Vertical bars above the voltage trace indicate the times of small EPSPs. Only EPSPs >0.1 mV were counted. The small EPSPs disappeared when Hi-Di saline was applied (gray trace). A dotted line indicates −50 mV level. Bi, Examples of VSI membrane potential traces in response to C2 stimulation at two different times (left, 1 h; right, 19 h after PdN6 transection). Tick marks above each trace indicate the times of small EPSPs that rode on top of basal membrane fluctuation in VSI. C2 stimulation caused an increase in the frequency of the small EPSPs. The recruitment of EPSPs increased 19 h after PdN6 transection. Bii, Plot of the EPSP frequencies at two times show individual variations in the direction of changes in their frequencies. EPSP frequency was measured in a 6 s window after the C2 stimulation. Biii, The change in the number of swim cycles (ΔSwim cycles) 10–30 h after PdN6 disconnection showed a weak but significant correlation with the change in C2 recruitment of EPSPs (R 2 = 0.15, p = 0.04 by linear regression, N = 28). C, Stimulation of DSI slightly increased the occurrence of spontaneous EPSPs in VSI. Ci, An example of DSI-evoked membrane potential responses in VSI at two different times and the occurrence of small EPSPs. Cii, Plot of the EPSP frequencies at two times shows individual variations in the direction of changes in their frequency. Ciii, The change in the swim cycles showed no significant correlation to the change in frequency of DSI-evoked EPSPs (R 2 = 0.15, p = 0.11 by linear regression, N = 18). D, Stimulation of C2 and DSI together increased the appearance of spontaneous EPSPs in VSI. Di, An example of VSI membrane potential responses and recruitment of small EPSPs after a combined stimulation of C2 and DSI at two different times. Dii, Plot of the EPSP frequencies at two times show individual variations in the direction of changes in their frequency. Diii, The change in swim cycles (ΔSwim cycles) 10–30 h after PdN6 disconnection shows a strong correlation with the increase in EPSP frequency (R 2 = 0.36, p = 0.002 by linear regression, N = 23). A dotted line under each trace indicates −50 mV membrane potential.
- Figure 11.
The change in the intraburst spike rate in VSI correlated with the extent of polysynaptic actions induced by combined action of C2 and DSI. A, Simultaneous intracellular recordings from C2, DSI, and VSI from two representative animals (animals X and Y). Five minutes after cutting PdN6, animal X showed a decrease in the number of VSI spikes during the second burst of the swim motor pattern (asterisk). In contrast, there was little effect on the spiking in the second VSI burst in animal Y (asterisk). Twenty-two hours after PdN6 cut, VSI spiking during the second burst of the swim motor pattern recovered in animal X (arrowhead), whereas 19 h after PdN6 the VSI in animal Y fired fewer spikes than before (arrowhead). Arrows (Stim) indicate the time of PdN3 stimulation. B–D, Bar graphs show the average number of spikes of C2 (B), DSI (C), and VSI (D) in the second burst in the swim motor pattern counted before cutting PdN6 (Intact), shortly after cutting PdN6 (<1 h), and the next day (10–30 h). Before cutting PdN6, the number of spikes in the second bursts were 50.4 ± 16.0 (C2, N = 45), 34.8 ± 9.8 (DSI, N = 41), and 37.5 ± 8.8 (VSI, N = 45). Shortly after the cut (<1 h), they were 44.0 ± 15.4 (C2, N = 43), 32.7 ± 12.0 (DSI, N = 39), and 16.5 ± 12.0 (VSI, N = 47). The next day (10–30 h), they became 49.3 ± 20.5 (C2, N = 36), 36.5 ± 12.3 (DSI, N = 30), and 19.5 ± 12.9 (VSI, N = 41). The average number of VSI spikes shortly after cutting PdN6 and the next day were significantly lower than before the cut, as indicated by asterisks (p < 0.001 by Kruskal–Wallis one-way ANOVA on ranks with Dunn’s method). E–G, Plots of CoV corresponding to the bar graphs above (B–D). C2 and DSI showed relatively constant variance throughout the experiments (E, F), whereas VSI showed an increase in variance (G). There was a significant difference in variance of the VSI spike number between intact and <1 h (p = 0.02 by Levene median test) and between intact and 10–30 h (p = 0.002 by Levene median test). H, C2-evoked direct synaptic responses in VSI showed no correlation with the changes in the number of VSI spikes in the second burst of swim motor patterns. Changes in the number of VSI spikes in the second burst of motor patterns 15–30 h after PdN6 disconnection (ΔVSI spikes) were plotted against the change in the amplitudes of the depolarization phase of the C2+DSI-evoked synaptic potential measured (ΔVSI depolarization, Hi) or that of the C2+DSI-evoked hyperpolarization phase (Δhyperpolarization, Hii) in Hi-Di saline. There was no correlation between these parameters (p = 0.78 and 0.57, N = 14). I, The changes in the intraburst VSI spikes (ΔVSI spikes) upon recovery showed a significant correlation with the changes in the polysynaptic depolarization in VSI evoked by C2+DSI stimulation in normal saline (R 2 = 0.28, p = 0.004 by linear regression, N = 27). J, The changes in the number of VSI spikes in the second burst upon recovery was correlated with the changes in the frequency of small EPSPs recruited by C2+DSI stimulation (R 2 = 0.63, p < 0.001 by linear regression, N = 20).
- Figure 12.
Mechanism underlying the functional recovery of the swim motor circuit after a partial lesion of the network. C2 synapses onto VSI in at least two places, one proximal and the other distal to PdN6. C2 and DSI both make indirect excitatory inputs (dashed lines) onto VSI through unidentified neurons. Under normal conditions, C2 excites VSI mainly through the excitatory synapse at the distal site (Sakurai and Katz, 2009; Sakurai et al., 2014), while it also recruits polysynaptic pathways (Sakurai et al., 2014). Upon disconnecting PdN6, the distal excitatory synapse from C2 to VSI is lost (middle). The swim motor pattern is often impaired because VSI receives less excitation. Upon recovery, polysynaptic pathways involving the recruitment of unidentified neurons play a larger role in providing excitation from C2 to VSI. The size of the "+" signs indicates the strength of excitatory synaptic inputs onto VSI.


Tables
Figure Panel Date structure Test type p value N 2 Ai Normally distributed Two-way RM ANOVA 0.09 8,8 2 Ai Normally distributed Pairwise multiple comparison (Holm–Sidak method) 0.002, 0.04 8, 8 2 Aii Normally distributed Two-way RM ANOVA 0.26 4, 4 2 Aii Normally distributed Pairwise multiple comparison (Holm–Sidak method) 0.003 4, 4 2 C Normally distributed Pearson product moment correlation 0.01, 0.09 12, 12 3 B Normally distributed One-way RM ANOVA with Holm–Sidak method <0.001 3–21 3 C Normally distributed One-way RM ANOVA with Holm–Sidak method <0.001 5–28 4 Ai Normally distributed Pearson product moment correlation 0.86 75 4 Aii Normally distributed Pearson product moment correlation 0.54 73 4 Aiii Normally distributed Pearson product moment correlation 0.84 45 4 Aiv Normally distributed One-way ANOVA 0.59 75, 73, 45 4 Bi Normally distributed Pearson product moment correlation 0.54 67 4 Bii Normally distributed Pearson product moment correlation 0.45 68 4 Biii Normally distributed Pearson product moment correlation 0.85 44 4 Biv Normally distributed One-way ANOVA 0.97 67, 68, 44 4 Ci Normally distributed Pearson product moment correlation 0.36 89 4 Cii Normally distributed Pearson product moment correlation 0.76 84 4 Ciii Normally distributed Pearson product moment correlation 0.31 54 4 Civ Normally distributed One-way ANOVA 0.61 92, 88, 57 5 A Normally distributed Pearson product moment correlation 0.13 54 5 B Normally distributed Pearson product moment correlation <0.001 54 8 Aiii Normally distributed Linear regression 0.008 33 8 Aiv Normally distributed Linear regression 0.99 33 8 Biii Normally distributed Linear regression 0.10 25 8 Biv Normally distributed Linear regression 0.94 25 8 Ciii Normally distributed Linear regression <0.001 30 8 Civ Normally distributed Linear regression 0.93 30 9 Aiii Normally distributed Linear regression 0.43 18 9 Aiv Normally distributed Linear regression 0.44 18 9 Av Normally distributed Linear regression 0.49 18 9 Avi Normally distributed Linear regression 0.17 18 9 Biii Normally distributed Linear regression 0.99 13 9 Biv Normally distributed Linear regression 0.57 13 9 Bv Normally distributed Linear regression 0.11 13 9 Bvi Normally distributed Linear regression 0.59 13 9 Ciii Normally distributed Linear regression 0.51 13 9 Civ Normally distributed Linear regression 0.57 13 9 Cv Normally distributed Linear regression 0.06 13 9 Cvi Normally distributed Linear regression 0.77 13 10 Aiii Normally distributed Linear regression 0.04 28 10 Biii Normally distributed Linear regression 0.11 18 10 Ciii Normally distributed Linear regression 0.002 23 11 B Normally distributed One-way ANOVA 0.38 41, 39, 30 11 C Normally distributed One-way ANOVA 0.18 45, 43, 36 11 D Normality not assumed Kruskal–Wallis one-way ANOVA on ranks with Dunn’s method <0.001 45, 47, 41 11 G Normality not assumed Levene median test <0.02, <0.002 47, 41 11 Hi Normally distributed Linear regression 0.78 14 11 Hii Normally distributed Linear regression 0.57 14 11 I Normally distributed Linear regression 0.004 27 11 J Normally distributed Linear regression <0.001 20 RM, Repeated measures.
In this issue


