

Article Figures & Data
Figures
- Figure 1.
Glycolytic and mitochondrial respiration rates in WT and scn1Lab mutant zebrafish at baseline and after 4-AP stimulation. A, B, Scn1Lab mutant zebrafish have lower baseline glycolytic and mitochondrial respiration rates than WT zebrafish. 4-AP immediately increases glycolytic and mitochondrial respiration rates in WT zebrafish. Scn1Lab mutant zebrafish have a delayed response to 4-AP of ∼30 min. Statistical analysis shows changes relative to time-matched untreated controls; points represent means±S.E.M. N = 14 (WT), 16 (scn1Lab), 16 (WT+4-AP), 14 (scn1Lab+4-AP) individual animals, mean±S.E.M. A, WT vs scn1Lab: p < 0.0001a; WT vs WT+4-AP, p = 2.38e-30 (8 min)o, p = 8.41e-30 (16 min)p, p = 3.50e-26 (24 min)q, p = 3.99e-24 (32 min)r, p = 2.92e-25 (40 min)s, p = 1.70e-21 (48 min)t; scn1Lab vs scn1Lab+4-AP: p = 3.28e-6 (8 min)u, p = 1.65e-11 (16 min)v, p = 1.86e-13 (24 min)w, p = 3.08e-17 (32 min)x, p = 2.34e-14 (40 min)y, p = 3.52e-15 (48 min)z. B, WT vs scn1La: p < 0.0001aa; scn1Lab versus scn1Lab+4-AP: p = 0.00071 (32 min)bb, p = 2.20e-5 (40 min)cc, p = 7.24e-5 (48 min)dd. C, D, Locomotion plots for behavioral seizure activity in WT zebrafish exposed to 4 mmm 4-AP. Bar plot showing the mean ± SEM for WT fish at baseline, 8 min after exposure to 4-AP and 48 min after exposure to 4-AP. N = 48 WT fish; Kruskal–Wallis one-way ANOVA on ranks with a post hoc Tukey test. p < 0.05c,d (8 min vs baseline).
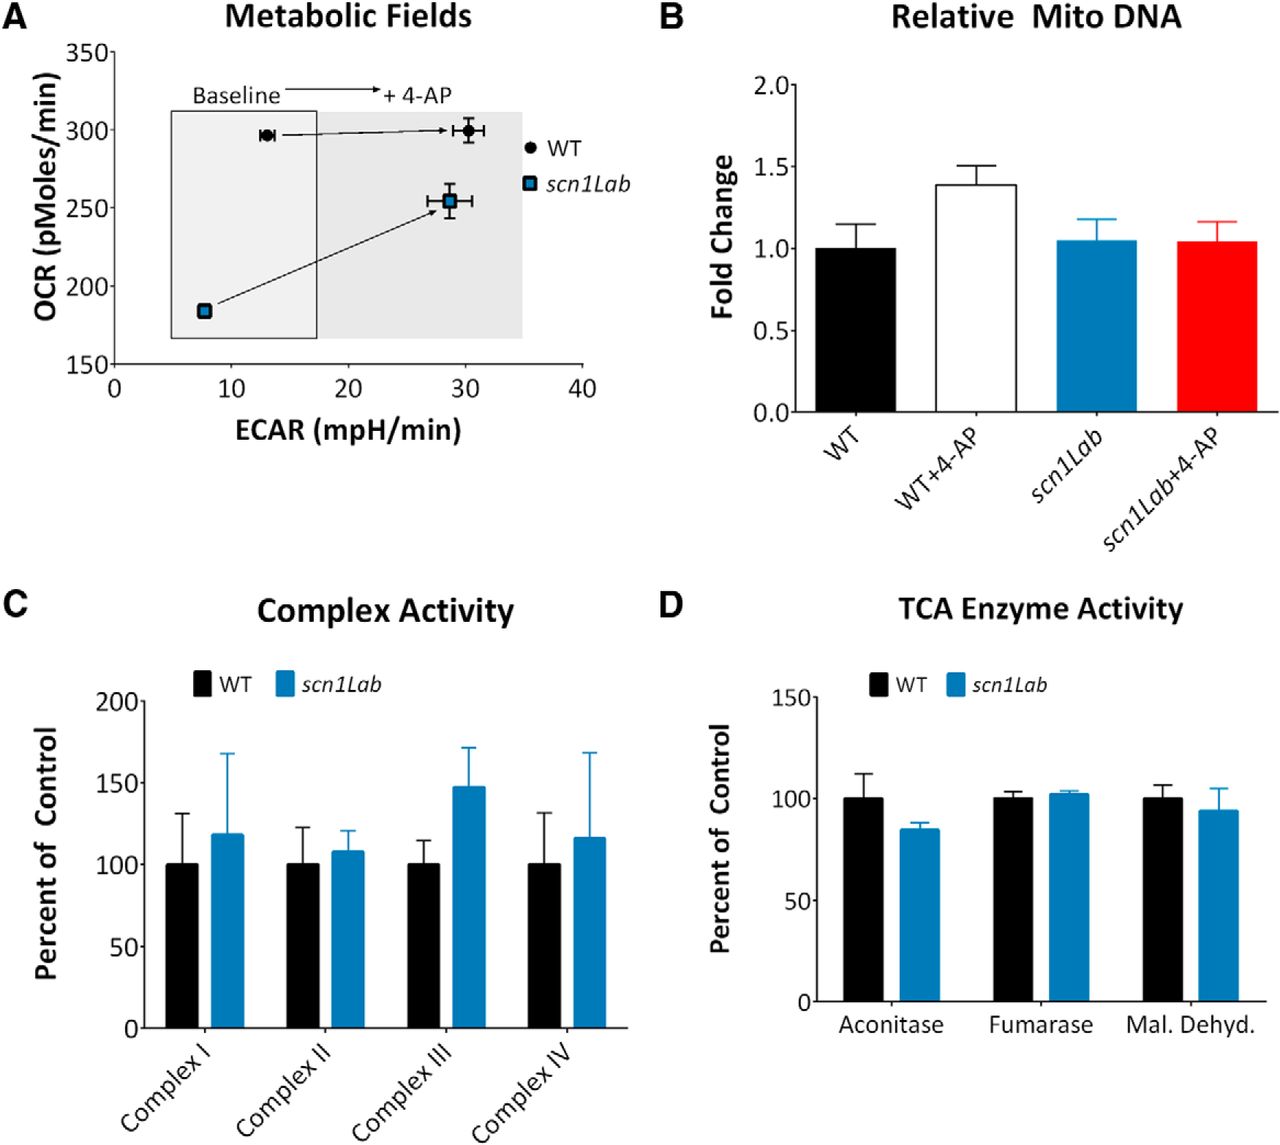
- Figure 2.
Respiratory chain complex activity in WT and scn1Lab mutant zebrafish. A, ECAR and OCR from Figure 1 are replotted to demonstrate the metabolic field and the increases in metabolic field after treatment with 4-AP. Scn1Lab mutant zebrafish increase metabolism to approach the metabolic state of WT zebrafish after 4-AP, suggesting mutant zebrafish retain a similar metabolic capacity as WT zebrafish; each point represents mean±S.E.M. B, Relative mitochondrial copy number was determined by total mitochondrial DNA. No significant differences were found (n = 3 individual animals per group; one-way ANOVA, p = 0.2056gg). C, There is no difference in activity in complexes I–IV in WT and scn1Lab mutant zebrafish. Bars represent the mean ± SEM relative to WT activity, n = 3 groups with 25–30 fish pooled per group. Two-way ANOVA, interaction, p = 0.9367hh. D, There are no differences in activity in selected TCA cycle enzymes in WT and scn1Lab mutant zebrafish. Bars represent the mean ± SEM relative to WT activity, n = 4 groups with 30 fish per group. Two-way ANOVA, interaction, p = 0.5801ii.
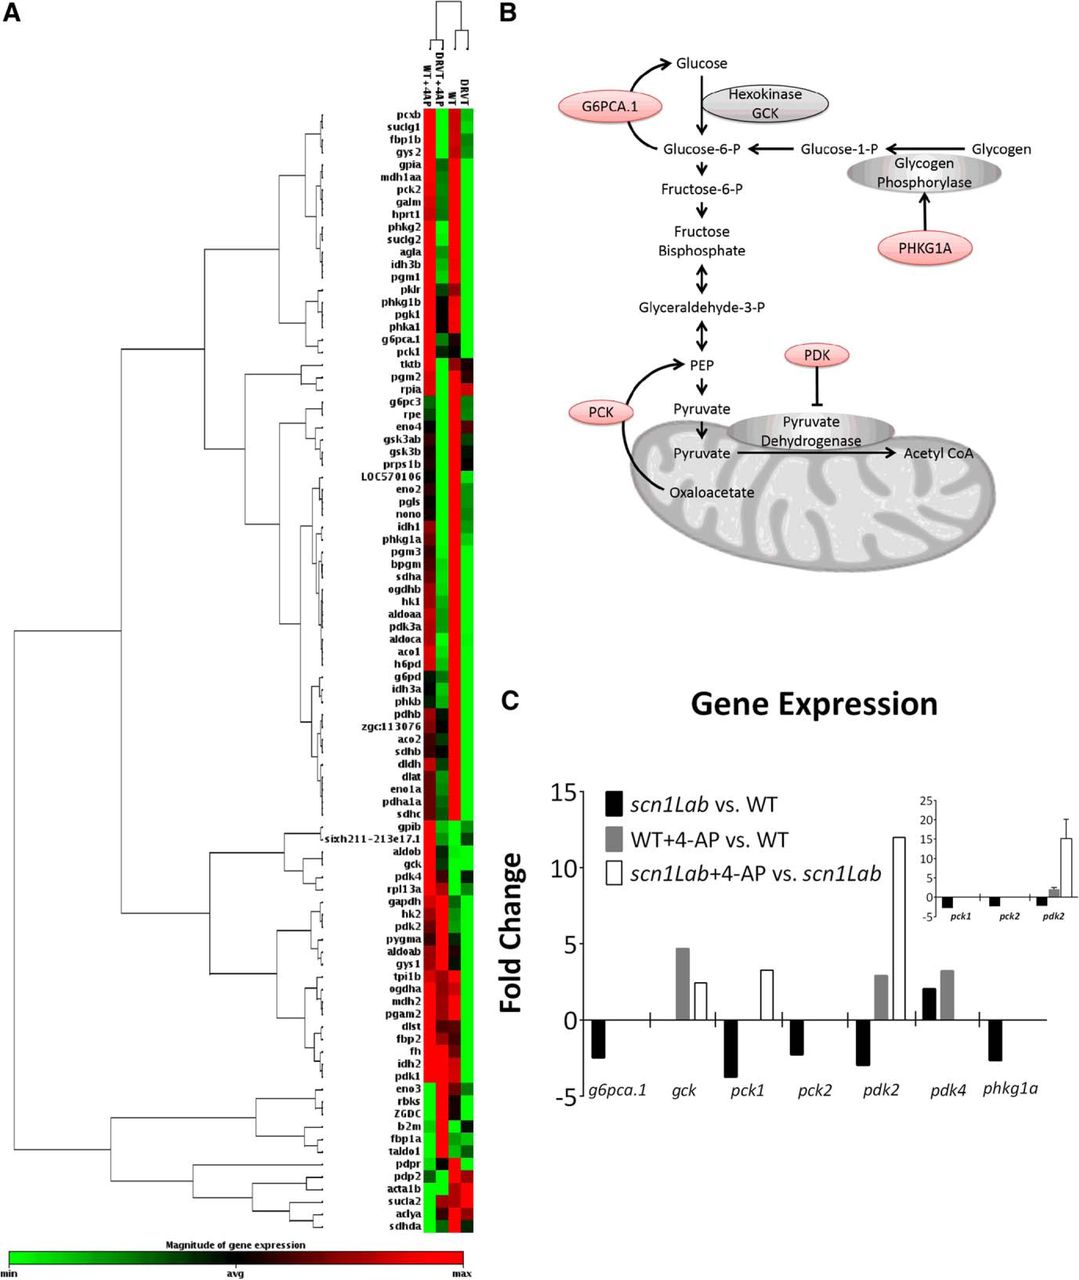
- Figure 3.
Glucose metabolism-related gene expression in WT and scn1Lab mutant zebrafish (DRVT) at baseline and after 4-AP stimulation. A, Heatmap demonstrating relative expression of all genes analyzed from array. B, Schematic depicting the pathways in which up or downregulated genes are involved. Red color indicates downregulated genes in scn1Lab mutant zebrafish vs WT at baseline. C, Graph showing the seven genes with twofold or greater changes relative to respective controls. n = 6 pooled embryos per group analyzed once. Inset, PCR verification of genes for which specific primers were available, pck2, pck4, and pdk2. N = 3 groups of pooled embryos (6 per group) analyzed in triplicate, mean±S.E.M.
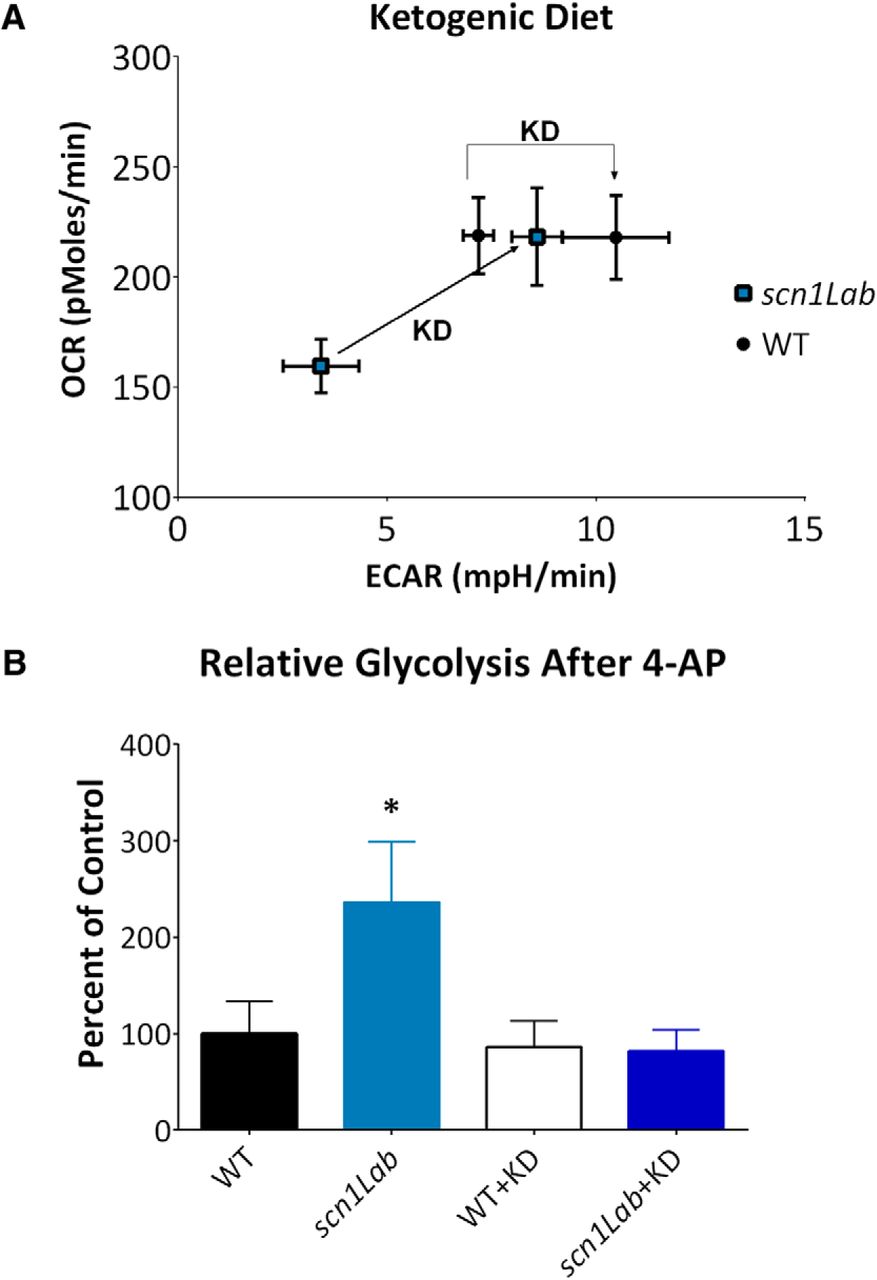
- Figure 4.
Ketogenic diet restores metabolism of scn1Lab mutant zebrafish to WT levels. A, Metabolic profile of WT zebrafish is shifted slightly to be more glycolytic after KD treatment. Mutant zebrafish increase both glycolysis and mitochondrial respiration to WT levels. B, KD treatment reduces mutant zebrafish response to 4-AP to similar to WT levels. N = 4 (WT), 4 (scn1Lab), 5 (WT+KD), 5 (scn1Lab+KD), p = .017jj. Values or bars indicate mean±S.E.M.
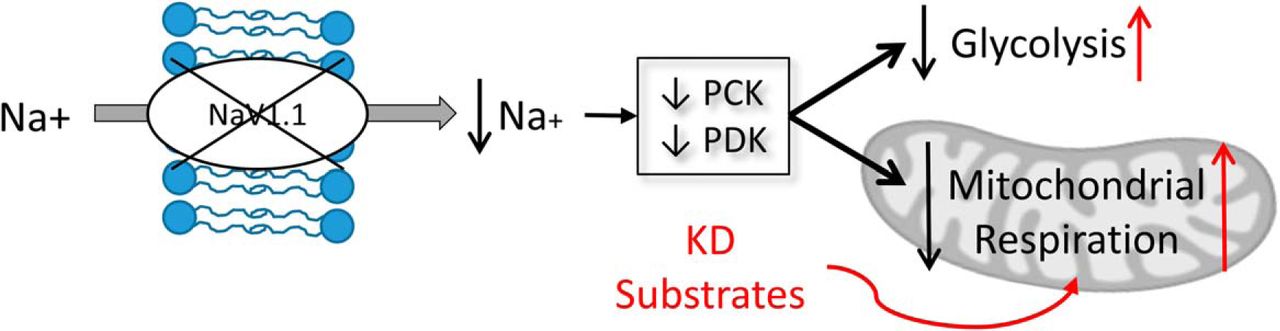
- Figure 5.
Summary diagram depicting proposed mechanism. Mechanism demonstrating changes in glycolysis and mitochondrial respiration in scn1 mutant zebrafish at baseline (in black) and proposed action of KD (in red).
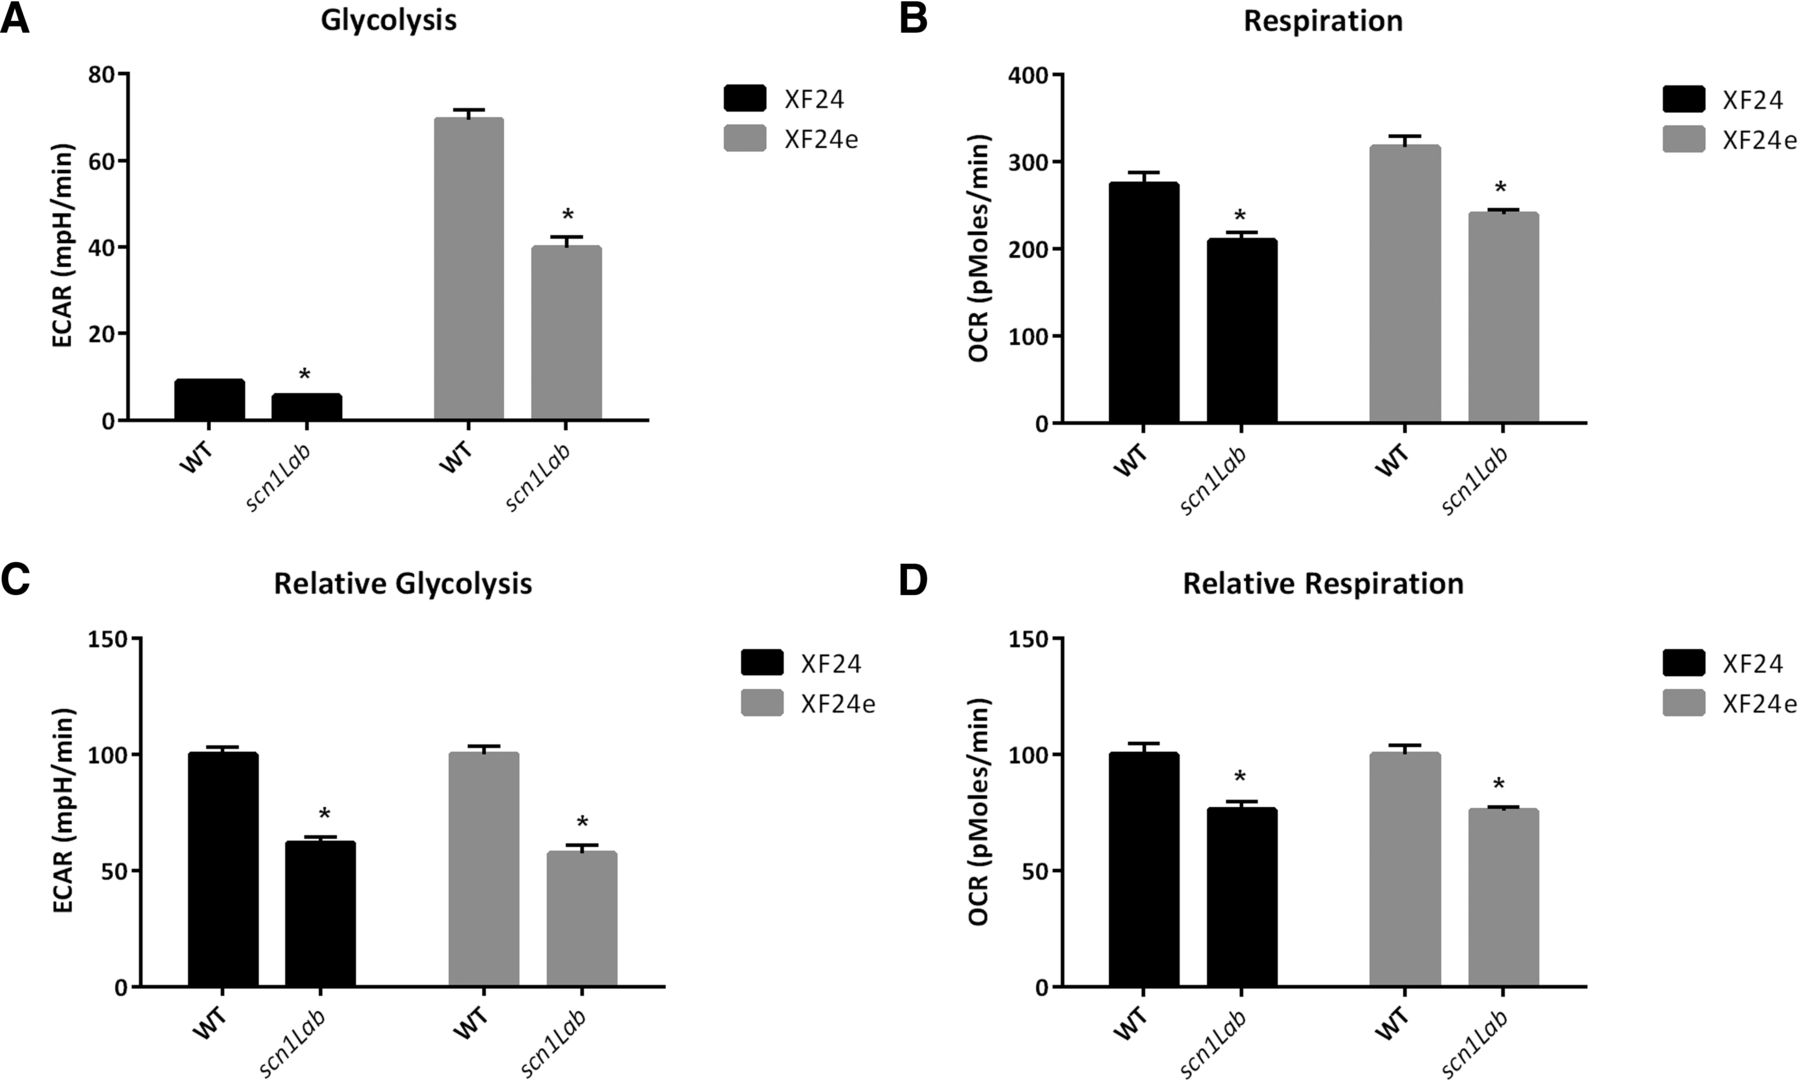
- Figure 6.
Metabolic differences in WT and scn1lab mutant zebrafish are reproducible when grown in a separate facility, as well as with different instrumentation. All zebrafish in this figure were bred and grown at UCD. Using the same instrumentation as Figures 1 and 4 (XF24) the baseline differences are recapitulated in zebrafish grown at UCSF. The newer model of extracellular flux analysis (XF24e) is more sensitive and thus has higher baseline values for both glycolysis and mitochondrial respiration. A, B, Absolute baseline differences in glycolysis and respiration are recapitulated in both the XF24 and newer XF24e. A, XF24, p < .000kk; XF24e, p < .00ll; B, XF24, p = .00mm; XF24e, p < .00nn. C, D, Although the XF24e is more sensitive, the relative differences in glycolysis and respiration are similar in both the XF24 and XF24e. C, XF24, p < .00oo; XF24e, p < .00pp. D, XF24, p = .0002qq; XF24e, p < .0001rr. Bars represent mean±S.E.M.


Tables
Data structure Type of test Confidence interval a Normal distribution t test −6.78 to −3.94 b Normal distribution t test −116.0 to −98.31 c Non-normal distribution (Shapiro–Wilk test p < 0.05) One-way ANOVA Kruskal–Wallis on ranks with a post hoc Tukey test p < 0.01 ANOVA
8 min vs baseline: p < 0.05d Non-normal distribution (Shapiro–Wilk test p < 0.05) One-way ANOVA Baseline vs 48 min: p > 0.05 e Normal distribution Unpaired t test −23.76 to −15.36 f Normal distribution t test with Holm–Sidak for multiple comparisons −245.2 to −110.5 g Normal distribution t test with Holm–Sidak for multiple comparisons −64.78 to −20.95 h Normal distribution One-way ANOVA WT vs WT+4-AP −0.9128 to 0.1422 WT vs scn1Lab −0.5763 to 0.4787 WT vs scn1Lab+4-AP −0.5664 to 0.4886 i Normal distribution Two-way ANOVA Complex I −148.8 to 112.6 Complex II −138.4 to 123.1 Complex III −177.9 to 83.56 Complex IV −146.6 to 114.9 j Normal distribution Two-way ANOVA Aconitase −15.04 to 45.86 Fumarase −32.52 to 28.38 Mal. Dehyd. −21.06 to 33.41 k Normal distribution t test −0.3722 to 3.172 l Normal distribution t test 65.33 to 64.27 m Normal distribution t test −236.8 to 132.0 n Normal distribution t test −1.676 to 0.3118 o Normal distribution t test with Holm–Sidak for multiple comparisons −33.97 to −22.24 p Normal distribution t test with Holm–Sidak for multiple comparisons −33.59 to −21.85 q Normal distribution t test with Holm–Sidak for multiple comparisons −31.04 to −19.30 r Normal distribution t test with Holm–Sidak for multiple comparisons −29.59 to −17.86 s Normal distribution t test with Holm–Sidak for multiple comparisons −30.39 to −18.66 t Normal distribution t test with Holm–Sidak for multiple comparisons −27.73 to −16.00 u Normal distribution t test with Holm–Sidak for multiple comparisons −18.01 to −6.278 v Normal distribution t test with Holm–Sidak for multiple comparisons −24.10 to −12.37 w Normal distribution t test with Holm–Sidak for multiple comparisons −26.07 to −14.33 x Normal distribution t test with Holm–Sidak for multiple comparisons −29.68 to −17.95 y Normal distribution t test with Holm–Sidak for multiple comparisons −26.95 to −15.21 z Normal distribution t test with Holm–Sidak for multiple comparisons −27.74 to −16.01 aa Normal distribution t test −116.0 to −98.31 bb Normal distribution t test with Holm–Sidak for multiple comparisons −112.2 to −6.900 cc Normal distribution t test with Holm–Sidak for multiple comparisons −128.0 to −22.77 dd Normal distribution t test with Holm–Sidak for multiple comparisons −122.9 to −17.64 ee Normal distribution One-way ANOVA Control vs 10 μm −3.649 to 7.982 Control vs 50 μm −6.585 to 5.046 Control vs 100 μm −4.812 to 6.819 Control vs 1 mm −6.324 to 5.307 Control vs 4 mM −7.943 to 2.825 ff Normal distribution One-way ANOVA Control vs 10 μm −67.77 to 93.79 Control vs 50 μm −62.06 to 99.49 Control vs 100 μm −39.08 to 122.5 Control vs 1 mm −19.22 to 142.3 Control vs 4 mm −19.85 to 129.7 gg Normal distribution One-way ANOVA WT vs WT+4-AP −0.9128 to 0.1422 WT vs scn1Lab −0.5763 to 0.4787 WT vs scn1Lab+4-AP −0.5664 to 0.4886 hh Normal distribution Two-way ANOVA Complex I −148.8 to 112.6 Complex II −138.4 to 123.1 Complex III −177.9 to 83.56 Complex IV −146.6 to 114.9 ii Normal distribution Two-way ANOVA Aconitase −15.04 to 45.86 Fumarase −32.52 to 28.38 Mal. Dehyd. −21.06 to 33.41 jj Normal distribution t test 1.783 to 8.531 kk Normal distribution t test −4.128 to −2.727 ll Normal distribution t test −36.51 to −22.87 mm Normal distribution t test −98.59 to −32.08 nn Normal distribution t test −104.4 to −49.14 oo Normal distribution t test −46.07 to −30.43 pp Normal distribution t test −52.57 to −32.94 qq Normal distribution t test −35.93 to −11.69 rr Normal distribution t test −32.95 to −15.50
In this issue


