

Article Figures & Data
Figures
- Figure 1.
GPR55 protein and mRNA expression in the retina. A–F, At P1, GPR55 protein and mRNA are expressed in the hamster retina (A–C), expression of GPR55 protein in the ganglion cell layer (D–F). G–L,GPR55 protein and mRNA are present in the E14/15 mouse retina (G–I), especially for GPR55 protein in the ganglion cell layer (J–L). M–O, GPR55 protein and mRNA are expressed in the adult mouse retina. P–R, The specificity of the antibody and the mRNA probe was validated using gpr55-/- mice. Scale bars: A–C, M–R, 75 μm; G–I, 30 μm; D–F, J–L, 25 μm. NBL, Neuroblast layer; IPL, inner plexiform layer; INL, inner nuclear layer; OPL, outer plexiform layer; ONL, outer nuclear layer; GCL, ganglion cell layer; GCFL, ganglion cell fiber layer.
- Figure 2.
GPR55 protein expression in retinal explants and primary cortical neurons. A, Expression of GPR55 in the mouse cortex and (B) retina at different developmental stages. C, Expression of GPR55 in the retina of gpr55+/+ and gpr55-/- mouse embryo (E14/15). D–F, Expression of GPR55 in retinal explants from gpr55+/+ and gpr55-/- mice, and in the presence of the specific blocking peptide (BP). G–I, E14/15 axons and growth cones of retinal explants from gpr55+/+ and gpr55-/- mice, and in the presence of the specific BP. J–L, The expression of GPR55 in dendrites (MAP2) and (M–O) axons (NFM) of RGCs. P, Expression of GPR55 in primary cortical neuron using GPR55 antibody, (Q) using 3 µm of specific GPR55 fluorescent Tocrifluor ligand T-1117 and (R) using GPR55 antibody in a purified RGC culture. Scale bars: D–F, 100 μm; G–I, P–R, 10 μm; J–O. 5 μm.
- Figure 3.
GPR55 ligands reorganize the morphology of the GC and modulate axon growth via a cannabinoid independent pathway. A–C, Growth cone surface area and filopodia number of retinal projection GCs after a 60 min treatment with GPR55 agonists LPI (1 µm) and O-1602 (300 nm) or antagonist CBD (300 nm) in WT, cnr1-/- , and cnr2-/- mice. D, E, Total retinal neurite growth of retinal explants cultured for 1 DIV and treated for 15 h with LPI (1 µm), O-1602 (300 nm), and CBD (300 nm) in WT, cnr1-/- , and cnr2-/- mice. Scale bars: A, 5 μm; D, 100 μm. Values are presented as mean ± SEM. *Indicates significant changes between LPI, O-1602, or CBD compared with control in B, C, and E; p < 0.004.
- Figure 4.
GPR55 mediates the reorganization of the GC morphology and the modulation of axon growth. A–D, Basal growth cone surface area, filopodia number and total neurite outgrowth in gpr55+/+ and gpr55-/- retinal explants. E–G, Growth cone surface area and filopodia number in gpr55+/+ and gpr55-/- retinal explants treated for 1 h with LPI (1 µm), O-1602 (300 nm), or CBD (300 nm). H, I, Total neurite outgrowth in gpr55+/+ and gpr55-/- retinal explant treated for 15 h with LPI, O-1602, or CBD at the same previously cited concentrations. Scale bars: A, E, 5μm for GC; A, H, 100 μm for explants. Values are presented as mean ± SEM. *Indicates a significant change induced by LPI, O-1602, or CBD compared with the control in F, G, and I; p < 0.0001; #Indicates a significant change between LPI, O-1602, or CBD and the control in gpr55+/+ compared to gpr55-/- in F, G, I, and B–D; p < 0.004.
- Figure 5.
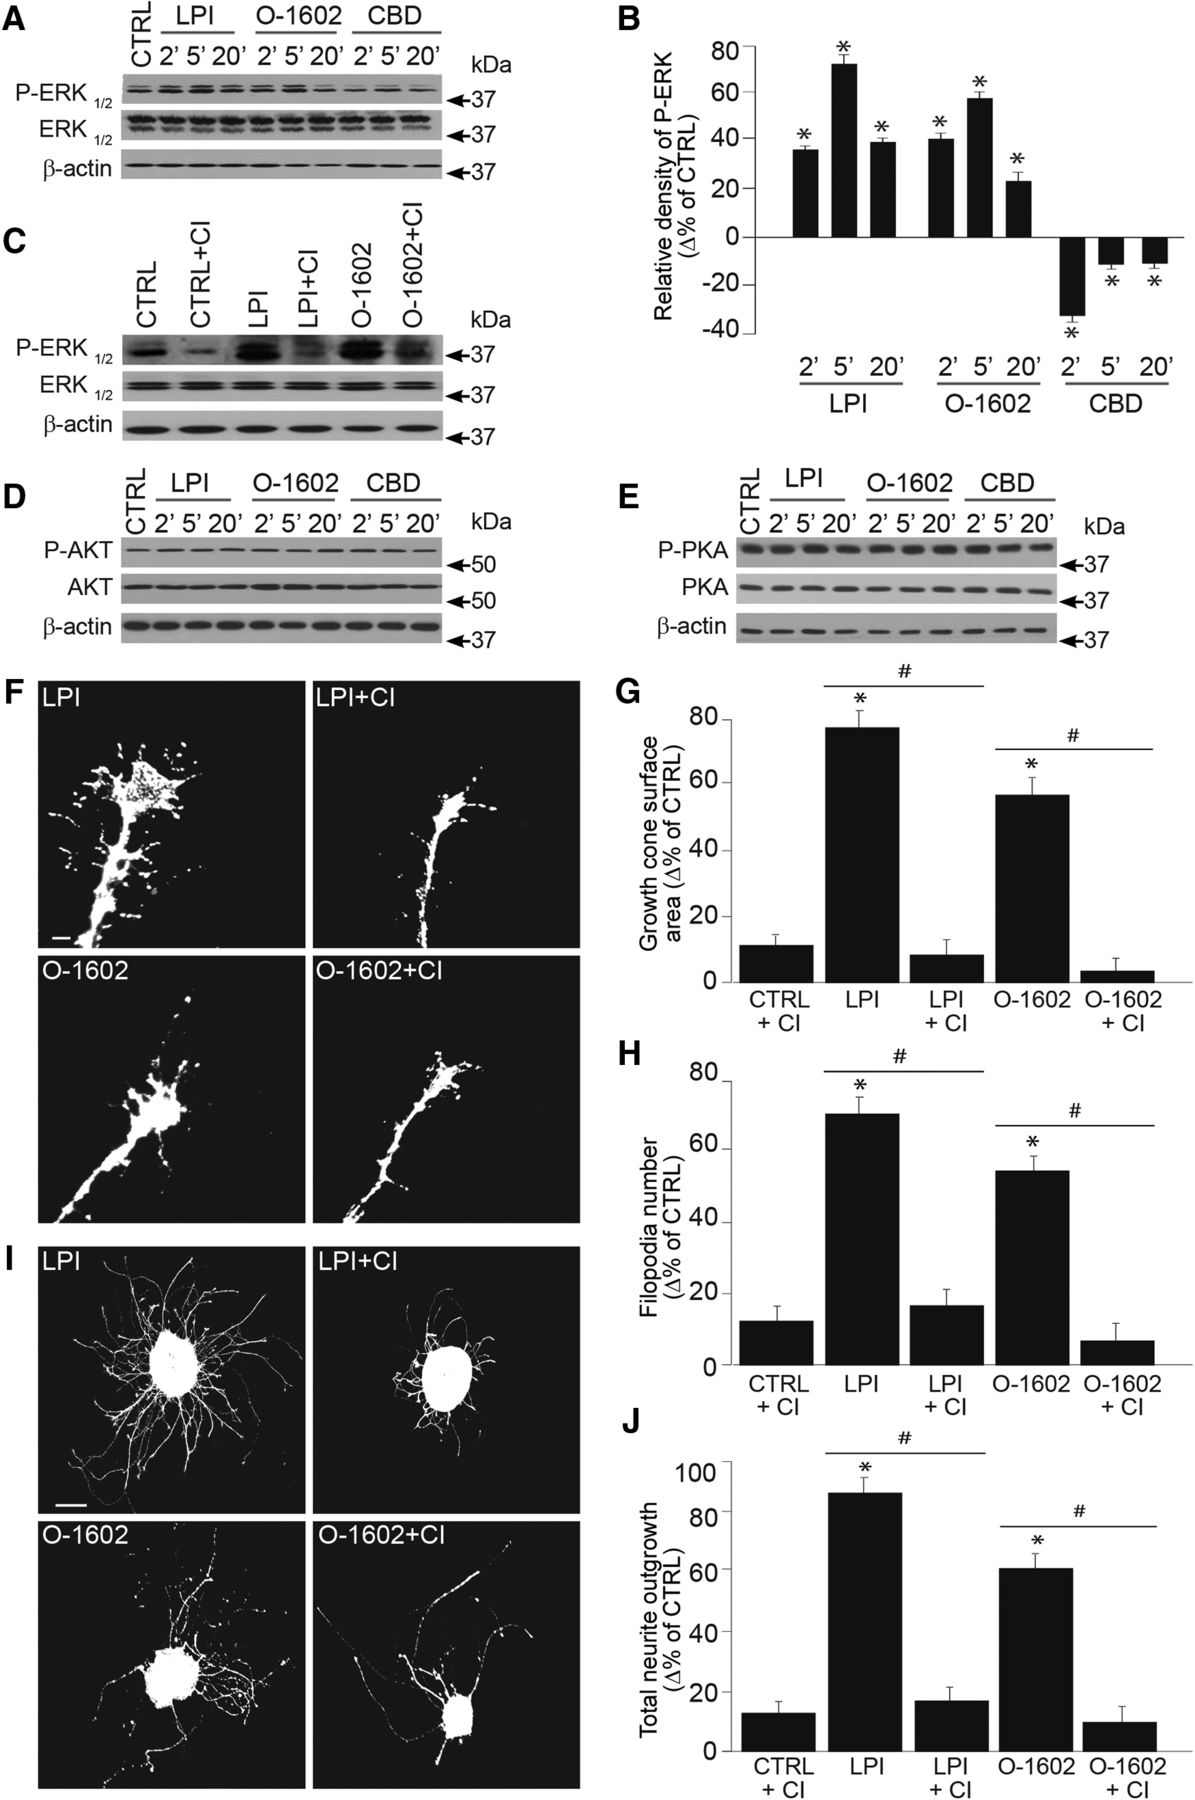
At low concentration, GPR55 ligand modulates GC morphology and axon growth via the ERK1/2 pathway. A, Expression of P-ERK-1/2, ERK-1/2 and β-actin in primary cortical neurons incubated with one of the following: 1 µm LPI, 300 nm O-1602, or 300 nm CBD at 37°C for 2, 5, and 20 min. The antibody β-actin was used to verify (and correct for) equal loading in all lanes. B, Histogram illustrating the quantification of ERK-phosphorylation. C, ERK phosphorylation state following 15 min pretreatment with CI-1040, an ERK1/2 inhibitor, before the incubation with or without 1 µm LPI, 300 nm O-1602 or 300 nm CBD. D, E, AKT and PKA phosphorylation states, no significant variations were observed in the presence of GPR55 ligands for the times indicated. F–H, Growth cone surface area and filopodia number of retinal explant treated with GPR55 agonists in the presence or the absence of the ERK inhibitor. I–J, Total projection growth of retinal explant cultures treated with GPR55 agonists LPI and O-1602 in the presence or the absence of CI-1040. Scale bars: F, 10 μm; I, 100 μm. Values are presented as mean ± SEM. *Indicates a significant change compared with the control group in B, G, H, and J; p < 0.0001. #Indicates a significant change induced by the ERK inhibitor in G, H, and J; p < 0.004.
- Figure 6.
At a higher concentration, LPI activates RhoA pathway and produces growth cone collapse and neurite repulsion. A, B, Using p-RhoA and RhoA antibodies, RhoA activation was determined analyzing the respective phosphorylation state by Western blotting following treatment with 1 or 10 µm LPI. C–E, Growth cone surface area and filopodia number of retinal explants after treatment with GPR55 agonist in the presence or the absence of the ROCK1 inhibitor, Y-27632. F, G, Total projection length of retinal explant treated with GPR55 agonist LPI (1 or 10 µm) in the presence or the absence of the Y-27632. Scale bars: C, 5 μm; F, 100 μm. Values are presented as mean ± SEM. *indicates a significant change compared to the control group; #indicates a significant change induced by CBD (300 nm) or Y-27632 (20 µm) in D, E, and G; p < 0.0001 and p < 0.001 in B.
- Figure 7.
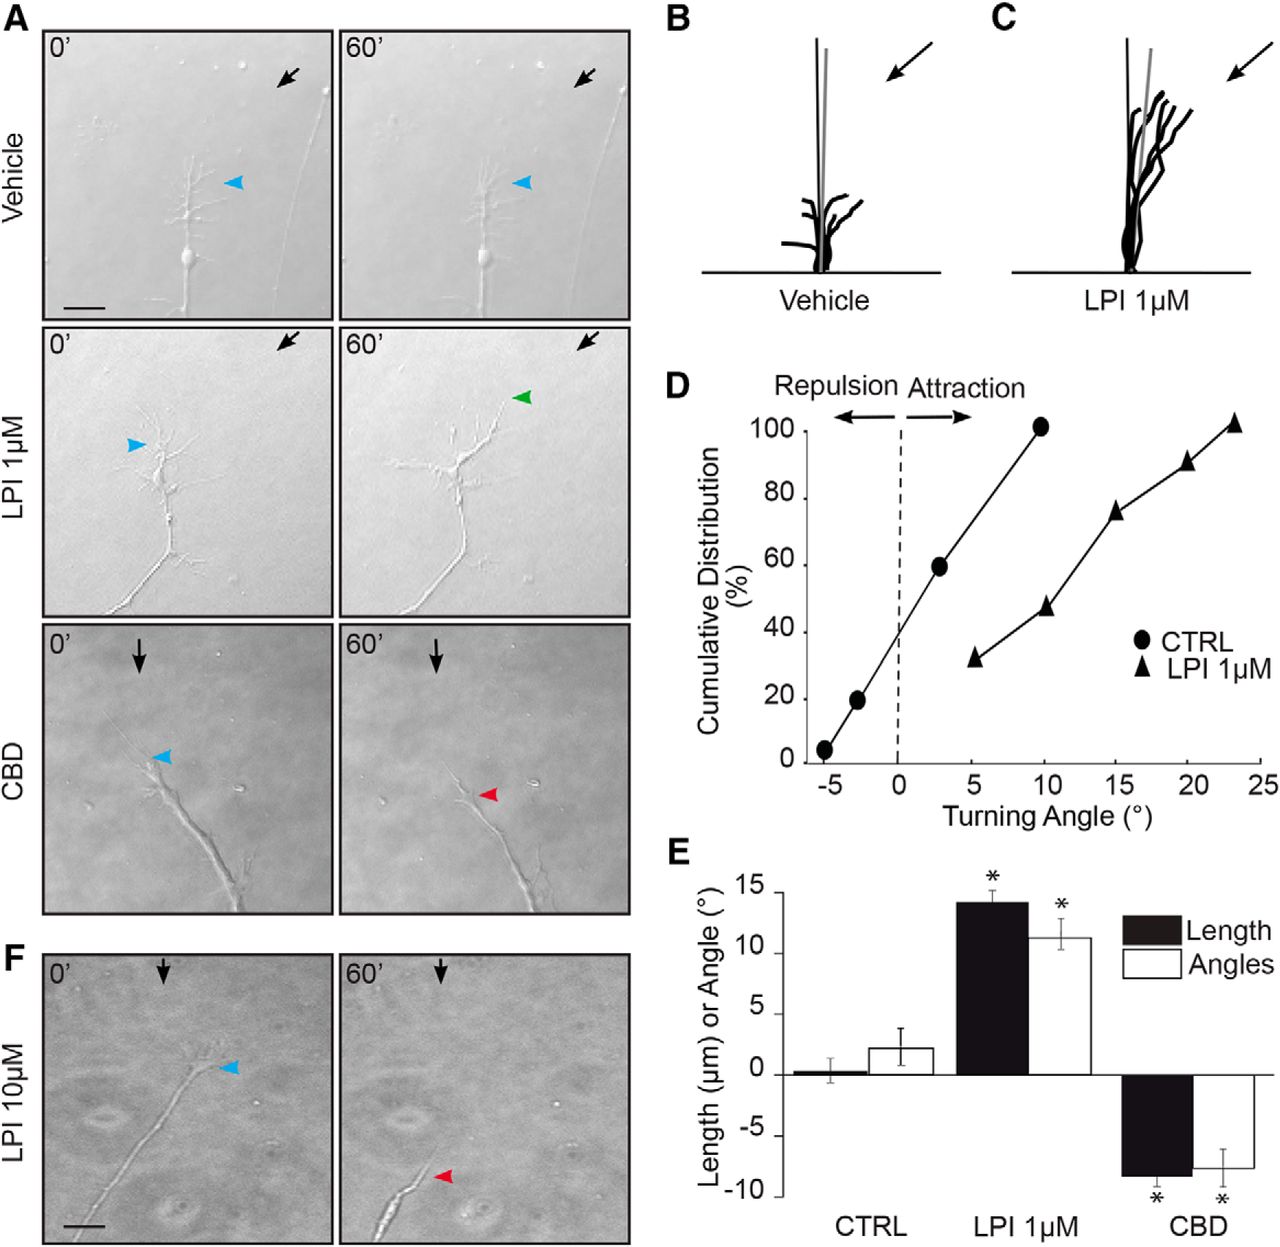
Pharmacological modulation of GPR55 affects RGC turning in vitro. A, Photomicrographs of time-lapse microscopy from 1 DIV mouse retinal explant growth cone taken at t = 0 min and t = 60 min during GC turning assay experiments. Black arrows indicate the direction of the microgradient, whereas blue arrowheads indicate initial GC position. Green arrowheads show the GC position following neurite attraction and red arrowheads indicate the GC position after repulsion. B, C, Superimposed RGC axon trajectories over the 60 min observation period for vehicle and LPI; no significant changes were observed on growth cone behavior in the presence of the vehicle, whereas LPI increased axon growth and turning toward the pipette tip. Black arrows indicate the direction of the gradient. D, Turning angle cumulative frequency curves of RGC growth cones. The turning angle of each growth cone was plotted against the percentage of growth cones turning that angle or less. E, Quantification of neurite elongation and GC turning responses following drug stimulation. F, Representative photomicrograph of the effect of repulsion and GC collapse created during 60 min stimulation with 10 µm LPI. Scale bars: A, F, 40 μm. Values are presented as means ± SEM; *indicates significant change compared with the vehicle in E; p < 0.0001.
- Figure 8.
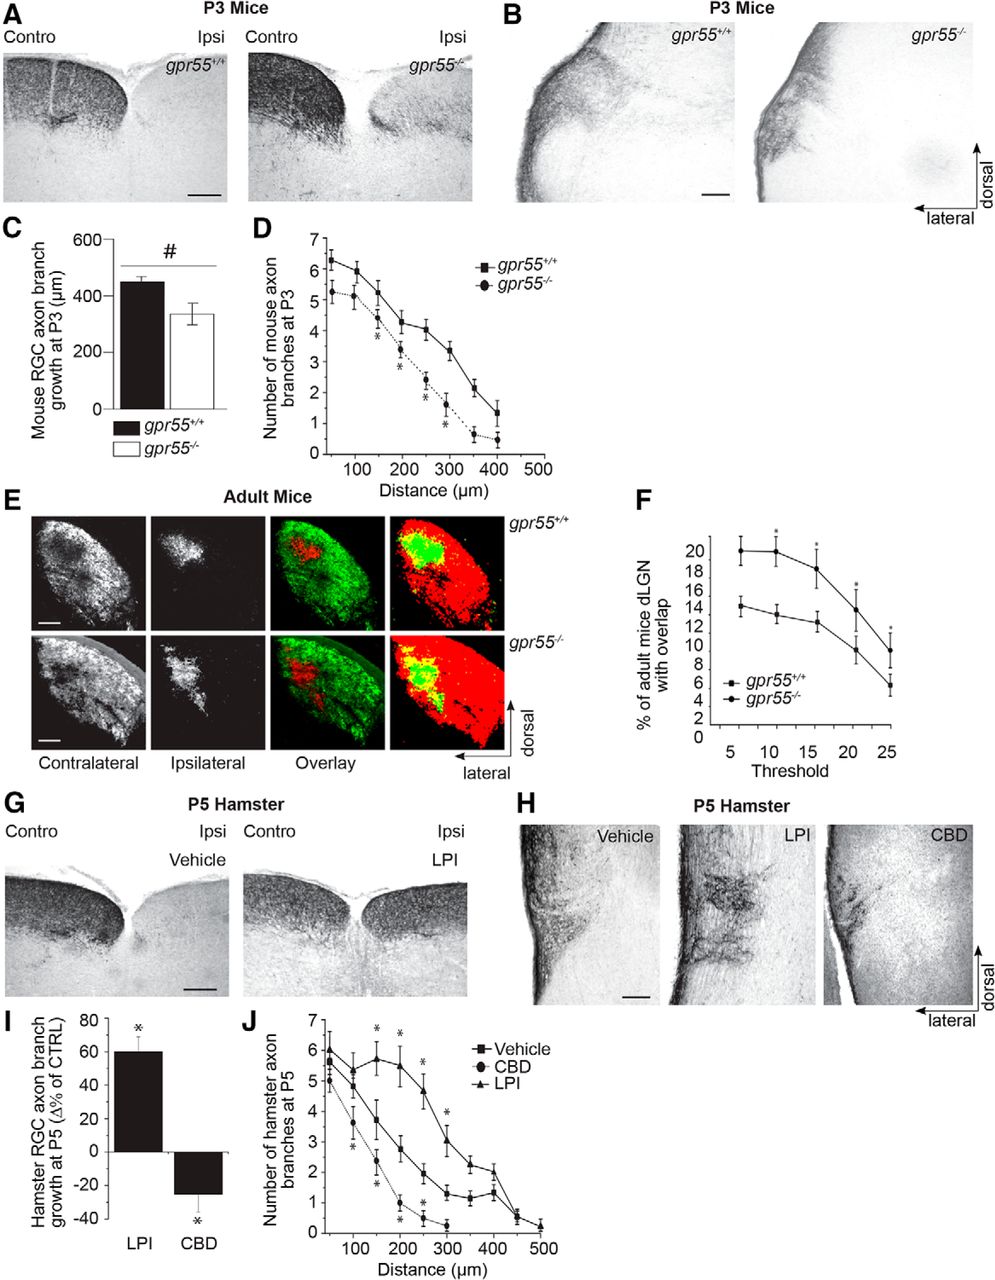
GPR55 plays an important role during retinal projection growth and target selection in vivo. A, Photomicrographs of retinal projections in the SC of P3 gpr55+/+ and gpr55-/- mouse pups injected, at P1, in one eye with CTb. B, Photomicrographs of retinal projections in the DTN of P3 gpr55+/+ and gpr55-/- mice C, Quantification of retinal projection development in the DTN of gpr55+/+ and gpr55-/- ; collateral projection length are expressed as mean ± SEM. D, Number of collateral axon branches decreases in gpr55-/- compared to gpr55+/+ mice. E, Images of retinogeniculate projection patterns visualized following CTb conjugated to AlexaFluor 555 (CTb-555; red) and CTb-488 (green) injections into left and right eyes of gpr55+/+ and gpr55-/- adult mice. Merged images show all projections from both eyes to the dorsal lateral geniculate nucleus, overlaying projections are shown in yellow. F, Quantification in gpr55+/+ and gpr55-/- adult mice of the percentage of the dLGN receiving overlapping inputs as mean ± SEM. G, Photomicrographs of retinal projections in the SC of P5 hamsters injected, at P1, in one eye with CTb and LPI or vehicle. A single injection of LPI induced aberrant projections in the ipsilateral SC. H, Photomicrographs of P5 hamster retinal projections in the DTN in the control, LPI, and CBD groups. I, Quantification of retinal projection development in the DTN; collateral projection length are expressed as mean ± SEM. J, Number of collateral axon branches in treated groups compared to the control group. LPI increased axon growth and collateral branch number, whereas CBD decreased these endpoints compared with the control. Scale bars: A, B, E, G, 200 μm; H, 100 μm. n = 8 brains per condition for P3 mice, n = 7 brains per condition for adult mice, and n = 5 brains per condition for P5 hamsters; *indicates significant change compared with the control group in C, D, F, I, and J; p = 0.0001.


Tables
Data structure Type of test Power All statistical tests a–t Normally distributed ANOVA with post hoc Bonferroni 0.9–1.0 Test u Normally distributed Student’s t test 0.921 Statistical analyses were performed by ANOVA with Bonferroni’s post hoc test and Student’s t tests (Systat software).
In this issue


